Assessing rheumatoid arthritis by measuring anti-CCP and interleukin 6
- Summary
- Abstract
- Description
- Claims
- Application Information
AI Technical Summary
Problems solved by technology
Method used
Image
Examples
specific embodiments
Example 1
Study Population
[0095] Samples derived from 389 highly characterized RA patients with maximum disease duration of 15 years were collected in five European centers with a follow-up of two years. All individuals were diagnosed as RA-patients according to the ARA-criteria and had a functional status of ≦III as classified by the ARA classification criteria (Hochberg, M. C., et al., Arthritis Rheum. 35 (1992) 498-502). All patients were documented with an extensive case report form (CRF). The CRF included the Health Assessment Questionnaire, the SF36 Questionnaire, swollen and tender joint count, the Larsen Score, laboratory parameters, clinical history of relevant surgery, medication, co-morbidities and medication for co-morbidities. X-rays were taken every year following a standardized procedure. Only baseline samples obtained from the subjects included in this study were included in the present analysis.
[0096] Samples derived from 624 control subjects were collected as we...
example 2
Markers Measured
[0098] Table 2 presents a selection of the assays used and gives the test format as well as the suppliers of the assays. Most of the assays were manual microtiter plate format (MTP) ELISAs. RF and CRP were determined in a homogeneous test format on an automatic Hitachi analyzer. Marker concentrations were determined in serum samples with these commercially available assays for patients as well as for controls.
TABLE 2Assays and SuppliersBiomarkerAssay type / formatSourceAnti-CCPSandwich ELISA, MTPAxis-Shield, Dundee(UK)CRPHomogenous assay, HitachiRoche Diagnostics,Mannheim (FRG)Hyaluronic acidSandwich ELISA, MTPChugai, Tokyo (J)IL-6Sandwich ELISA, MTPRoche Diagnostics,Mannheim (FRG)RFHomogenous assay, HitachiRoche Diagnostics,Mannheim (FRG)SAASandwich ELISA, MTPBiosource, Nivelles(B)
example 3
Statistical Evaluation
[0099] The patient cohorts were randomly split in a training set (app. 67%) and in a test set (app. 33%). On the training set a classification algorithm was develop and on the independent test set the algorithm was validated. As can be seen in Table 3 the respective sets were closely matched in size as well as age.
TABLE 3Age distribution of collectivesMe-GroupStudyNMeanMaxq3dianq1MinTrainingRA25958.78768595123TrainingControls26160.29269605142incl. OATestRA13059.88368615216TestControls12961.38470635238incl. OA
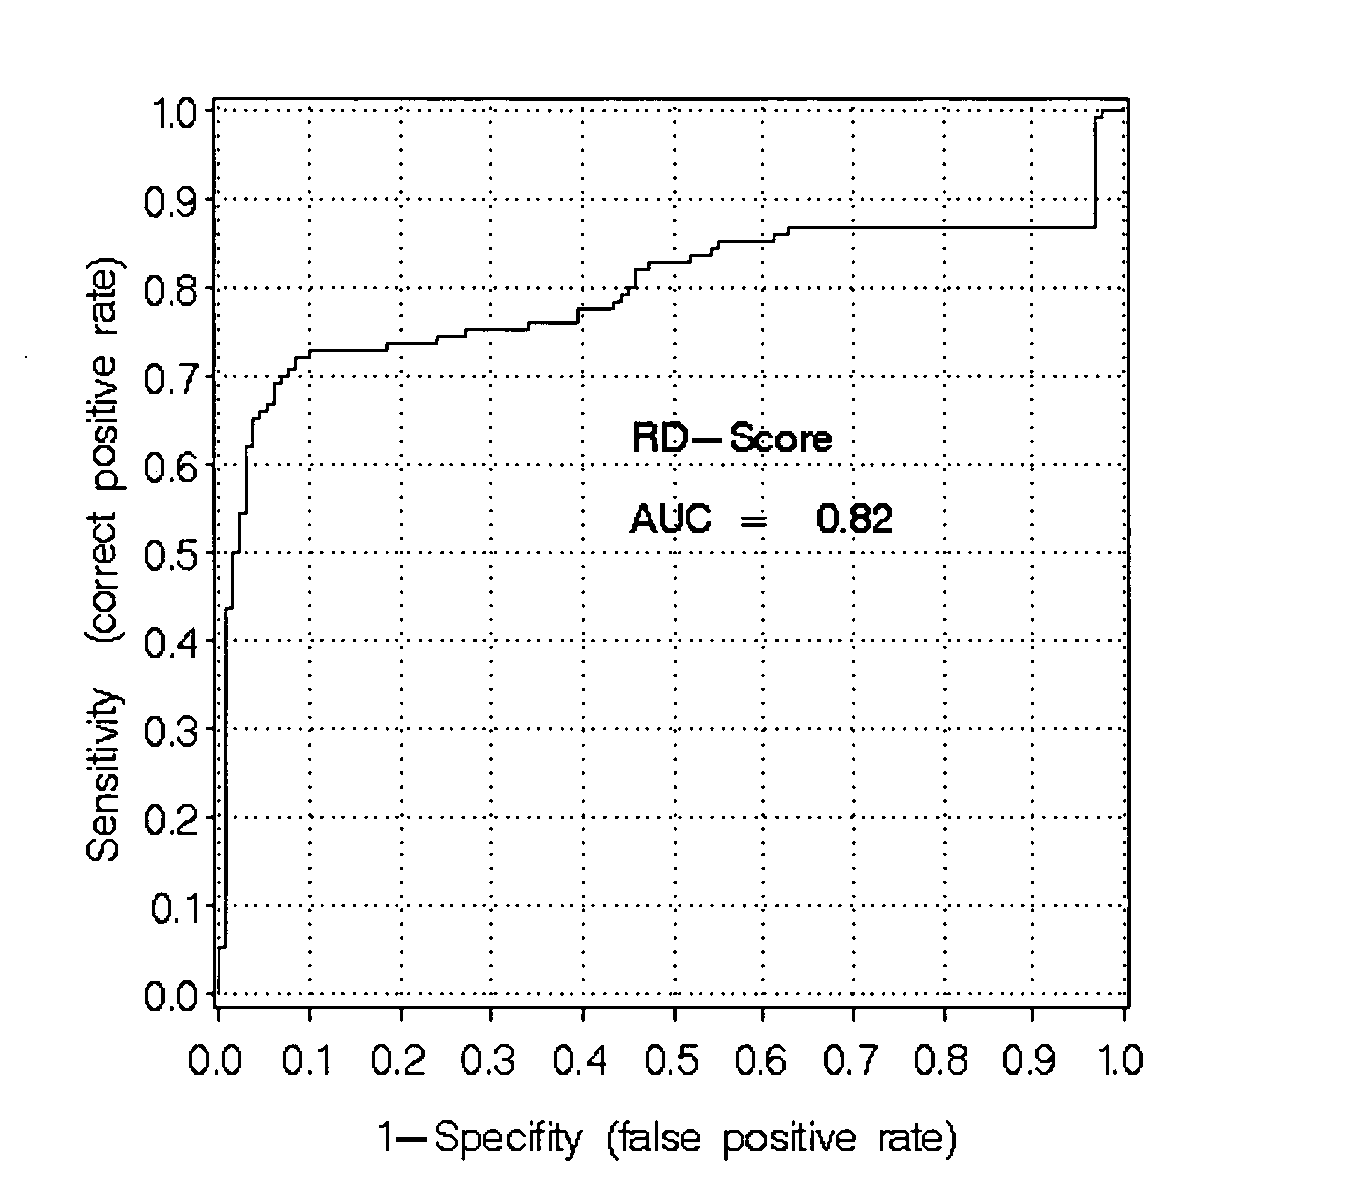
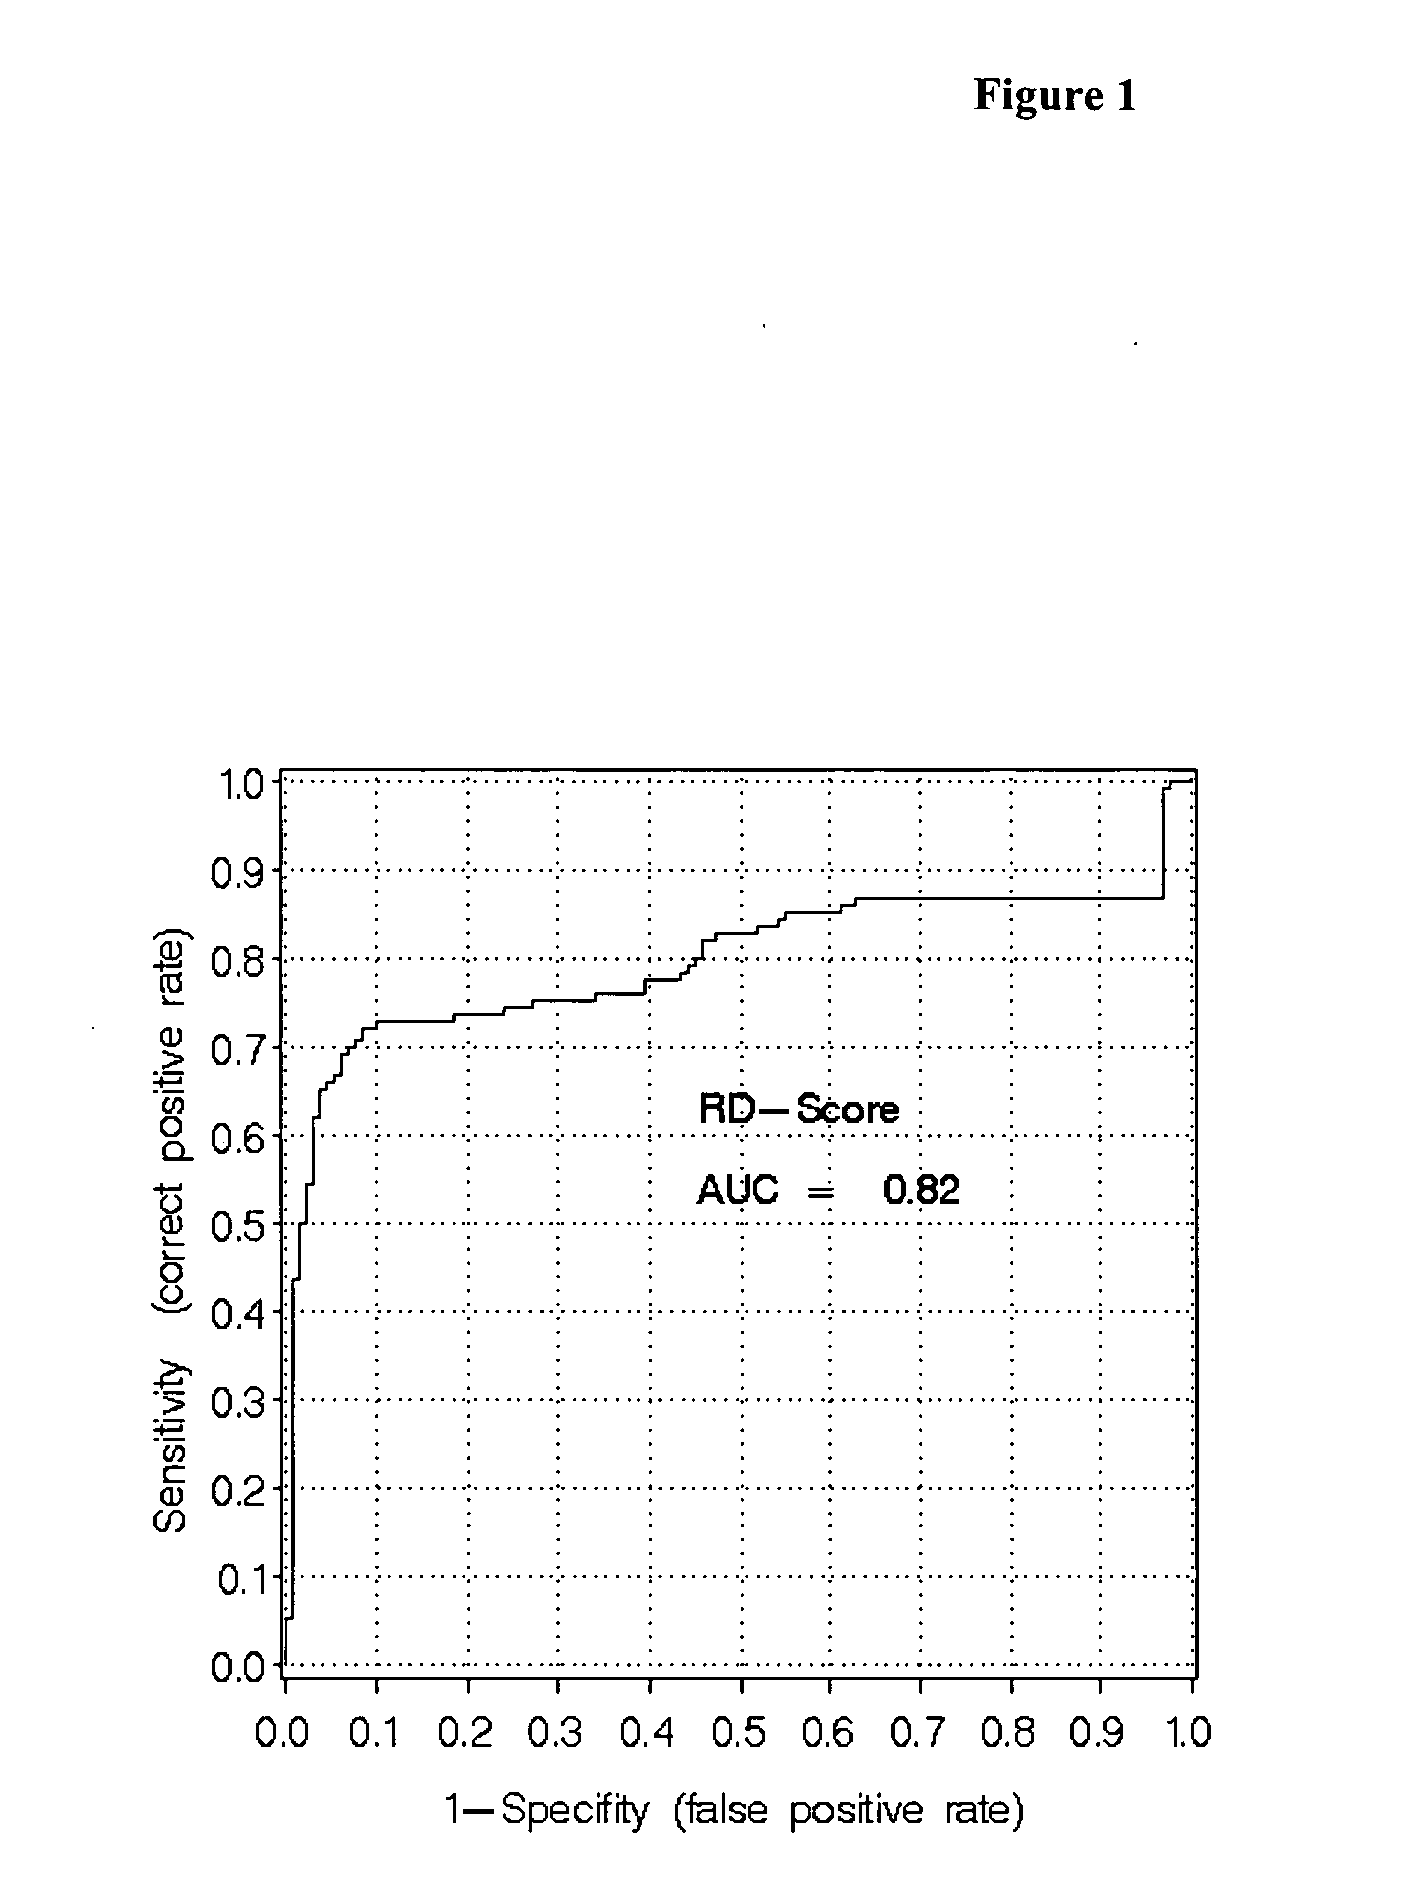
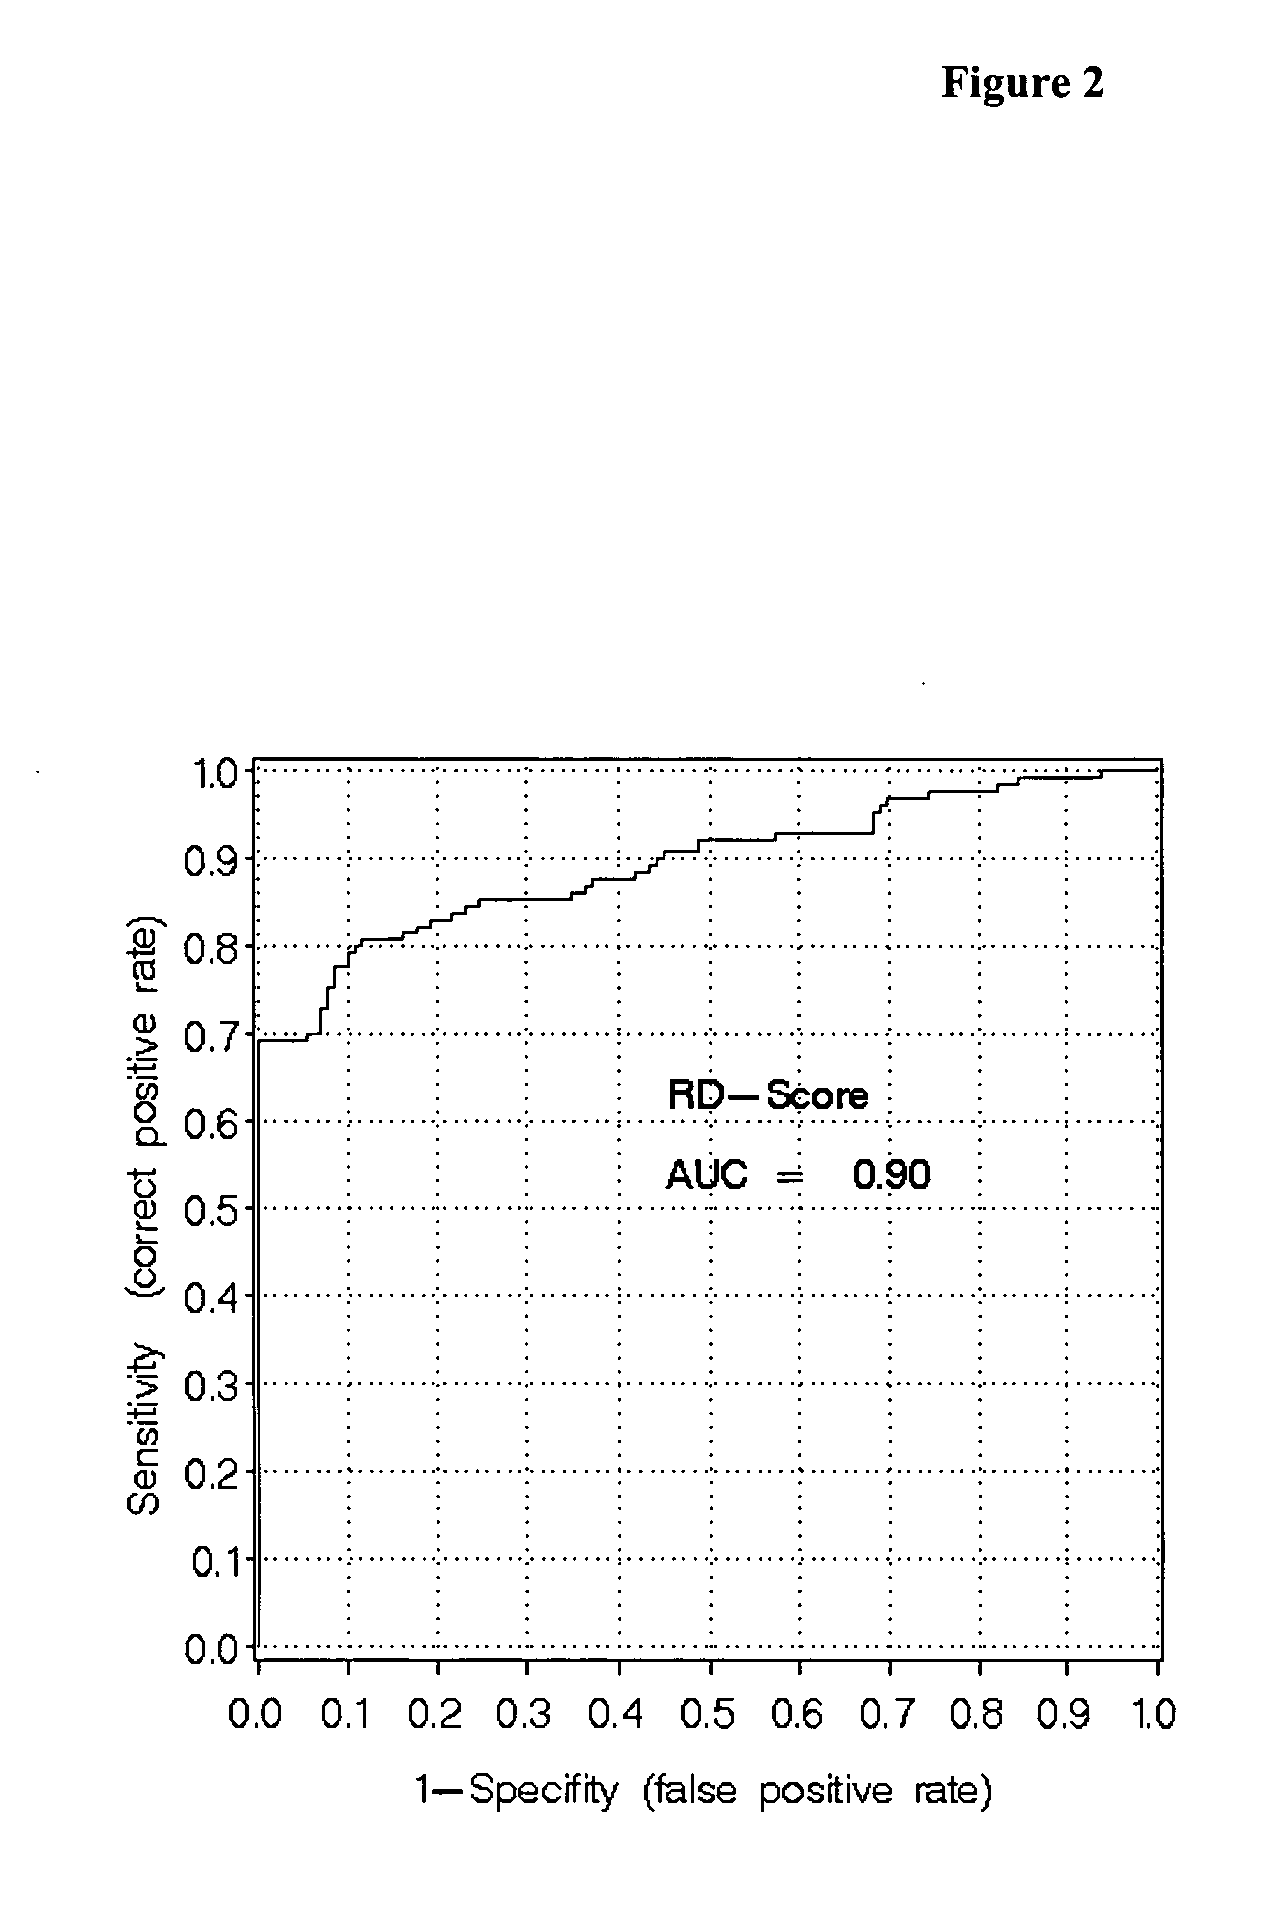
[0100] The classification algorithms were generated with the Regularized Discriminant Analysis (RDA), which is a generalization of the common Discriminant Analysis, i.e. Quadratic- and Linear Discriminant Analysis (McLachlan, G. J., Discriminant Analysis and Statistical Pattern Recognition, Wiley Series in probability and mathematical statistics, 1992). In the RDA alternatives to the usual maximum likelihood (plug-in) estimates for the covariance matric...
PUM
 Abstract
Description
Claims
Application Information
 - R&D
- Intellectual Property
- Life Sciences
- Materials
- Tech Scout
- Unparalleled Data Quality
- Higher Quality Content
- 60% Fewer Hallucinations
Browse by: Latest US Patents, China's latest patents, Technical Efficacy Thesaurus, Application Domain, Technology Topic, Popular Technical Reports.
© 2025 PatSnap. All rights reserved.Legal|Privacy policy|Modern Slavery Act Transparency Statement|Sitemap|About US| Contact US: help@patsnap.com


