

Systems and methods for classification of biological datasets
- Summary
- Abstract
- Description
- Claims
- Application Information
AI Technical Summary
Problems solved by technology
Method used
Image

Examples
example 1
System Overview for Prostate Cancer Detection
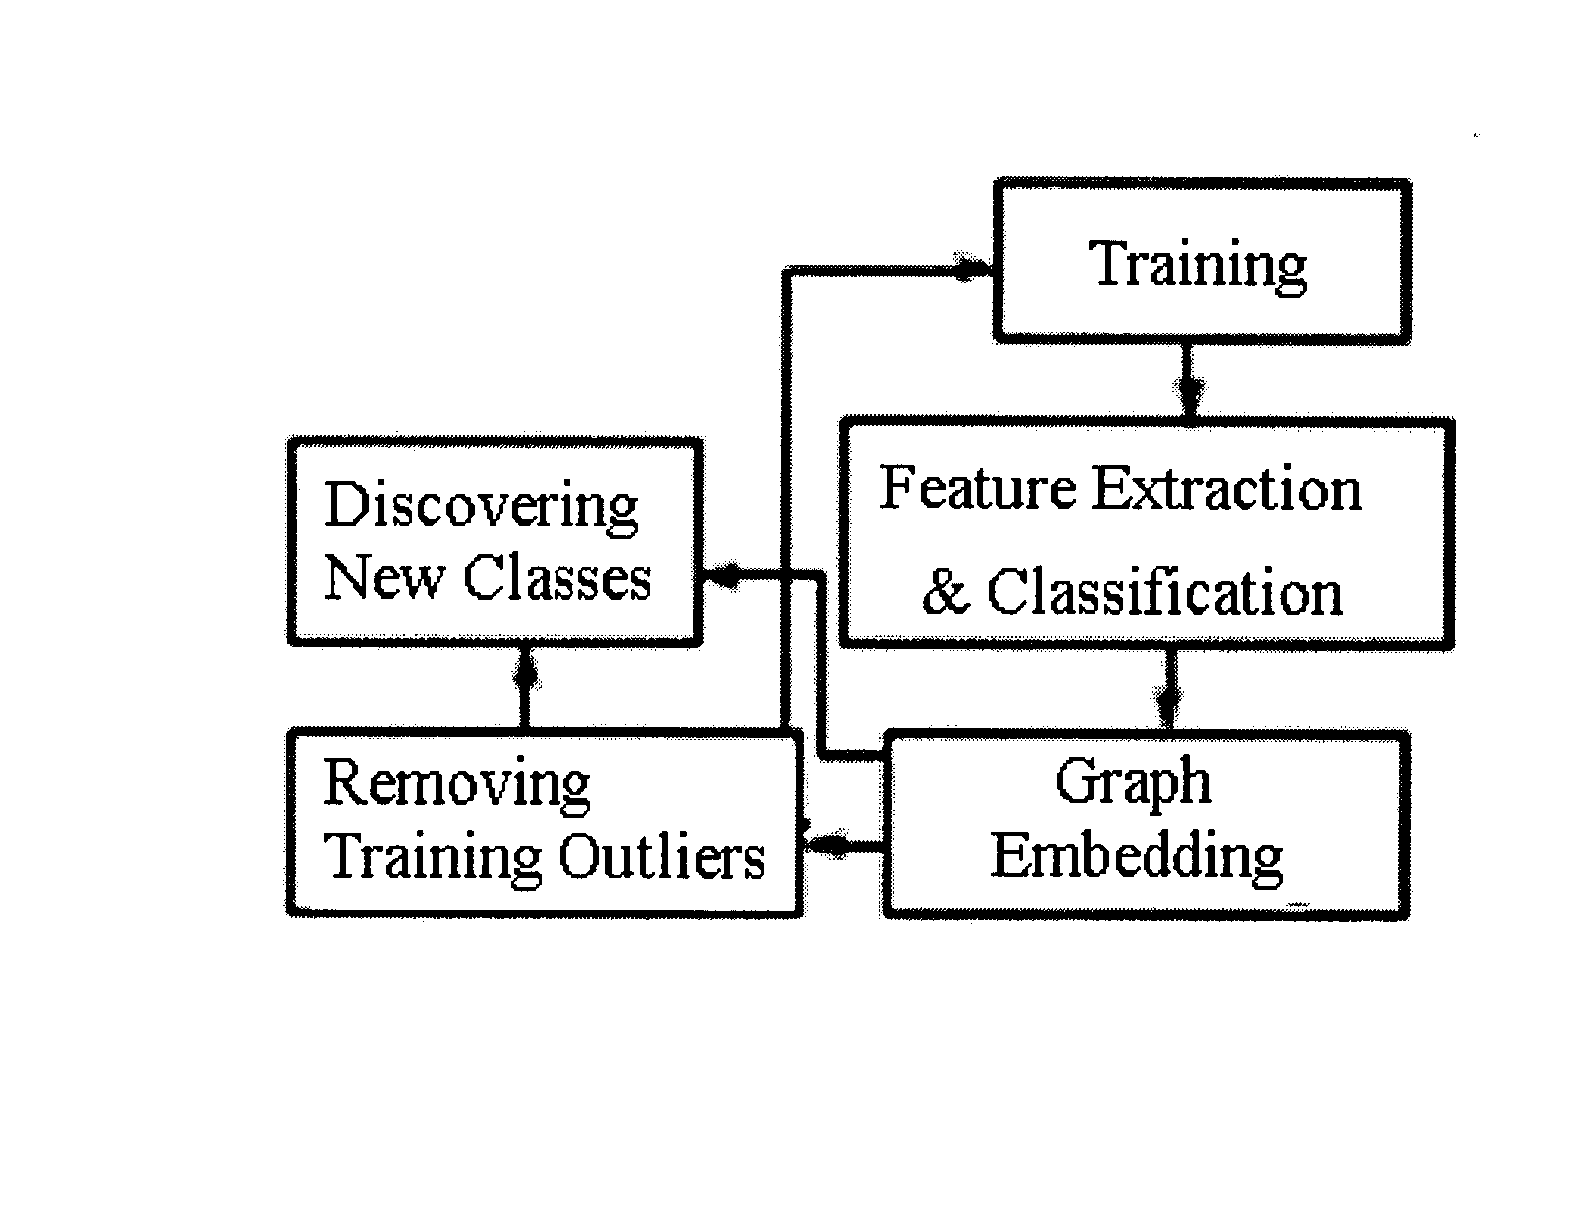
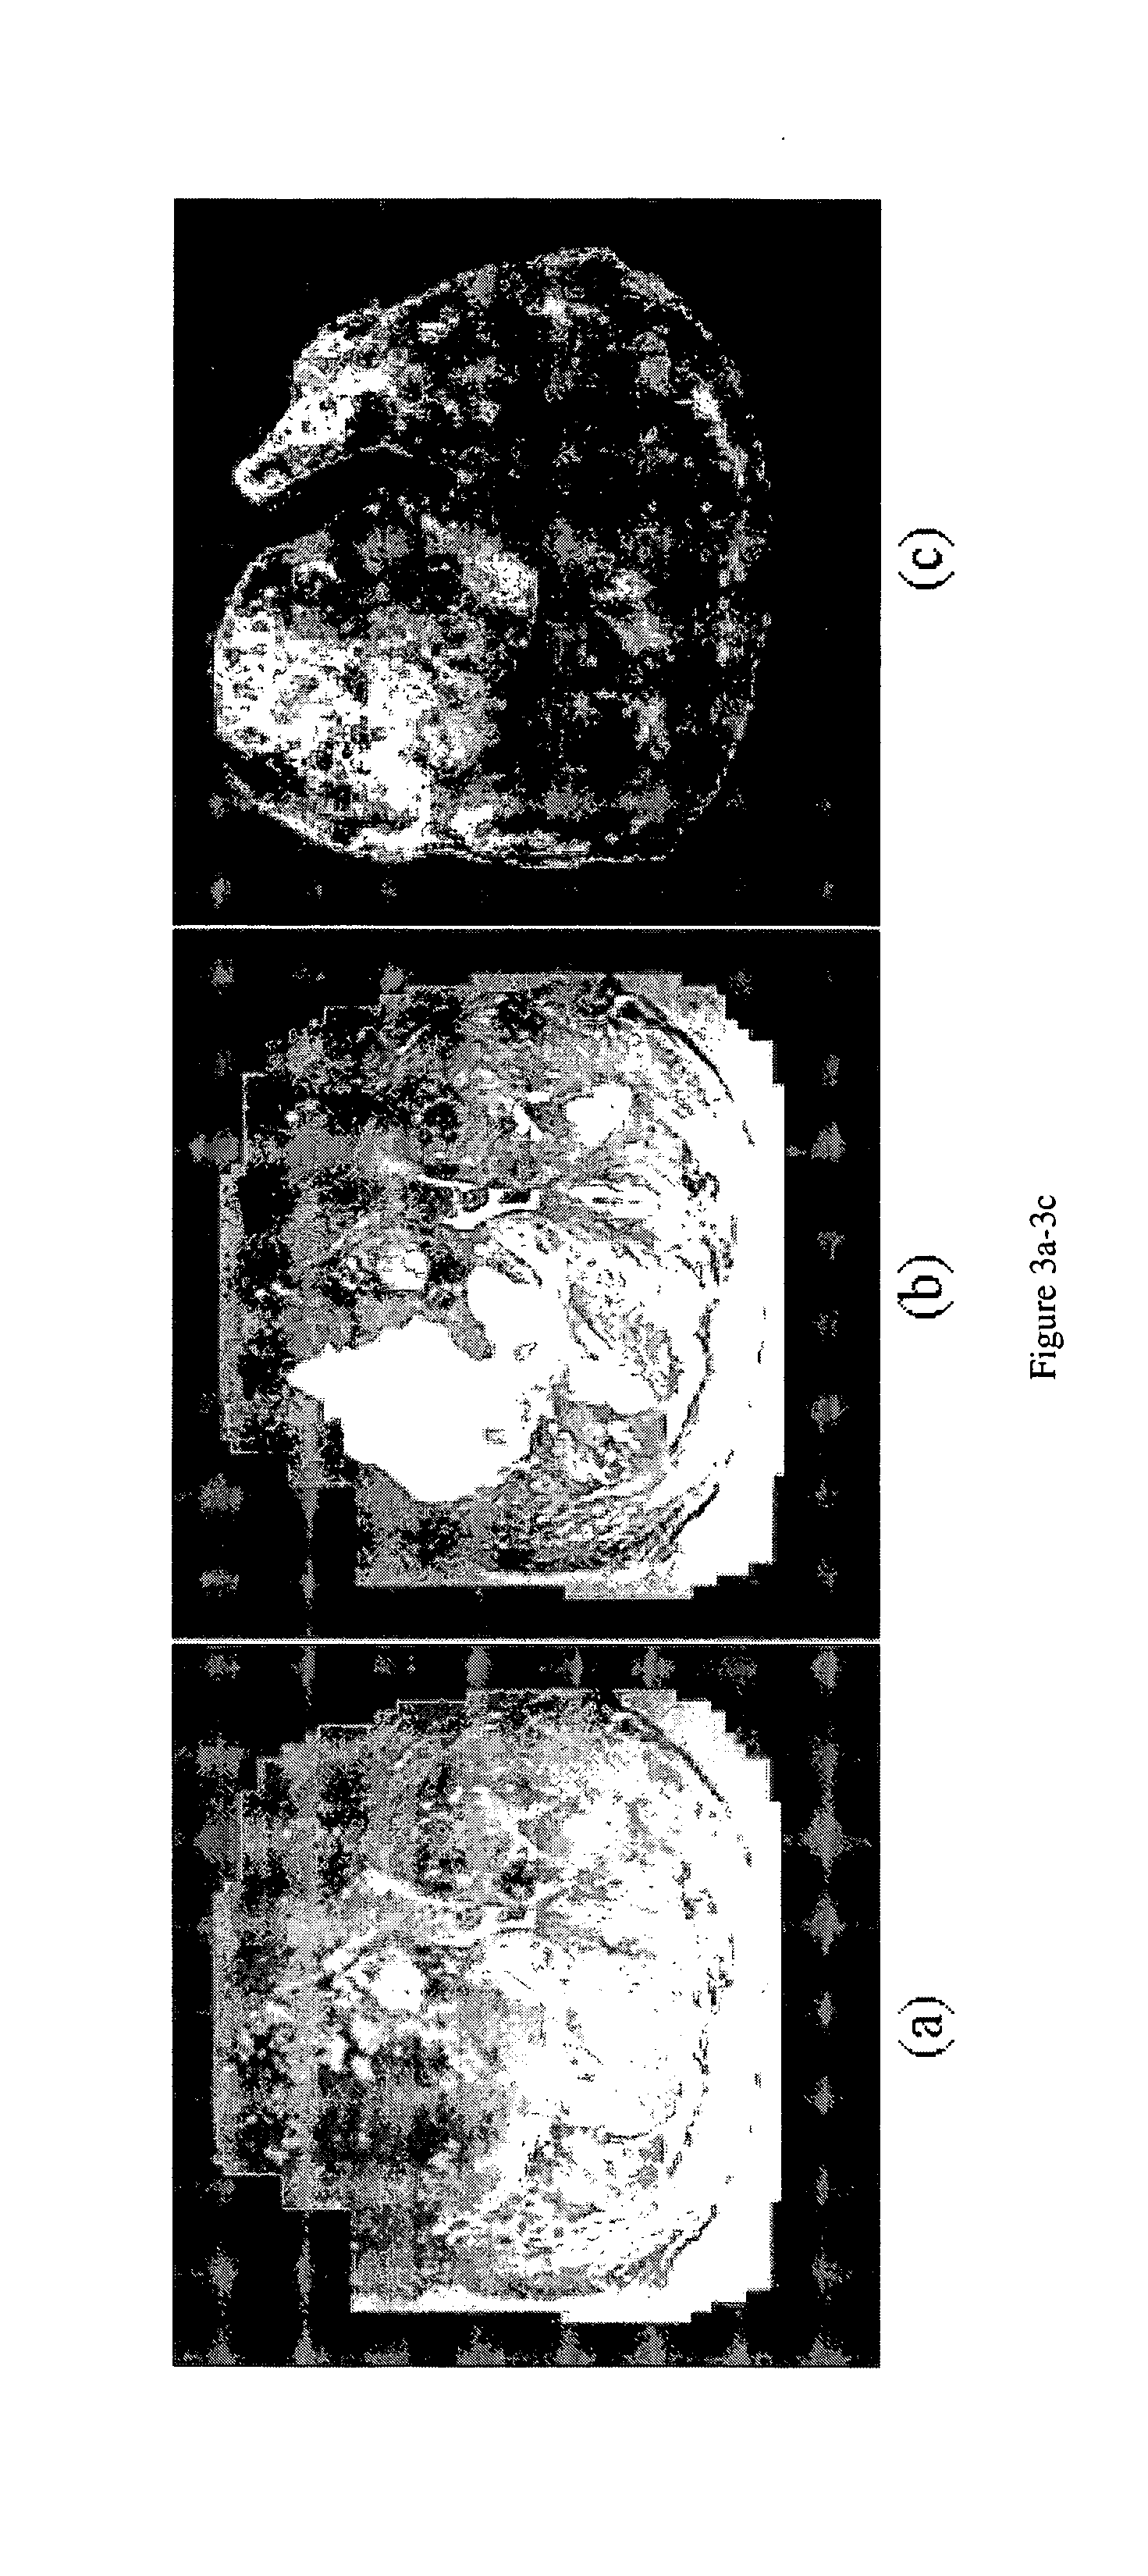
[0072]FIG. 2 shows the main modules and pathways comprising the system. FIG. 3 shows the results of graph embedding on a high resolution MR study of the prostate (FIG. 3(a)). FIG. 3(c) is a map of the posterior likelihood of every voxel belonging to the tumor class; the posterior likelihood being derived from the prior distribution (dashed line in FIG. 3(f)), is obtained with the initial set of tumor class labels (FIG. 3(b)) and FIG. 3(e) shows the corresponding probability image using the refined prior distribution after graph embedding (solid line in FIG. 3(f)). The plot of graph embedding (FIG. 3(d)) shows considerable overlap (ellipse 3) between the tumor (red circles) and non-tumor (black dots) classes. Using the refined probability map in FIG. 3(e), the resultant embedding (FIG. 3(f)) shows a clear separation between the two classes (ellipses 1, 2). The increased class separation is also reflected in the increased image contrast of...
example 2
Evaluating CAD Accuracy for Prostate Cancer on MRI
[0073] The likelihood scene is thresholded to obtain binary scene LˆB=(C, lˆB) so that for cεC, ˆlB(c)=1 if ˆl(c)>δ, where δ is a pre-determined threshold. ˆLB is similarly obtained. ˆLB and {tilde over ( )}LB are then compared with Ŝωt and {tilde over (S)}ωt respectively to determine Sensitivity and Specificity values for different values of δ. Receiver operating characteristic (ROC) curves (plot of Sensitivity versus 100-Specificity) provide a means of comparing the performance of detection tasks. A larger area under the ROC curve implies higher accuracy. A total of 33 MR images of the prostate were used for quantitatively comparing {tilde over ( )}L and ˆL for different values of δ. FIGS. 4(a) and (b) show the ROC curves for ˆL (dashed line) and {tilde over ( )}L (solid line) for two different feature combination methods (ensemble averaging and majority voting) using 5 and 10 training samples respectively. The accuracy of {tilde ...
example 3
Application to MRI Imaging Studies to Detect Pre-Malignant Lesions
[0074]FIG. 5 shows the comparison between the cancer likelihood images obtained via the applicants' supervised CAD model for CAP (5(c)) and human experts (5(d)) on a 4-T ex vivo MR image slice (5(a)) and compared to histological determined tumor ground truth (5(b)). Three different human expert segmentations, blinded to ground truth in 5(b) have been superposed on the same figure (5(d)). The bright areas on 5(c) are those determined by CAD to have high cancer likelihood, while bright areas on 5(d) represent areas where all 3 experts agreed cancer was present. Note that, (i) in spite of some false positive and false negative errors, CAD results (5(c)) are comparable to the expert segmentations and (ii) the low levels of inter-observer agreement (5(d)) FIG. 5(e) shows a cluster plot of all image pixels in FIG. 5(a) grouped together based on over 40 textural and intensity attributes. The embedding plot (5(e)) shows the ...
PUM
 Abstract
Description
Claims
Application Information