
Assessment of effect of an agent on a human biological condition using rodent gene expression panels

a technology of gene expression and human biological condition, applied in the field of gene expression data, can solve the problems of many agents failing animal testing

Inactive Publication Date: 2008-09-18
BEVILACQUA MICHAEL +5
View PDF5 Cites 14 Cited by
  • Summary
  • Abstract
  • Description
  • Claims
  • Application Information

AI Technical Summary

Benefits of technology

[0008]In a preferred embodiment the method for assessing the effect of an agent on a human biological condition of interest is performed using amplification to measure the amount of RNA of all of the constituents of the Signature Panel, and the efficiencies of amplification (expressed as a percent) for all constituents are substantially similar. In a preferred embodiment, the efficiencies of amplification for all constituents are substantially similar if they differ by no more than 10%, preferably no more than 5%, more preferably no more tha

Problems solved by technology

However, many agents fail animal testing for unknown reasons, or may only treat and / or mask the symptoms in such animal models, rather than the underlying biological condition.

Method used


Image

  • Assessment of effect of an agent on a human biological condition using rodent gene expression panels
  • Assessment of effect of an agent on a human biological condition using rodent gene expression panels
  • Assessment of effect of an agent on a human biological condition using rodent gene expression panels

Examples


example 1

Mouse Gene Expression Analysis in Whole Blood

Assay 1

[0225]Whole blood samples from five male and five female BALB / c mice were collected on a weekly basis over the course of three weeks to evaluate the longitudinal gene expression response in murine whole blood. Gene expression analysis was performed by quantitative PCR (QPCR) using a custom 24-gene Mouse Expression Panel (Precision Profile™) for Inflammation (Table 3).

[0226]Normalized ΔCt values for all ten mice (BALB / c) over a 3 week time period are provided in Table 10.

[0227]Inter-subject variability within individual groups was determined by the % CV (coefficient of variation) from all ten animals on a weekly basis (Table 10). Percent CV's were observed to be less than 4%, with the exception of one gene, PLAU, at week 2. These data demonstrate a remarkable consistency in levels of gene expression within the 10 animals in each group on a weekly basis for all three weeks.

[0228]Intersubject variability for all three groups was also ...

example 2

Gene Expression in Human and Mouse Whole Blood stimulated with LPS In Vivo

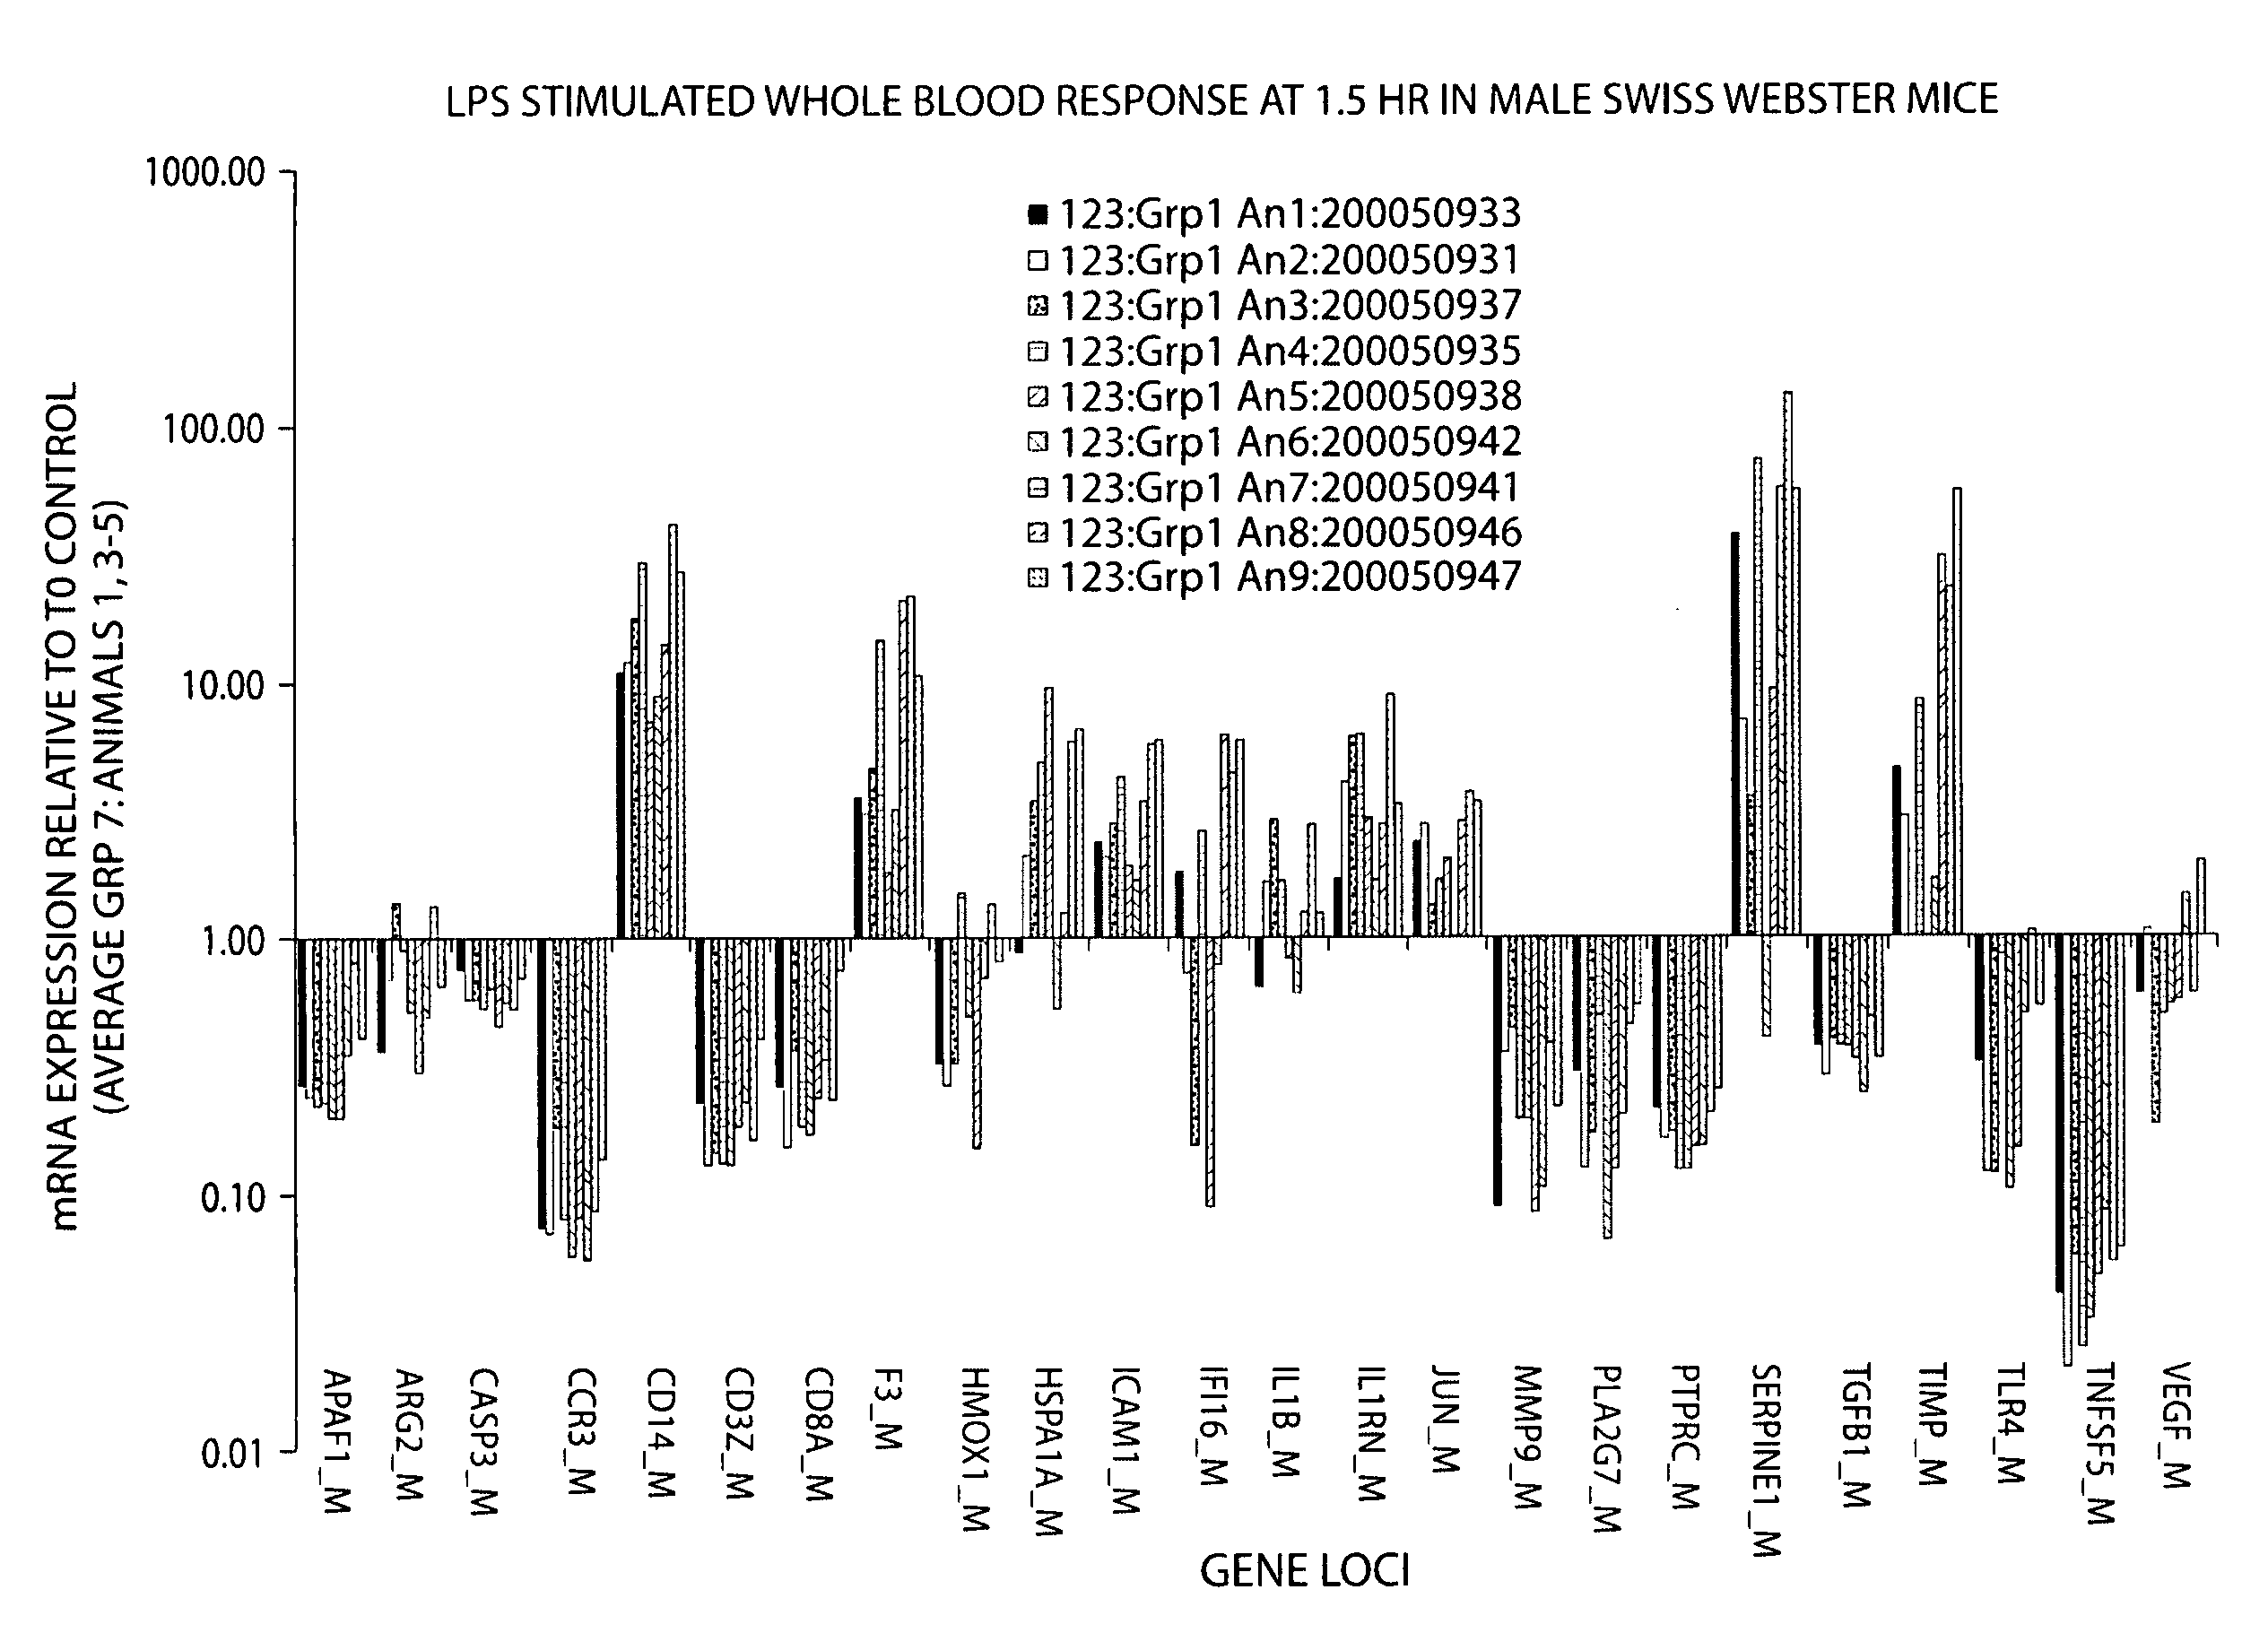
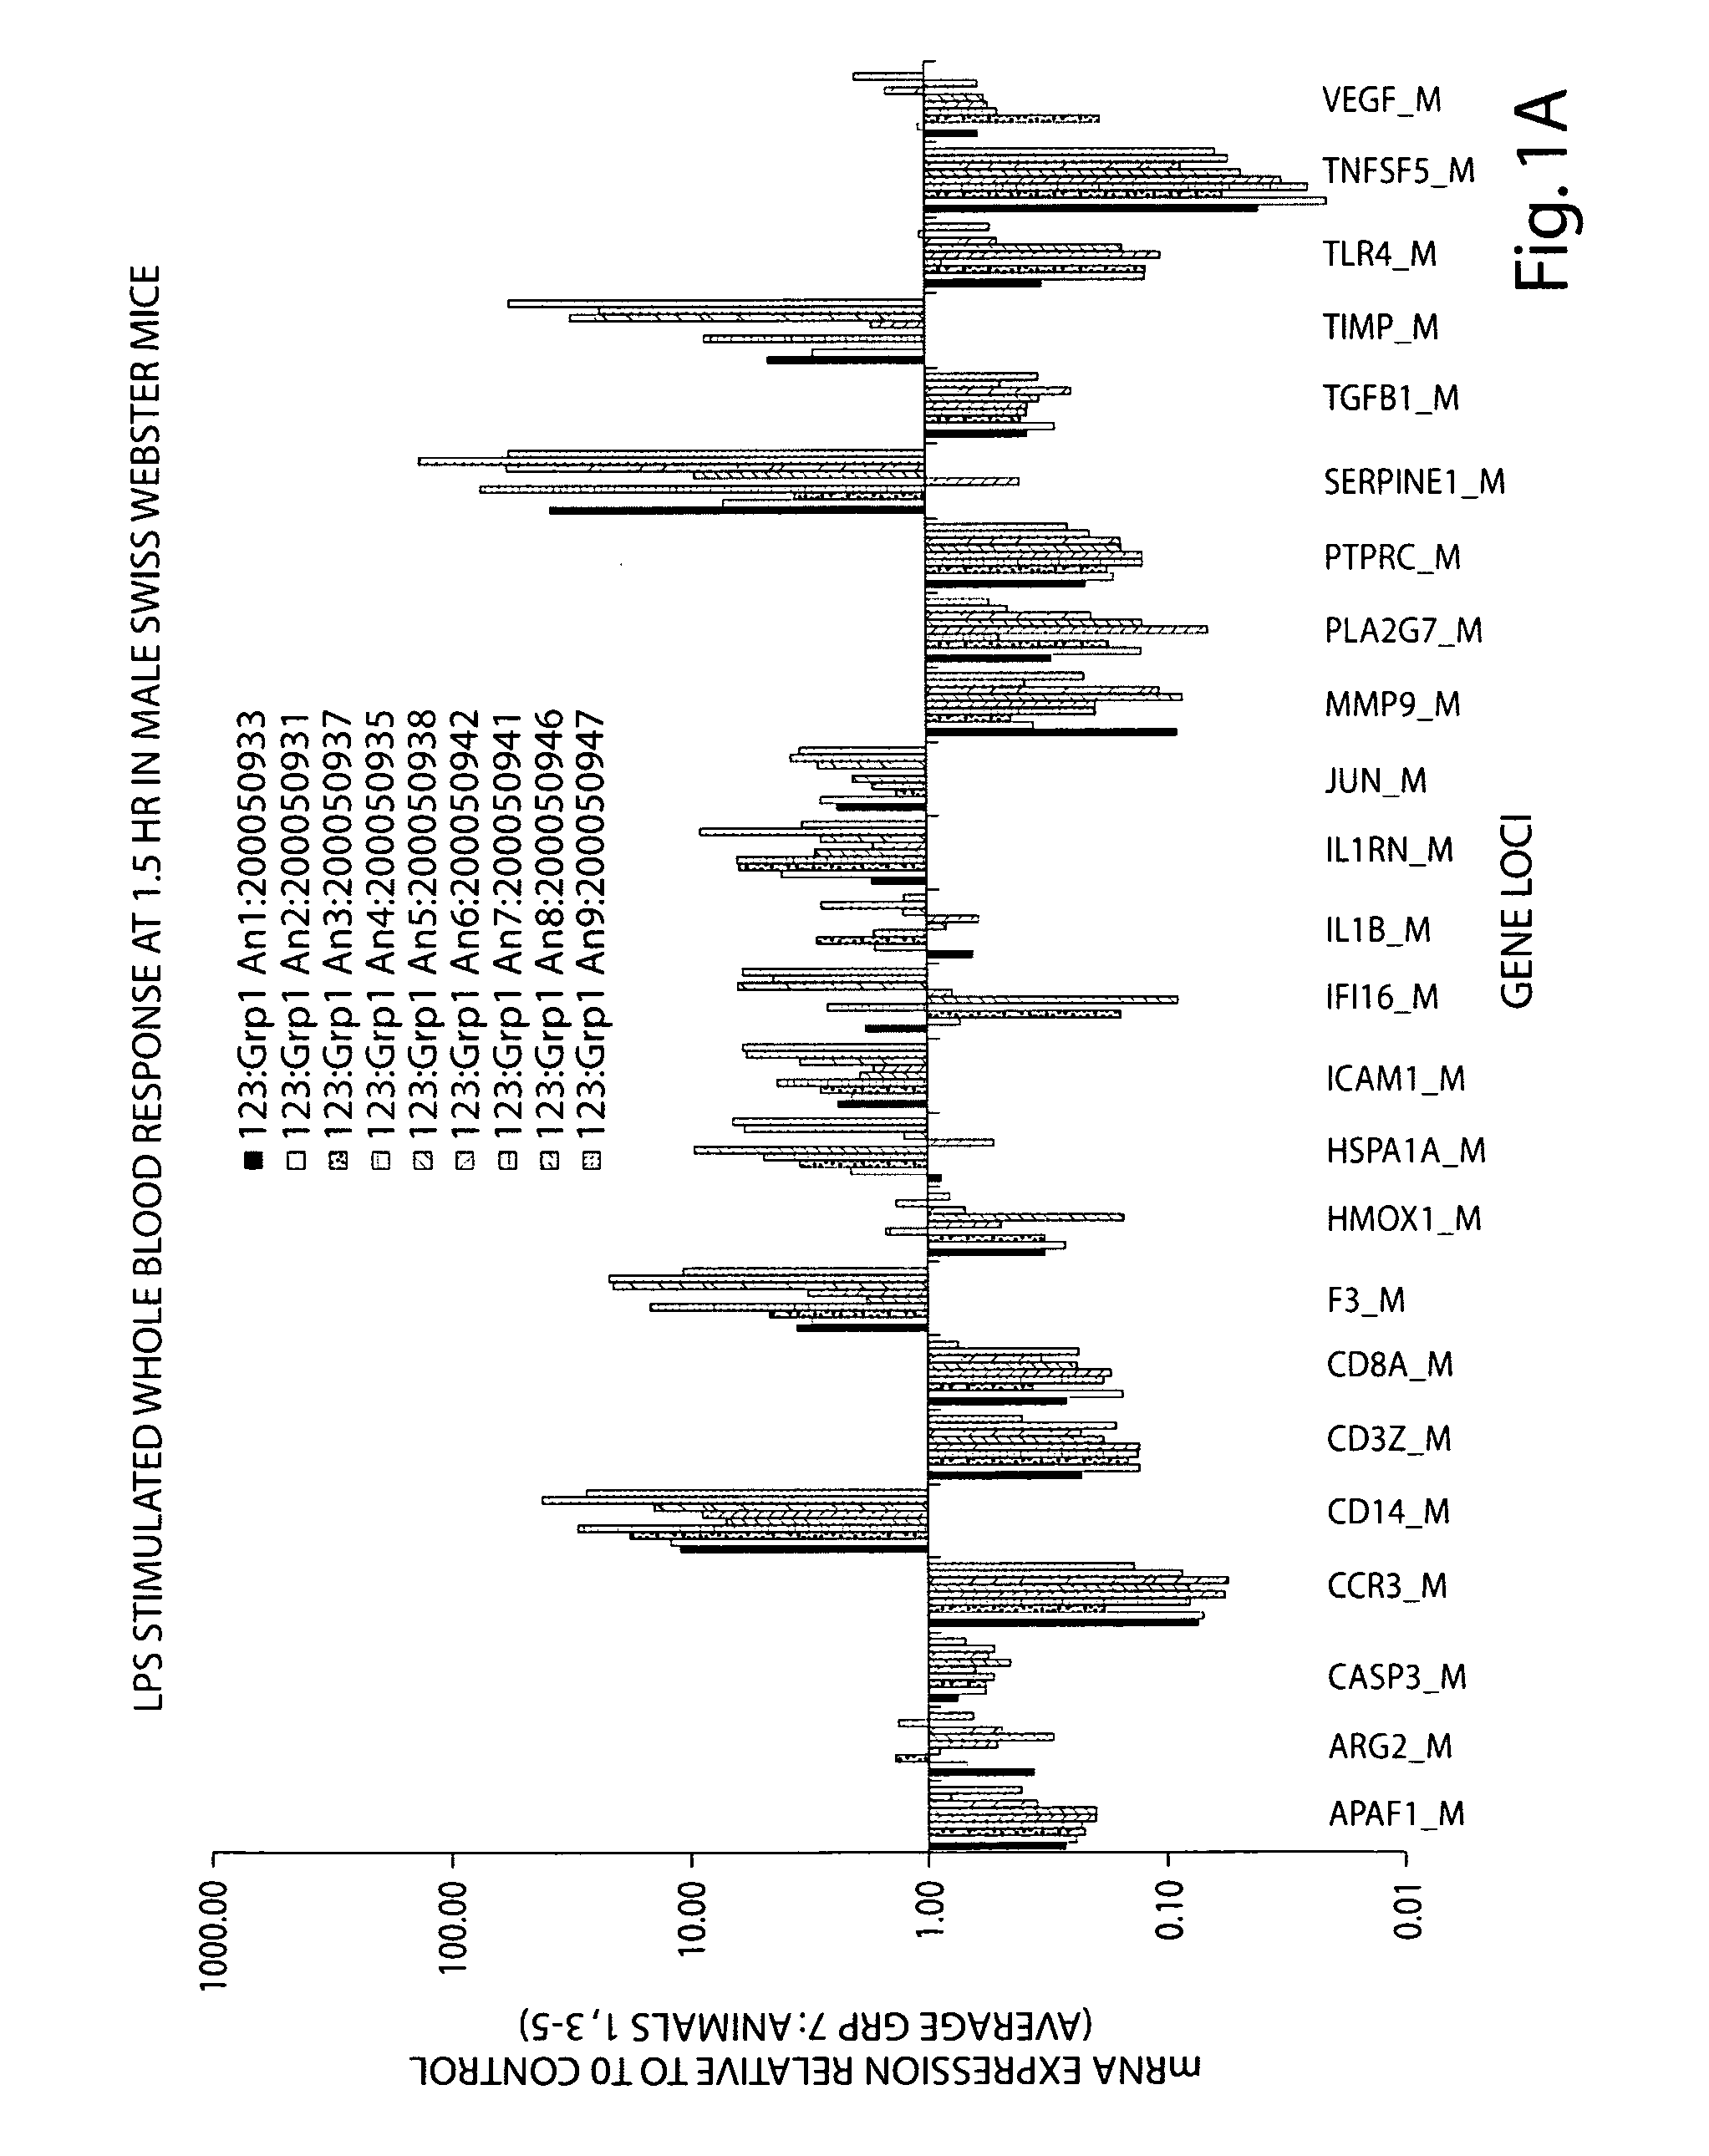
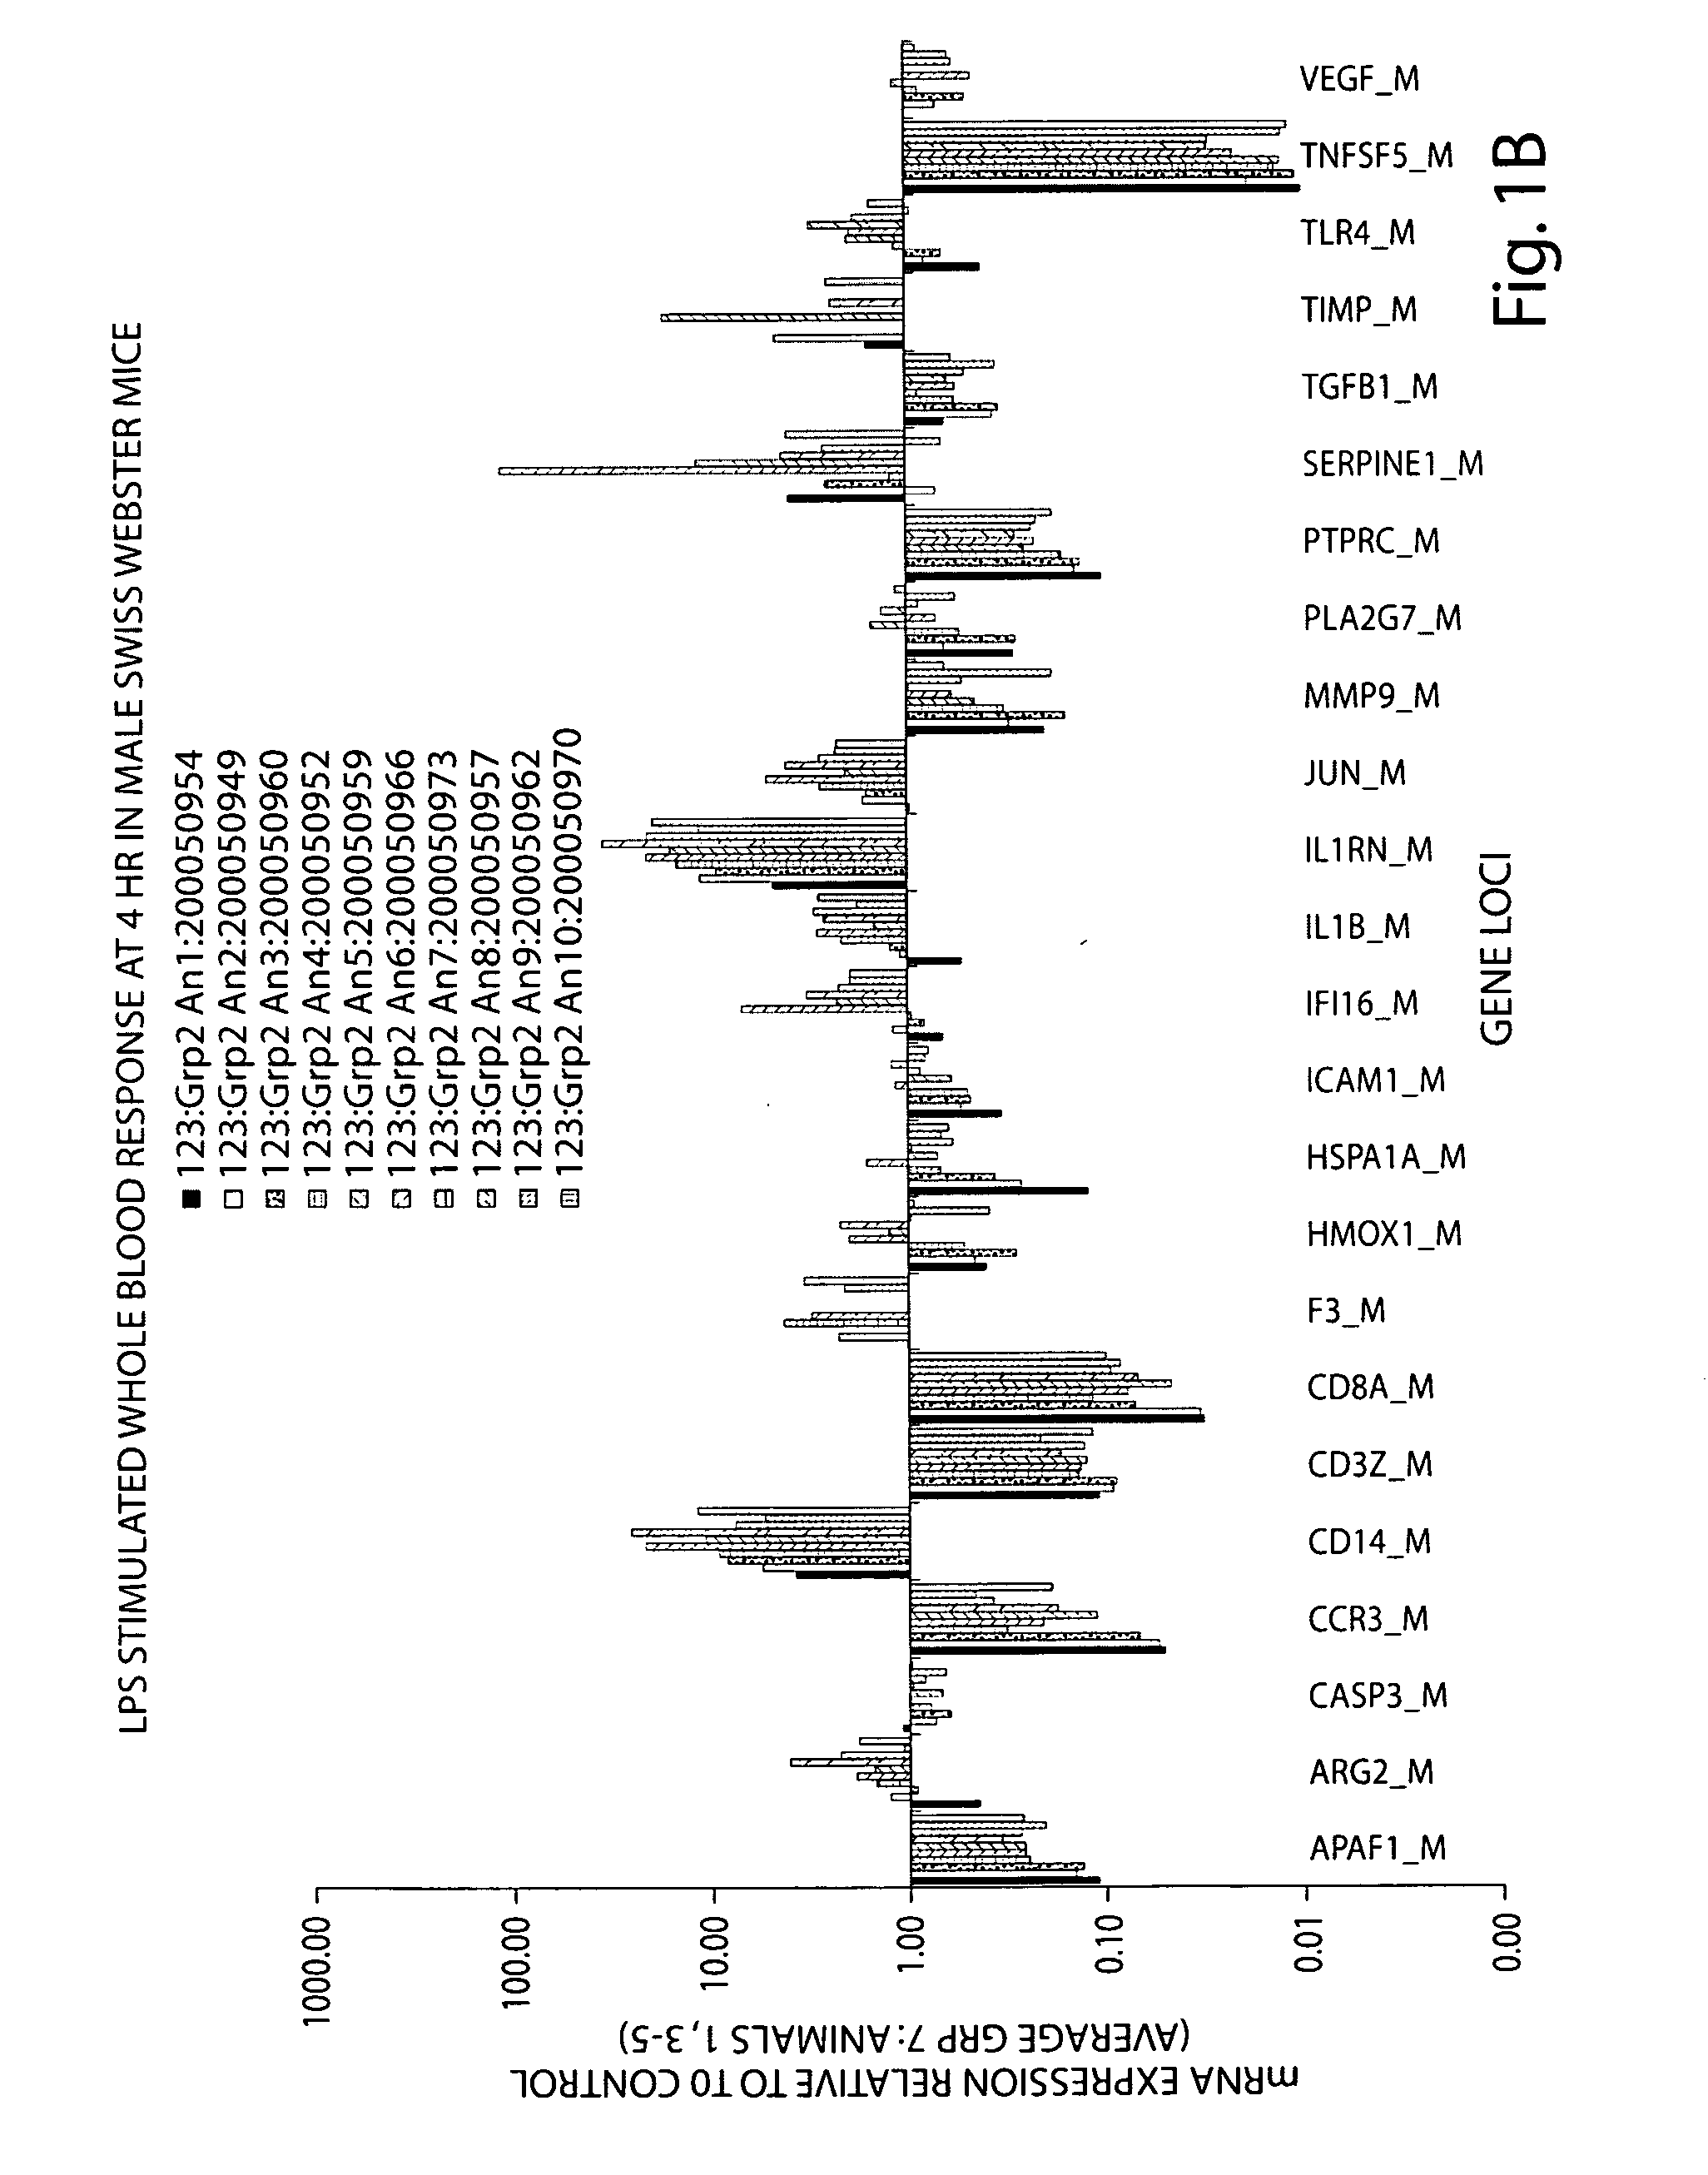
[0237]The gene expression response in whole blood from human (N=3) and murine (N=9-10) subjects exposed to a single dose of bacterial endotoxin (lipopolysaccharide, LPS) is presented in Table 16 and FIGS. 5A-5C. Whole blood samples were collected at three time points post LPS dosing for all subjects. A comparison of the human and murine response relative to that of the untreated baseline control is collectively shown in FIGS. 5A-5C.

[0238]The relative gene expression response of human and murine whole blood at 2 and 1.5 hours post LPS is shown in FIG. 5A for 17 genes. The pattern of response for 9 of the 17 genes, specifically, CD3Z, CD8A, HMOX1, HSPA1A, ICAM1, IL1RN, PLA2G7 SERPINE1 and TNFSF5, is very similar between human and murine subjects, though the magnitude of response for some of these genes is variable. Two genes, MMP9 and TGBF1 show a divergent response at these time-points. The remaining genes diff...

example 3

Gene Expression in Human Whole Blood Stimulated with LPS In Vivo and In Vitro

[0241]The gene expression response in whole blood from human subjects (N=3) exposed to a single dose of bacterial endotoxin (lipopolysaccharide, LPS) in vivo and human whole blood treated with LPS in vitro N=1), is presented in Table 17 and FIGS. 6A-6C. Whole blood samples were collected at three time points post LPS dosing for all subjects. A comparison of the in vivo and in vitro response relative to that of the untreated baseline control is collectively shown in FIGS. 6A-6C.

[0242]At the 2 hour time-point, 21 of 38 genes show a strikingly similar pattern of expression for both in vivo and in vitro samples (FIG. 6A) for 31 the 31 genes examined. For most genes, the magnitude of expression of the in vitro sample is greater than that observed in vivo. A few differences in expression can also be noted, specifically, the genes CSF3, F3 and IL10 are induced in vitro and remain unchanged in vivo.

[0243]The magnit...


PUM

PropertyMeasurementUnit
Fractionaaaaaaaaaa
Fractionaaaaaaaaaa
Fractionaaaaaaaaaa

Abstract

Rodent gene expression data, in particular, gene expression profiles, are created and used to predict the efficacy of therapeutic agents on human biological conditions. Gene Profile data sets are derived from rodent subject samples and include quantitative, substantially repeatable measures of a distinct amount of RNA or protein constituent(s) in a signature panel selected such that measurement of the constituent(s) enables measurement of a biological condition of interest in both human and rodent subjects. Such profile data sets may be used to predict the therapeutic efficacy of a therapeutic agent in humans.

Description

REFERENCE TO RELATED APPLICATIONS[0001]This application claims the benefit of U.S. Provisional Application No. 60 / 800,802, filed May 16, 2006, the contents of which are incorporated by reference in its entirety.FIELD OF THE INVENTION[0002]The present invention relates to use of gene expression data, and in particular to use of gene expression data in assessing the effect of an agent on a human biological condition using rodent Gene Expression Panels.BACKGROUND OF THE INVENTION[0003]The prior art has utilized gene expression data to determine the presence or absence of particular markers as diagnostic of a particular condition, and in some circumstances have described the cumulative addition of scores for over-expression of particular disease markers to achieve increased accuracy or sensitivity of diagnosis. Information on any condition of a particular patient and a patient's response to different types and dosages of therapeutic or nutritional agents has become an important issue in...

Claims


Application Information

Patent Timeline
IPC IPC(8): C40B30/06C40B40/08
CPCC12Q1/6809C12Q1/6883C12Q2600/136C12Q2600/158
Inventor BEVILACQUA, MICHAELTRYON, VICTORCHERONIS, JOHNBANKAITIS-DAVIS, DANUTESTORM, KATHLEENWASSMANN, KARL
Owner BEVILACQUA MICHAEL
Learn More