Computer implemented method and system for computing and evaluating demand information

a technology of demand information and computer implemented methods, applied in the field of computer implemented methods and systems for computing and evaluating demand information, can solve problems such as downward bias in demand forecasts, and achieve the effect of accurate performance evaluation and improved forecasting

Inactive Publication Date: 2008-10-09
ORACLE TECH CO
View PDF19 Cites 16 Cited by
  • Summary
  • Abstract
  • Description
  • Claims
  • Application Information

AI Technical Summary

Benefits of technology

[0030]The present invention employs hidden demand not only to improve the accuracy of demand forecasting for perishable consumer items but also to generate important new performance metrics for more accurately evaluating the efficacy of a draw for a perishable consumer item at an outlet including inter alia estimated stockout over an evaluation period, ratio of estimated stockout to draw, and the like. Moreover, the present invention employs hidden demand for more accurately comparing a recommended draw for a perishable consumer item at an outlet to an actual draw since draw bounded sales data as opposed to adjusted non draw bounded sales data compensating for hidden demand at occurrences of sellouts inherently prejudices against a recommended draw as will now become clear by way of the example below. In point of fact, there are five mutually exclusive and exhaustive cases which may possibly arise depending on the values of a recommended draw, an actual draw and sales at each time point which each impact various performance metrics differently as summarized in the table of FIG. 7.
[0032]To summarize, the present invention facilitates improved forecasting at both at bottom level nodes and at higher level nodes, for example, say, at the level of a regional distributor. Moreover, the present invention provides for new more accurate performance evaluation techniques together with new performance metrics for evaluating an actual draw and for comparing a recommended draw to an actual draw.

Problems solved by technology

It has been long recognized that occurrences of sellouts downwardly bias demand forecasts due to actual sales data reflecting stock availability levels as opposed to true demand.

Method used


Image

  • Computer implemented method and system for computing and evaluating demand information
  • Computer implemented method and system for computing and evaluating demand information
  • Computer implemented method and system for computing and evaluating demand information

Examples


Embodiment Construction

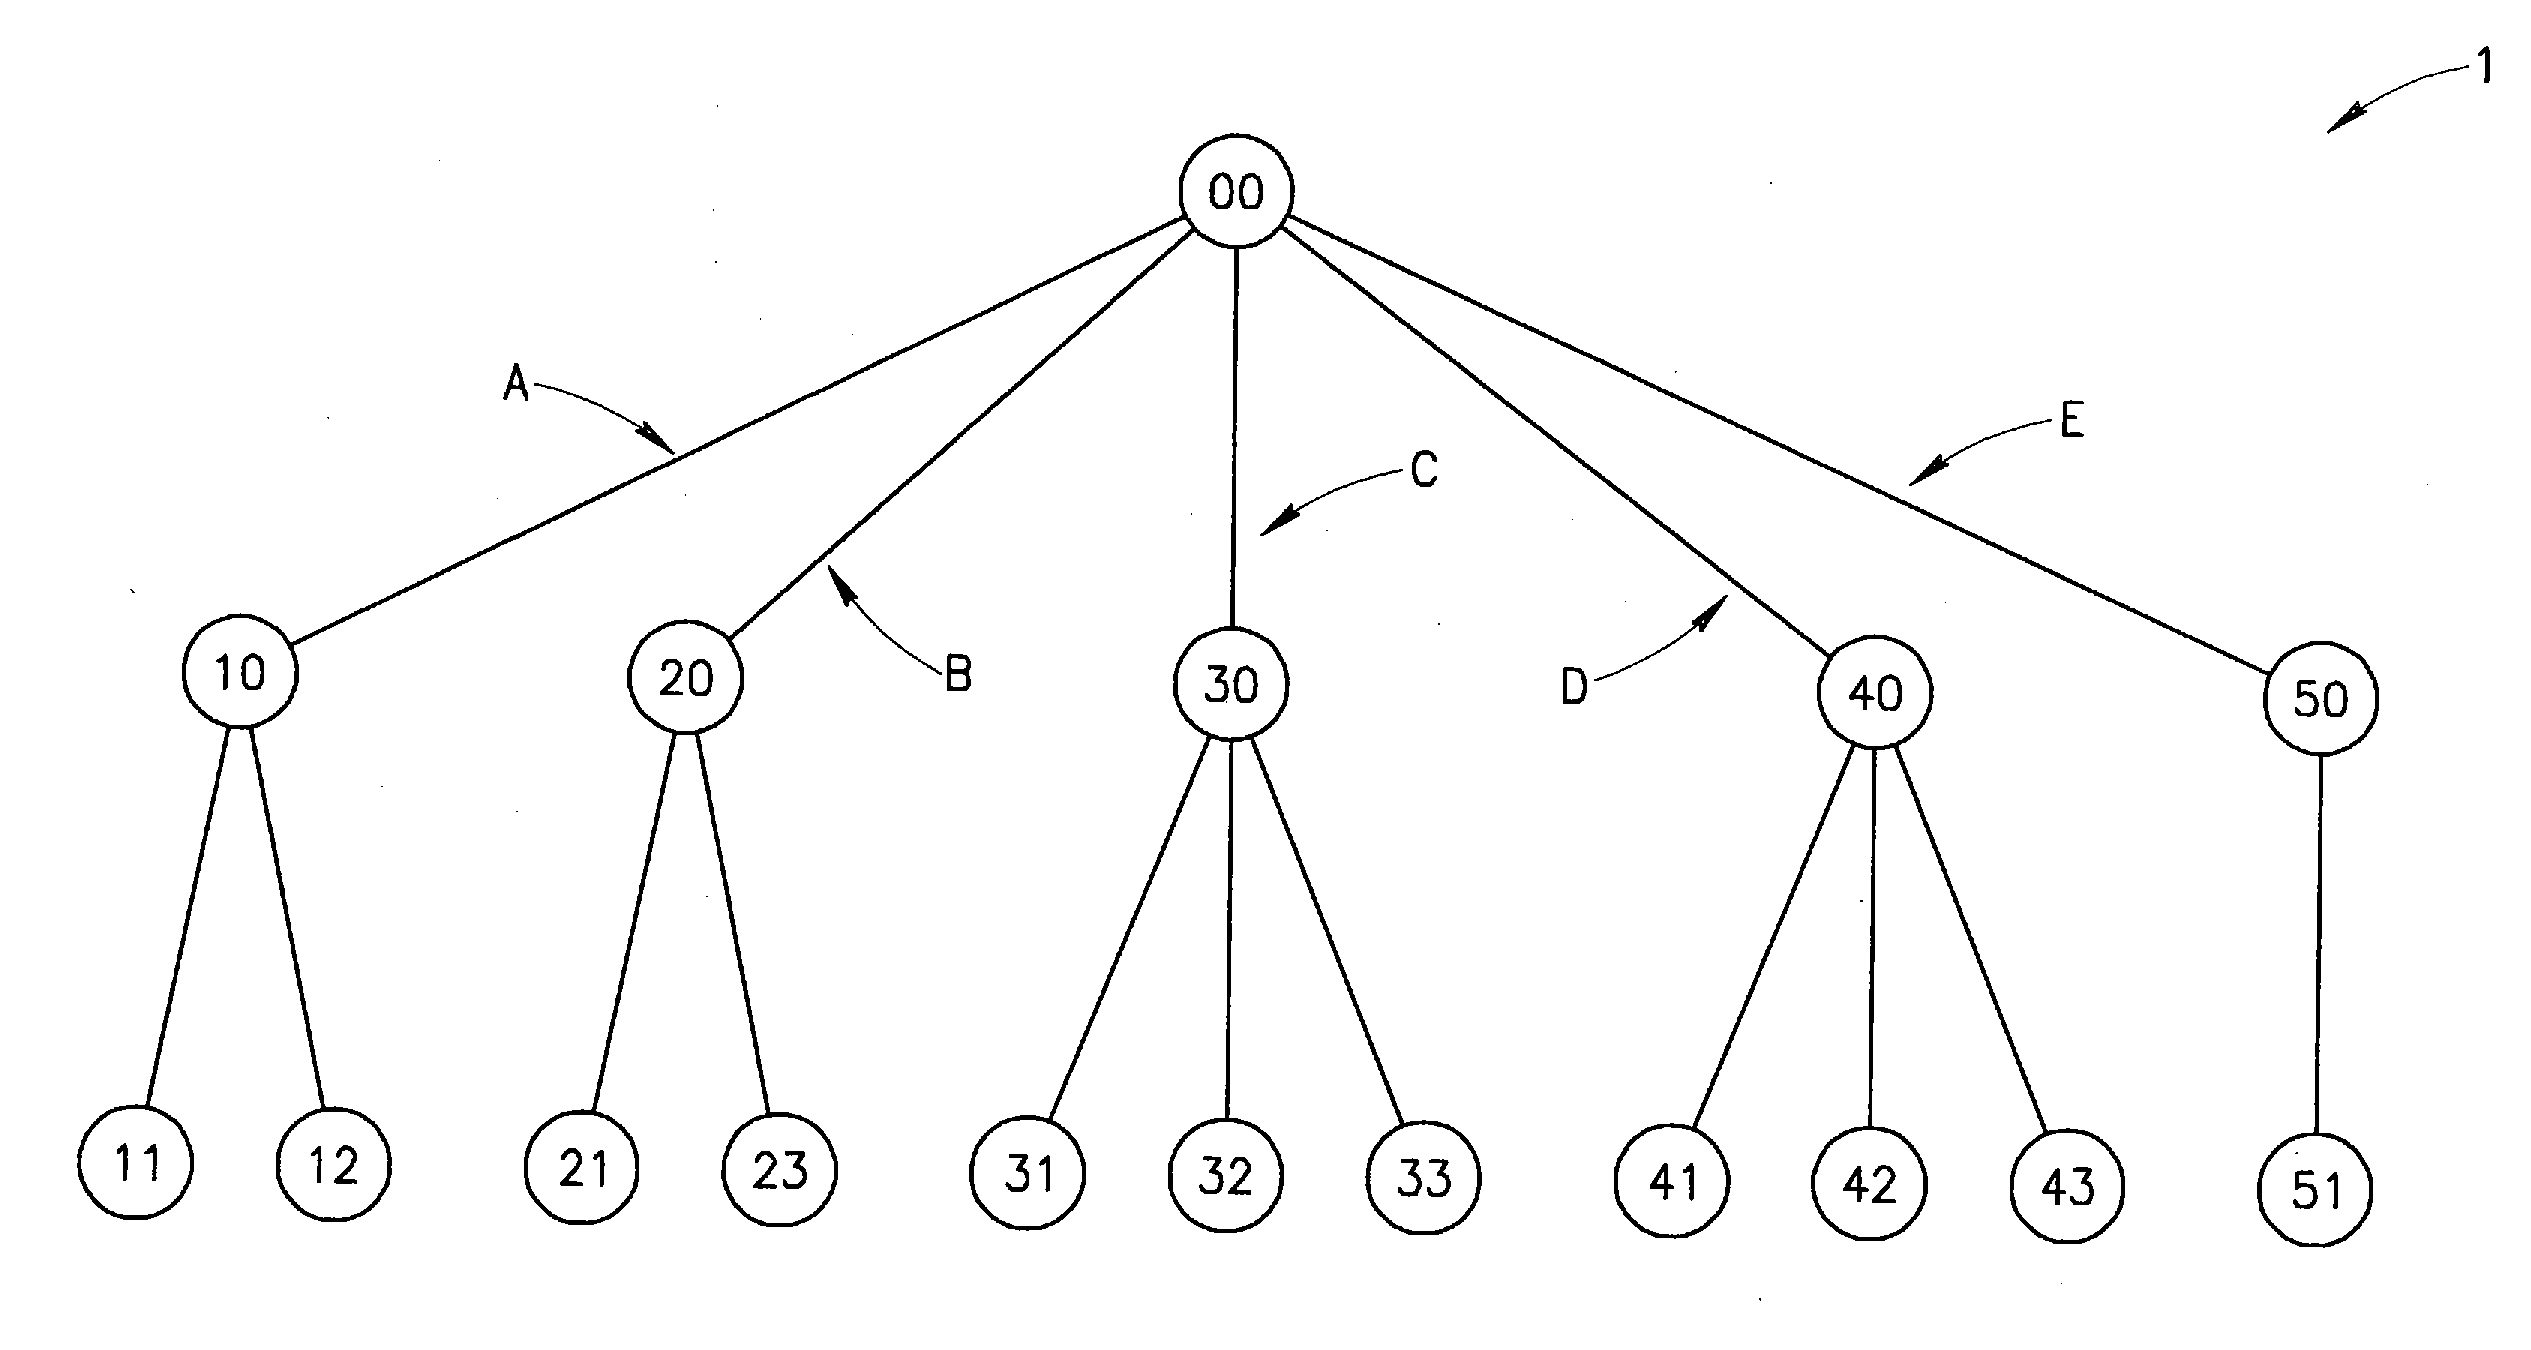
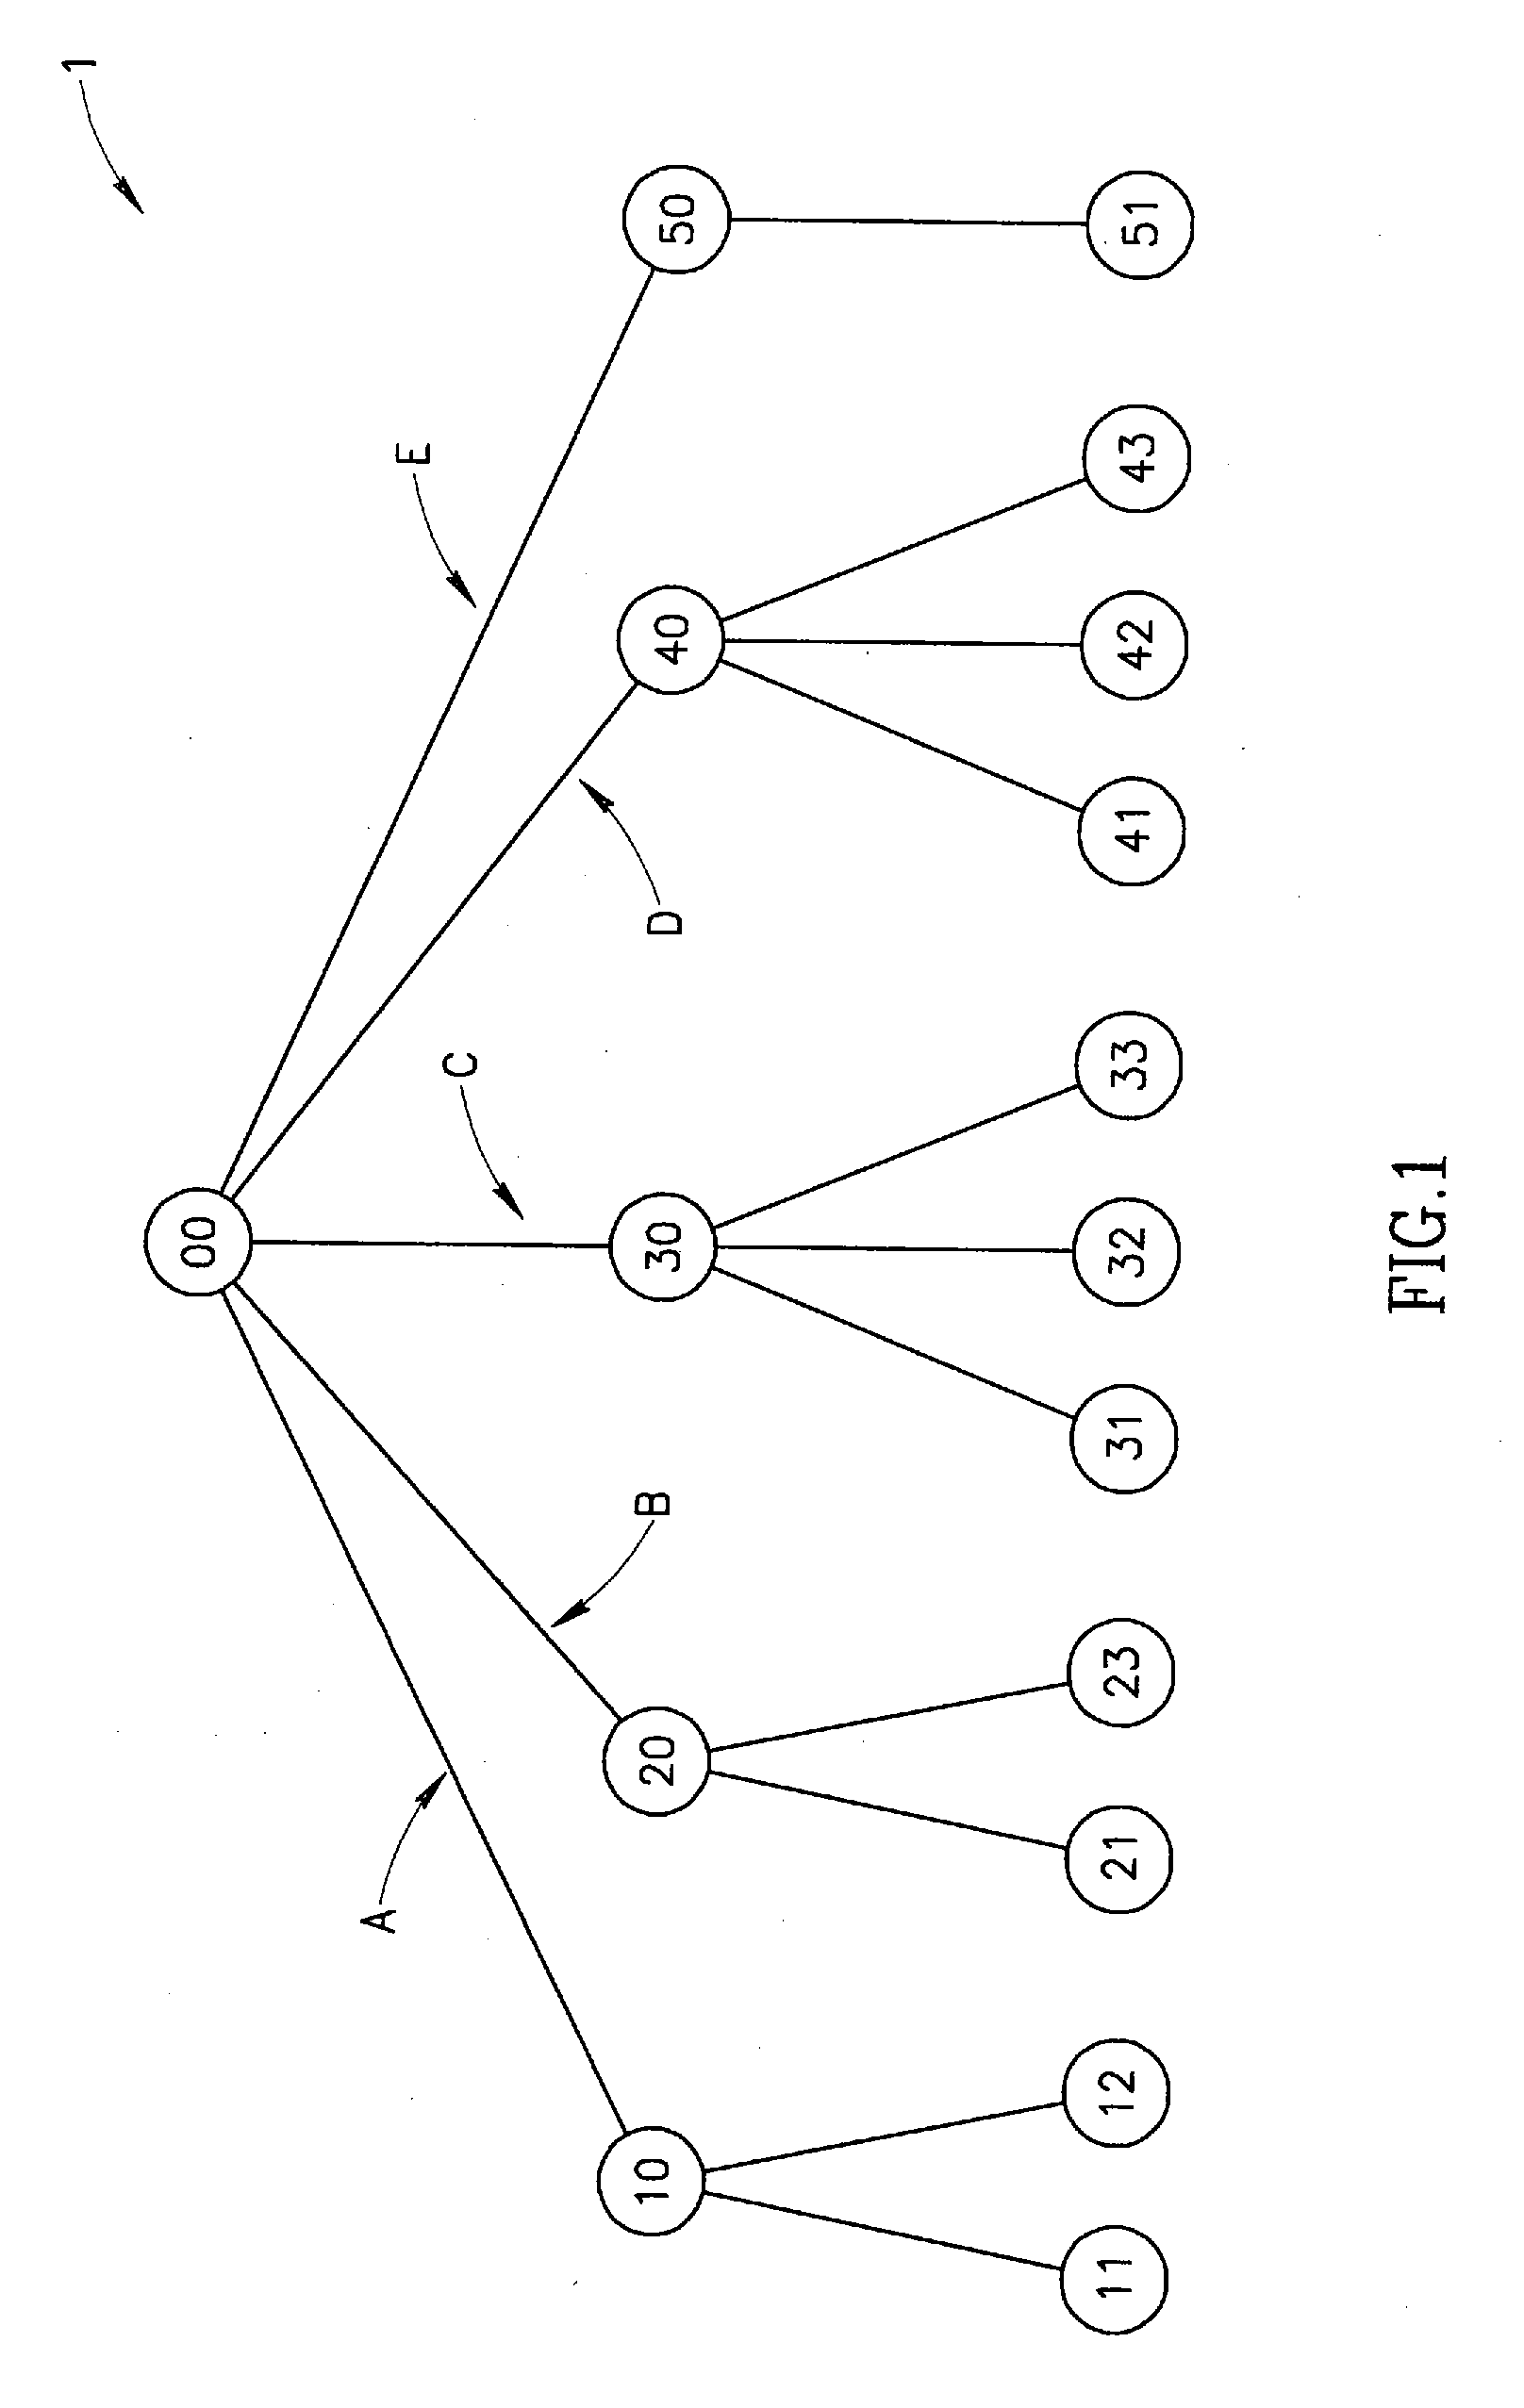
[0043]FIG. 1 shows a demand forecast tree 1 having a single top level node (00) with five branches A, B, C, D and E for correspondingly representing the sale of Item I (top level-1 node (10)) at Locations 1 and 2 (bottom level nodes (11) and (21)), Item II (top level-1 node (20)) at Locations 1 and 3 (bottom level nodes (21) and (23)), Item III (top level-1 node (30)) at Location 1, 2 and 3 (bottom level nodes (31), (32) and (33)), Item IV (top level-1 node (40)) also at Locations 1, 2 and 3 (bottom level nodes (41), (42) and (43)); and Item V (top level-1 node (50)) at Location 1 (bottom level node (51)) only. FIG. 2 shows an exemplary table 2 containing historical sales data of Item I at the bottom level nodes (11) and (12). Similar tables exist for the sale of the other items at their respective outlets.

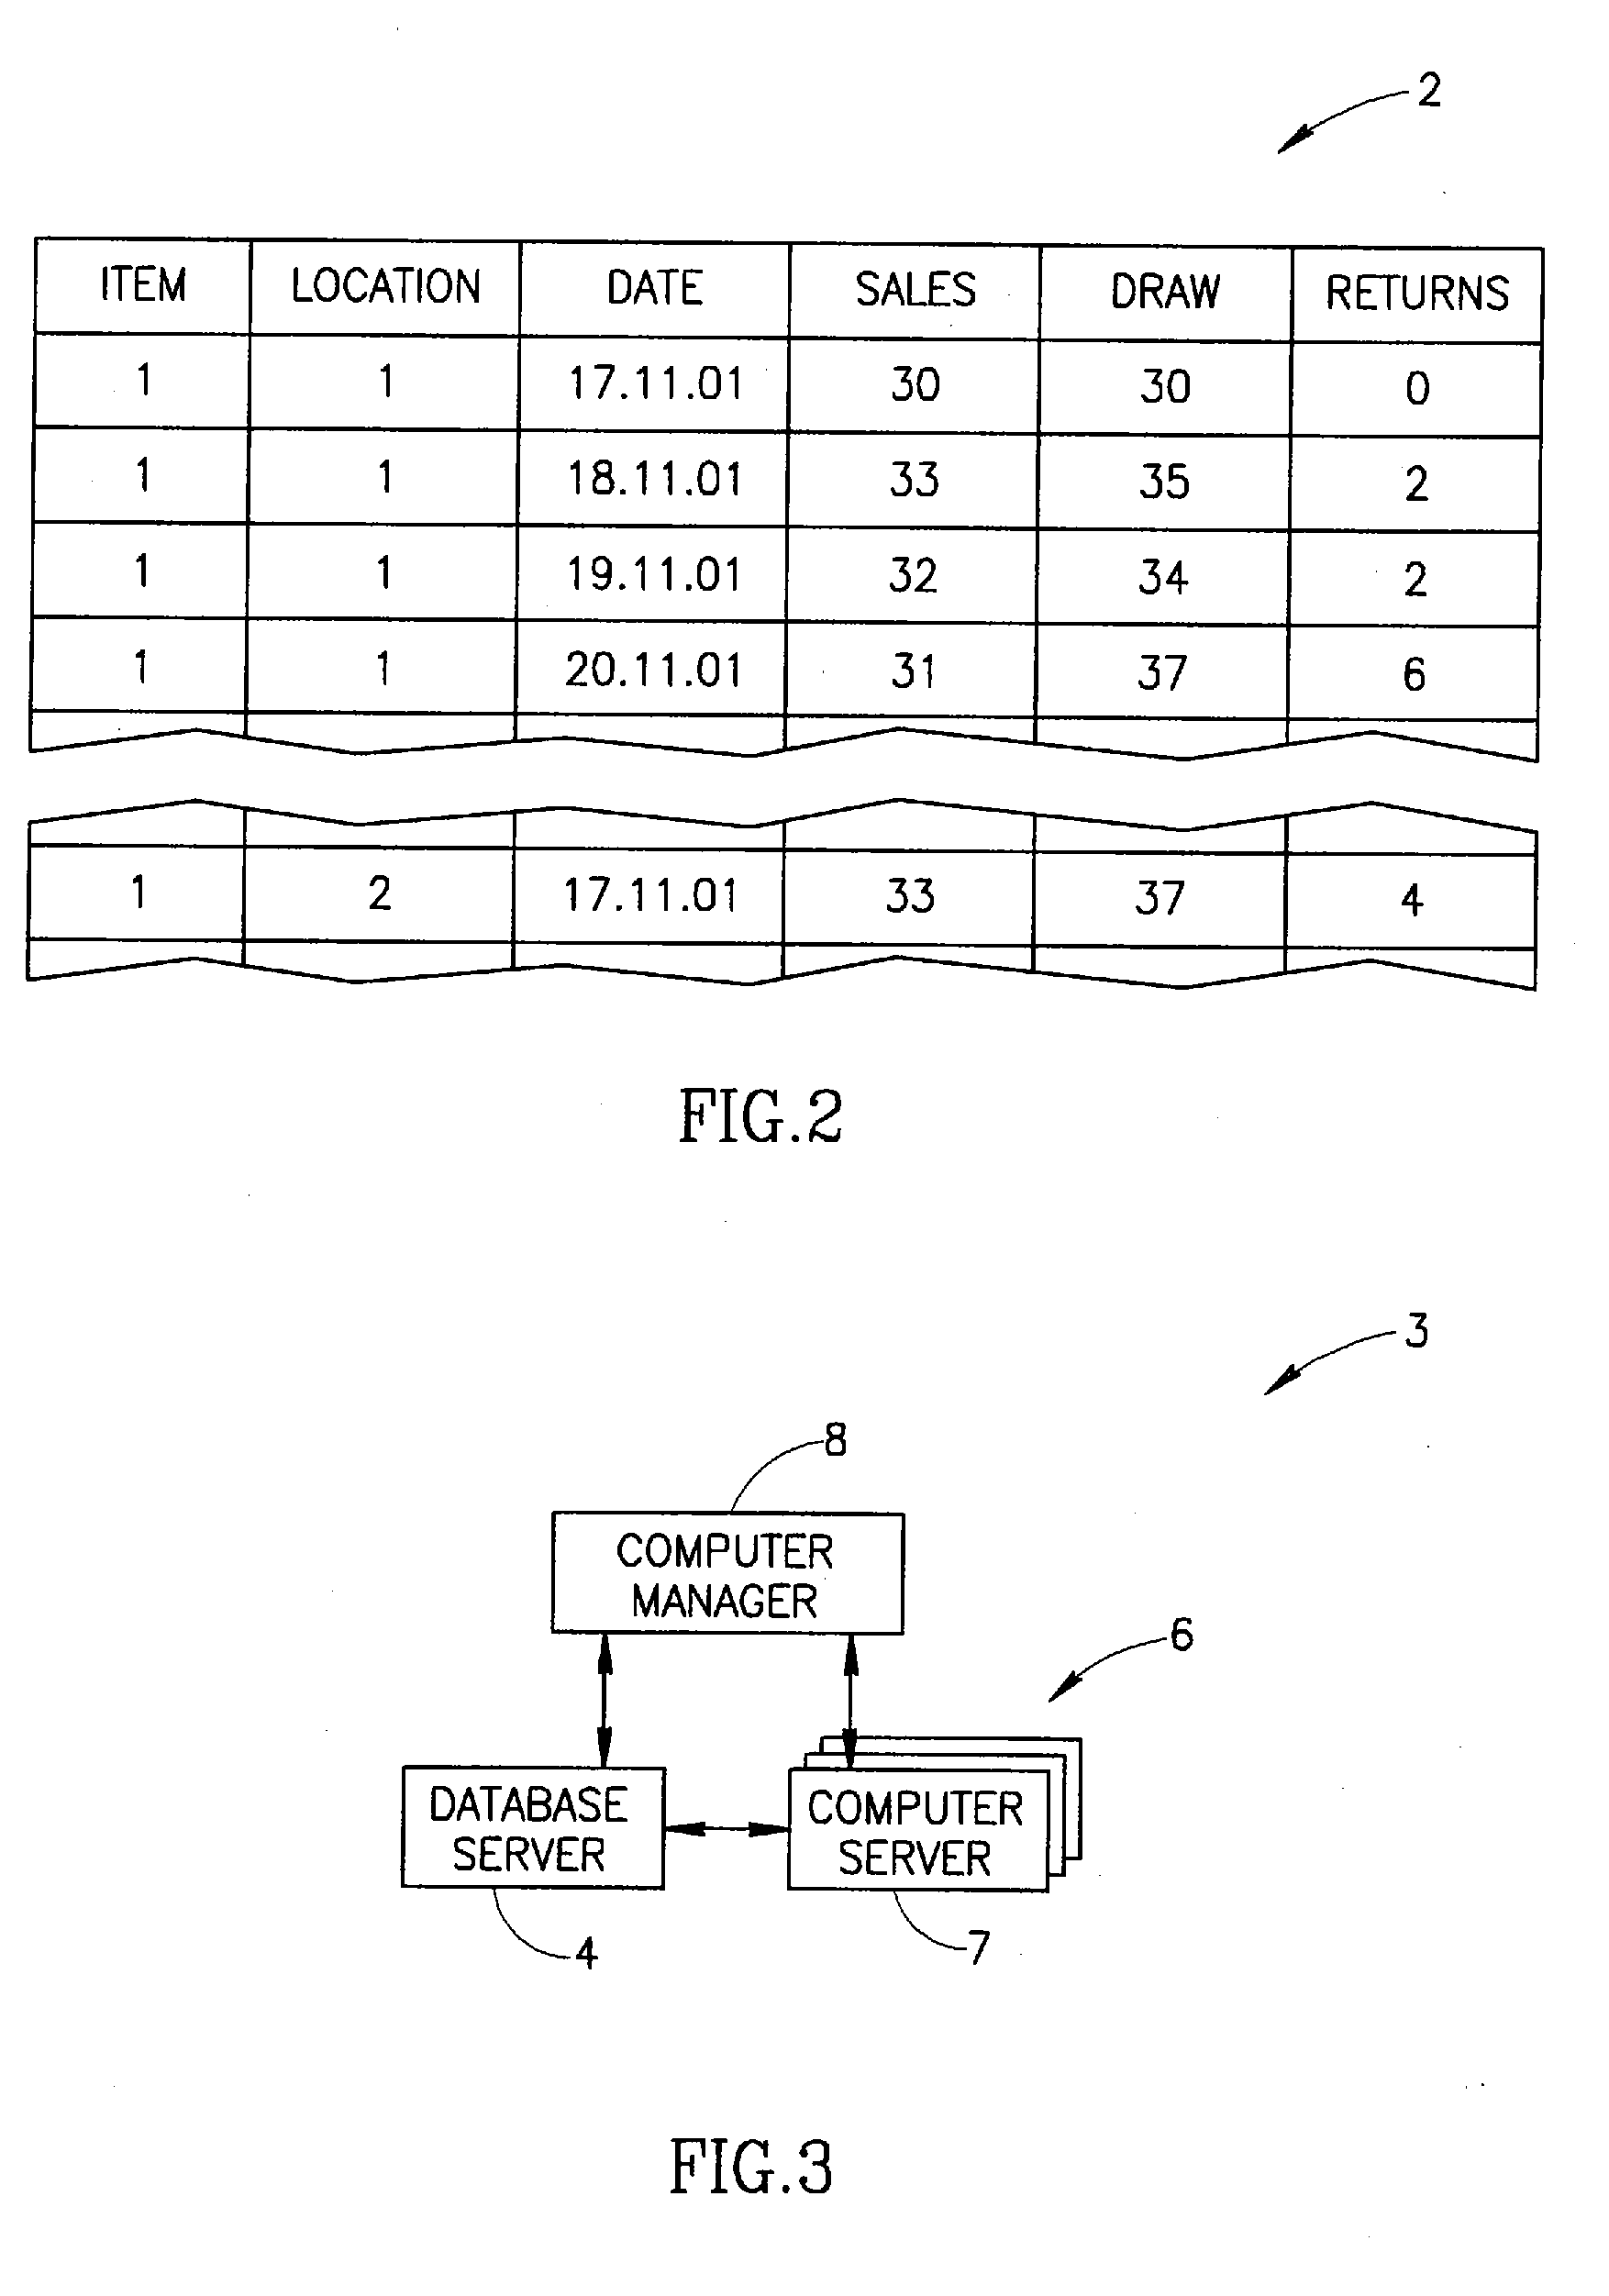
[0044]FIG. 3 shows a computer implemented system 3 as illustrated and described in commonly assigned co-pending U.S. patent application Ser. No. 10 / 058,830 entitled “Computer Impl...


PUM


Abstract

Computer implemented method and system for improving demand forecasting by estimating the hidden demand at an occurrence of a sellout using a single parameter probability distribution with a parameter assuming a forecasted mean demand value derived from a statistical seasonal causal time series forecasting model of count data on a new data set of sales values excluding truncated sales values at occurrences of sellouts. The present invention also provides for new more accurate performance evaluation techniques together with new performance metrics for evaluating an actual draw and for comparing a recommended draw to an actual draw.

Description

CROSS-REFERENCES TO RELATED APPLICATIONS[0001]This application is a continuation of and claims priority from U.S. patent application Ser. No. 10 / 098,615, filed Mar. 18, 2002 (Atty Docket # 021756-038600US), which is incorporated by reference.FIELD OF THE INVENTION[0002]The invention is in the field of computer implemented methods and systems for computing and evaluating demand information in general, and demand information for perishable consumer items based on sales data including sellouts in peculiar.GLOSSARY OF TERMS[0003]The following terms listed alphabetically together with their acronyms are employed in the description and claims of the present invention:Adjusted Sales Data[0004]Sales data with expected full demand (EFD) values replacing truncated sales values (S) at occurrences of sellouts.Availability[0005]The probability of fully satisfying the demand for a consumer item at an outlet under a given draw or, in other words, satisfying demand for the consumer item at the outl...

Claims


Application Information

Patent Timeline
Patent Type & Authority Applications(United States)
IPC IPC(8): G06F17/30G06Q10/06G06Q10/08G06Q30/02
CPCG06Q10/06315G06Q10/0637G06Q10/087G06Q30/0202
Inventor ARONOWICH, MICHAELMARIAMOVA, SOFIANATAN, OFRAHAREL, HENRY
Owner ORACLE TECH CO
Why Eureka
Try Eureka