System and Method for Distortion Analysis

Active Publication Date: 2009-01-15
LTX CORP
View PDF8 Cites 3 Cited by
  • Summary
  • Abstract
  • Description
  • Claims
  • Application Information

AI Technical Summary

Benefits of technology

[0019]The details of one or more implementations are set forth in the accompanying drawings and the descriptio

Problems solved by technology

Unfortunately, using a phase-locked loop to search for the fundamental frequency of the output signal may require a great deal of time.
Furthermore, the constraints on the distortion of the phase-locked loop generated signal may be very aggressive when the output signal being examined has low distortion.
The residual noise and distortion of the spectrum analyzer may be too great for analyzing a low distortion output signal.
Additionally, measuring the individual frequency components of an output signal using a spectrum analyzer may be a slow process.

Method used


Image

  • System and Method for Distortion Analysis
  • System and Method for Distortion Analysis
  • System and Method for Distortion Analysis

Examples


Embodiment Construction

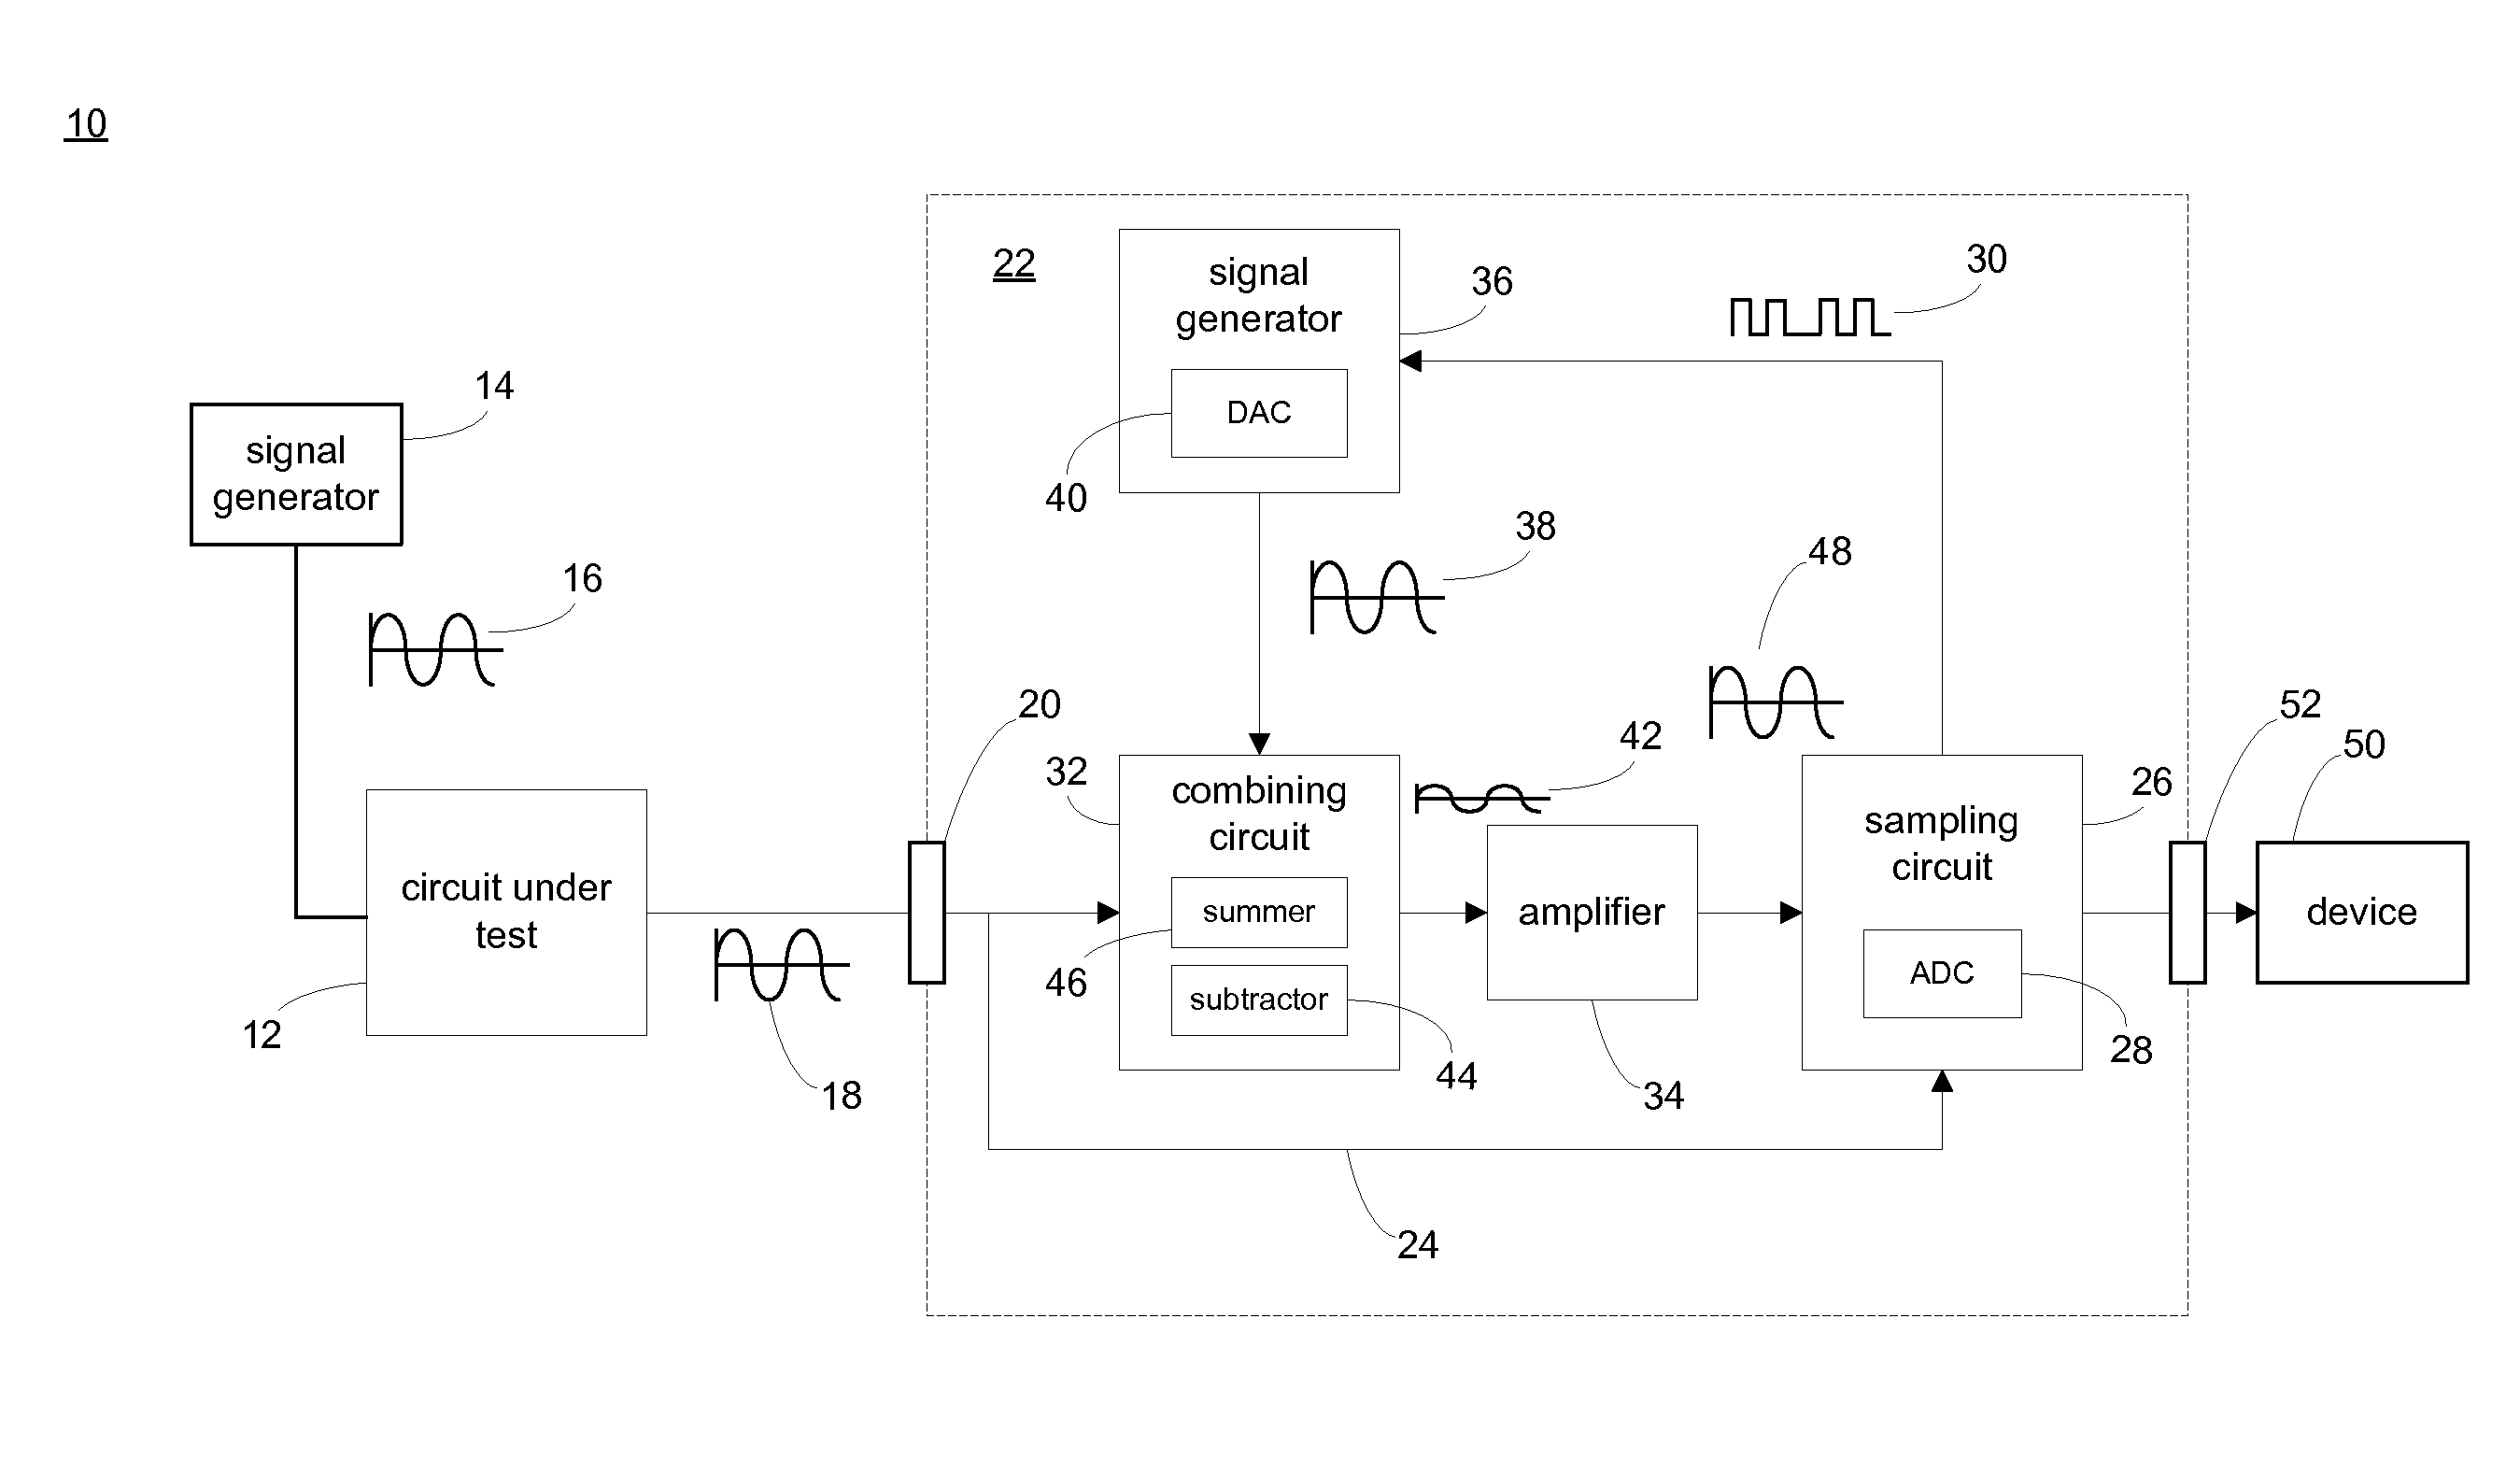
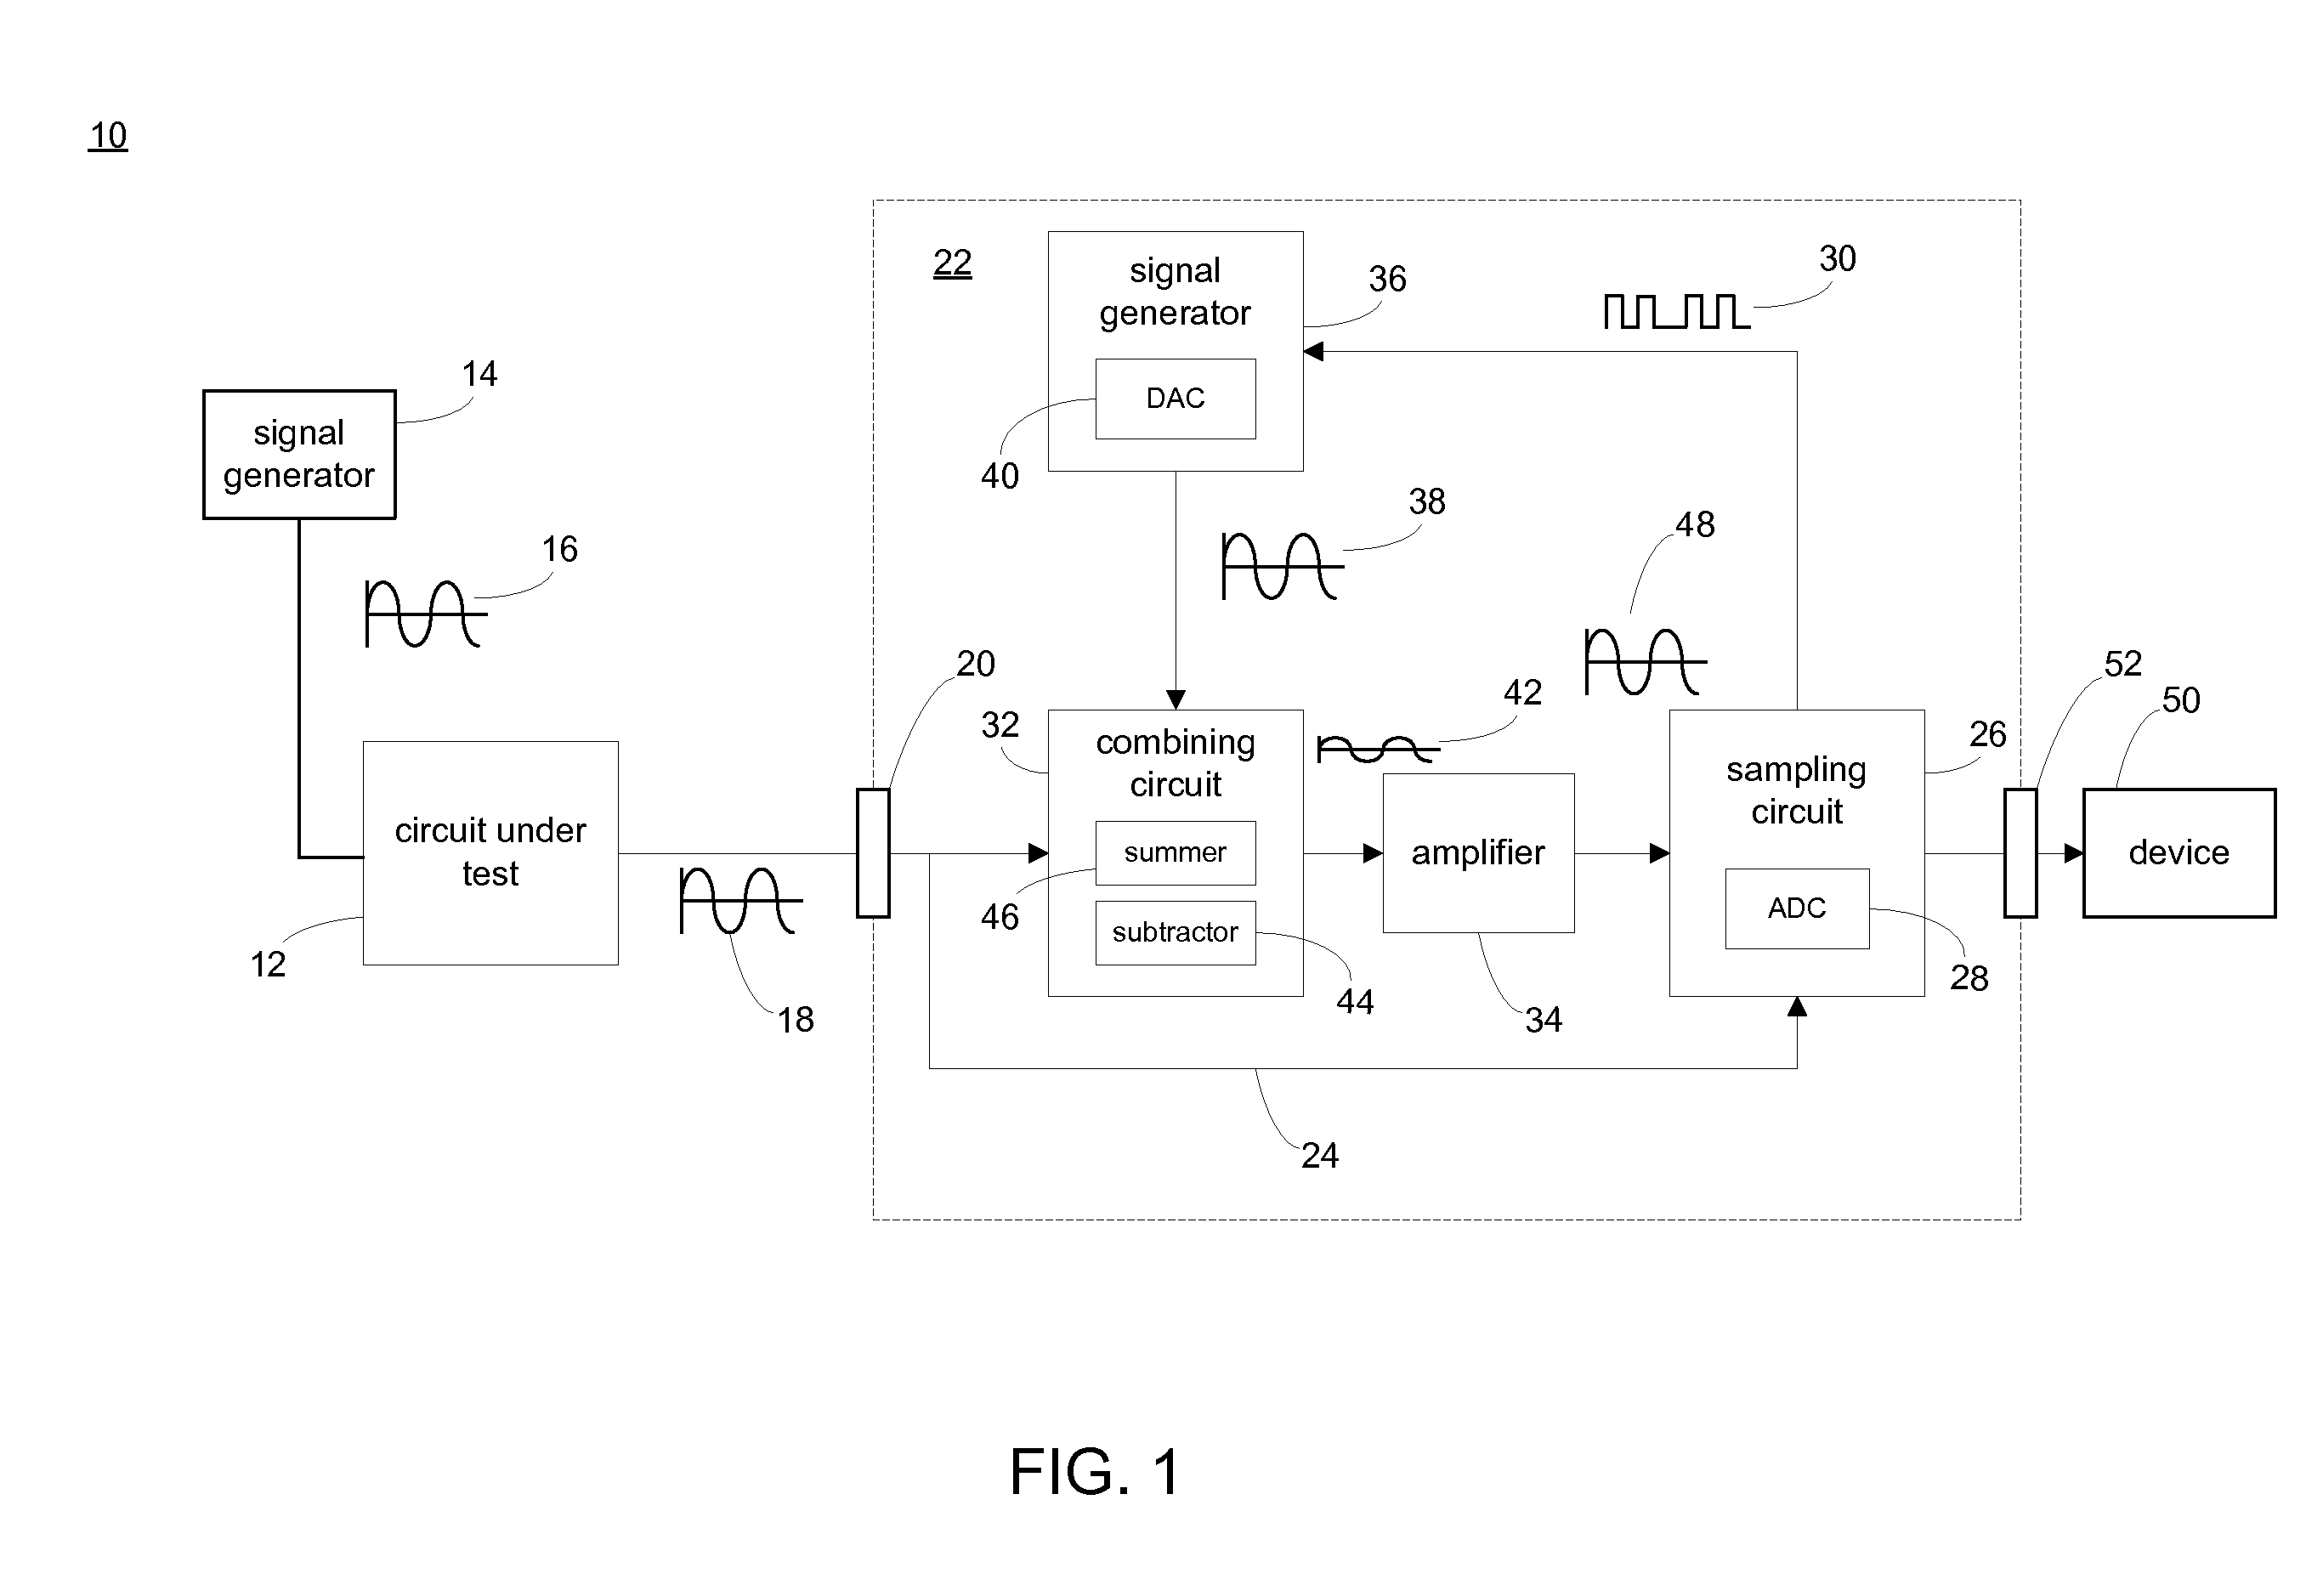
[0024]Referring to FIG. 1, there is shown an automatic test system 10 for measuring the distortion imparted by circuit under test 12. Signal generator 14 may apply test signal 16 to circuit under test 12, and the resulting output signal (i.e., signal under test 18) generated by circuit under test 12 may be provided to input port / terminal 20 of automatic test system 10. Since test signal 16 is typically a distortion-free signal, the distortion imparted by circuit under test 12 may be determined by comparing test signal 16 and signal under test 18.

[0025]As discussed above, circuit under test 12 may be driven by test signal 16. Examples of test signal 16 may include, but are not limited to, an 8 VACpeak-to-peak 1 kHz sinusoidal signal. The amplitude, frequency, and type of test signal (e.g., test signal 16) applied to circuit under test 12 may vary depending on the type of circuit being tested (e.g., circuit under test 12). For example, for some circuit types, a square wave signal or t...


PUM


Abstract

A method, circuit and system for determining at least one of an amplitude and a relative phase of a signal under test. A reference signal is generated based, at least in part, upon the at least one of the amplitude and the relative phase of the signal under test. The reference signal is combined with the signal under test to generate a residual signal indicative of a distortion within the signal under test. The residual signal is measured.

Description

TECHNICAL FIELD[0001]This disclosure relates to analyzing distortion and noise in a test signal and, more particularly, to analyzing distortion and noise of a sinusoidal wave signal.BACKGROUND[0002]Three primary methods have conventionally been used for measuring the distortion imparted by a system under test or components of a system under test. The system under test is typically driven by a test signal and provides an output signal. According to one technique, the output signal may be passed through a notch filter, which may reject the fundamental frequency of the output signal. The harmonics and noise of the remaining residual signal may be measured. However, not only may the use of a notch filter remove parts of the noise in the output signal, but a separate notch filter must be constructed for every frequency that needs to be analyzed.[0003]A second technique uses a phase-locked loop to generate a signal at the fundamental frequency of the output signal. The noise in the output...

Claims


Application Information

Patent Timeline
IPC IPC(8): G01R23/20
CPCG01R23/20
Inventor MAX, SOLOMON
Owner LTX CORP
Why Eureka
Try Eureka