Eureka AIR delivers breakthrough ideas for toughest innovation challenges, trusted by R&D personnel around the world.

Threat Modeling and Risk Forecasting Model

a risk modeling and risk prediction technology, applied in the field of information security services, can solve problems such as loss, loss, and/or loss of shareholders, and achieve the effects of reducing the residual risk, reducing the effect of the threat on the transaction, and reducing the importance of the determined residual risk

Inactive Publication Date: 2009-01-29
BANK OF AMERICA CORP
View PDF6 Cites 53 Cited by
  • Summary
  • Abstract
  • Description
  • Claims
  • Application Information

AI Technical Summary

Benefits of technology

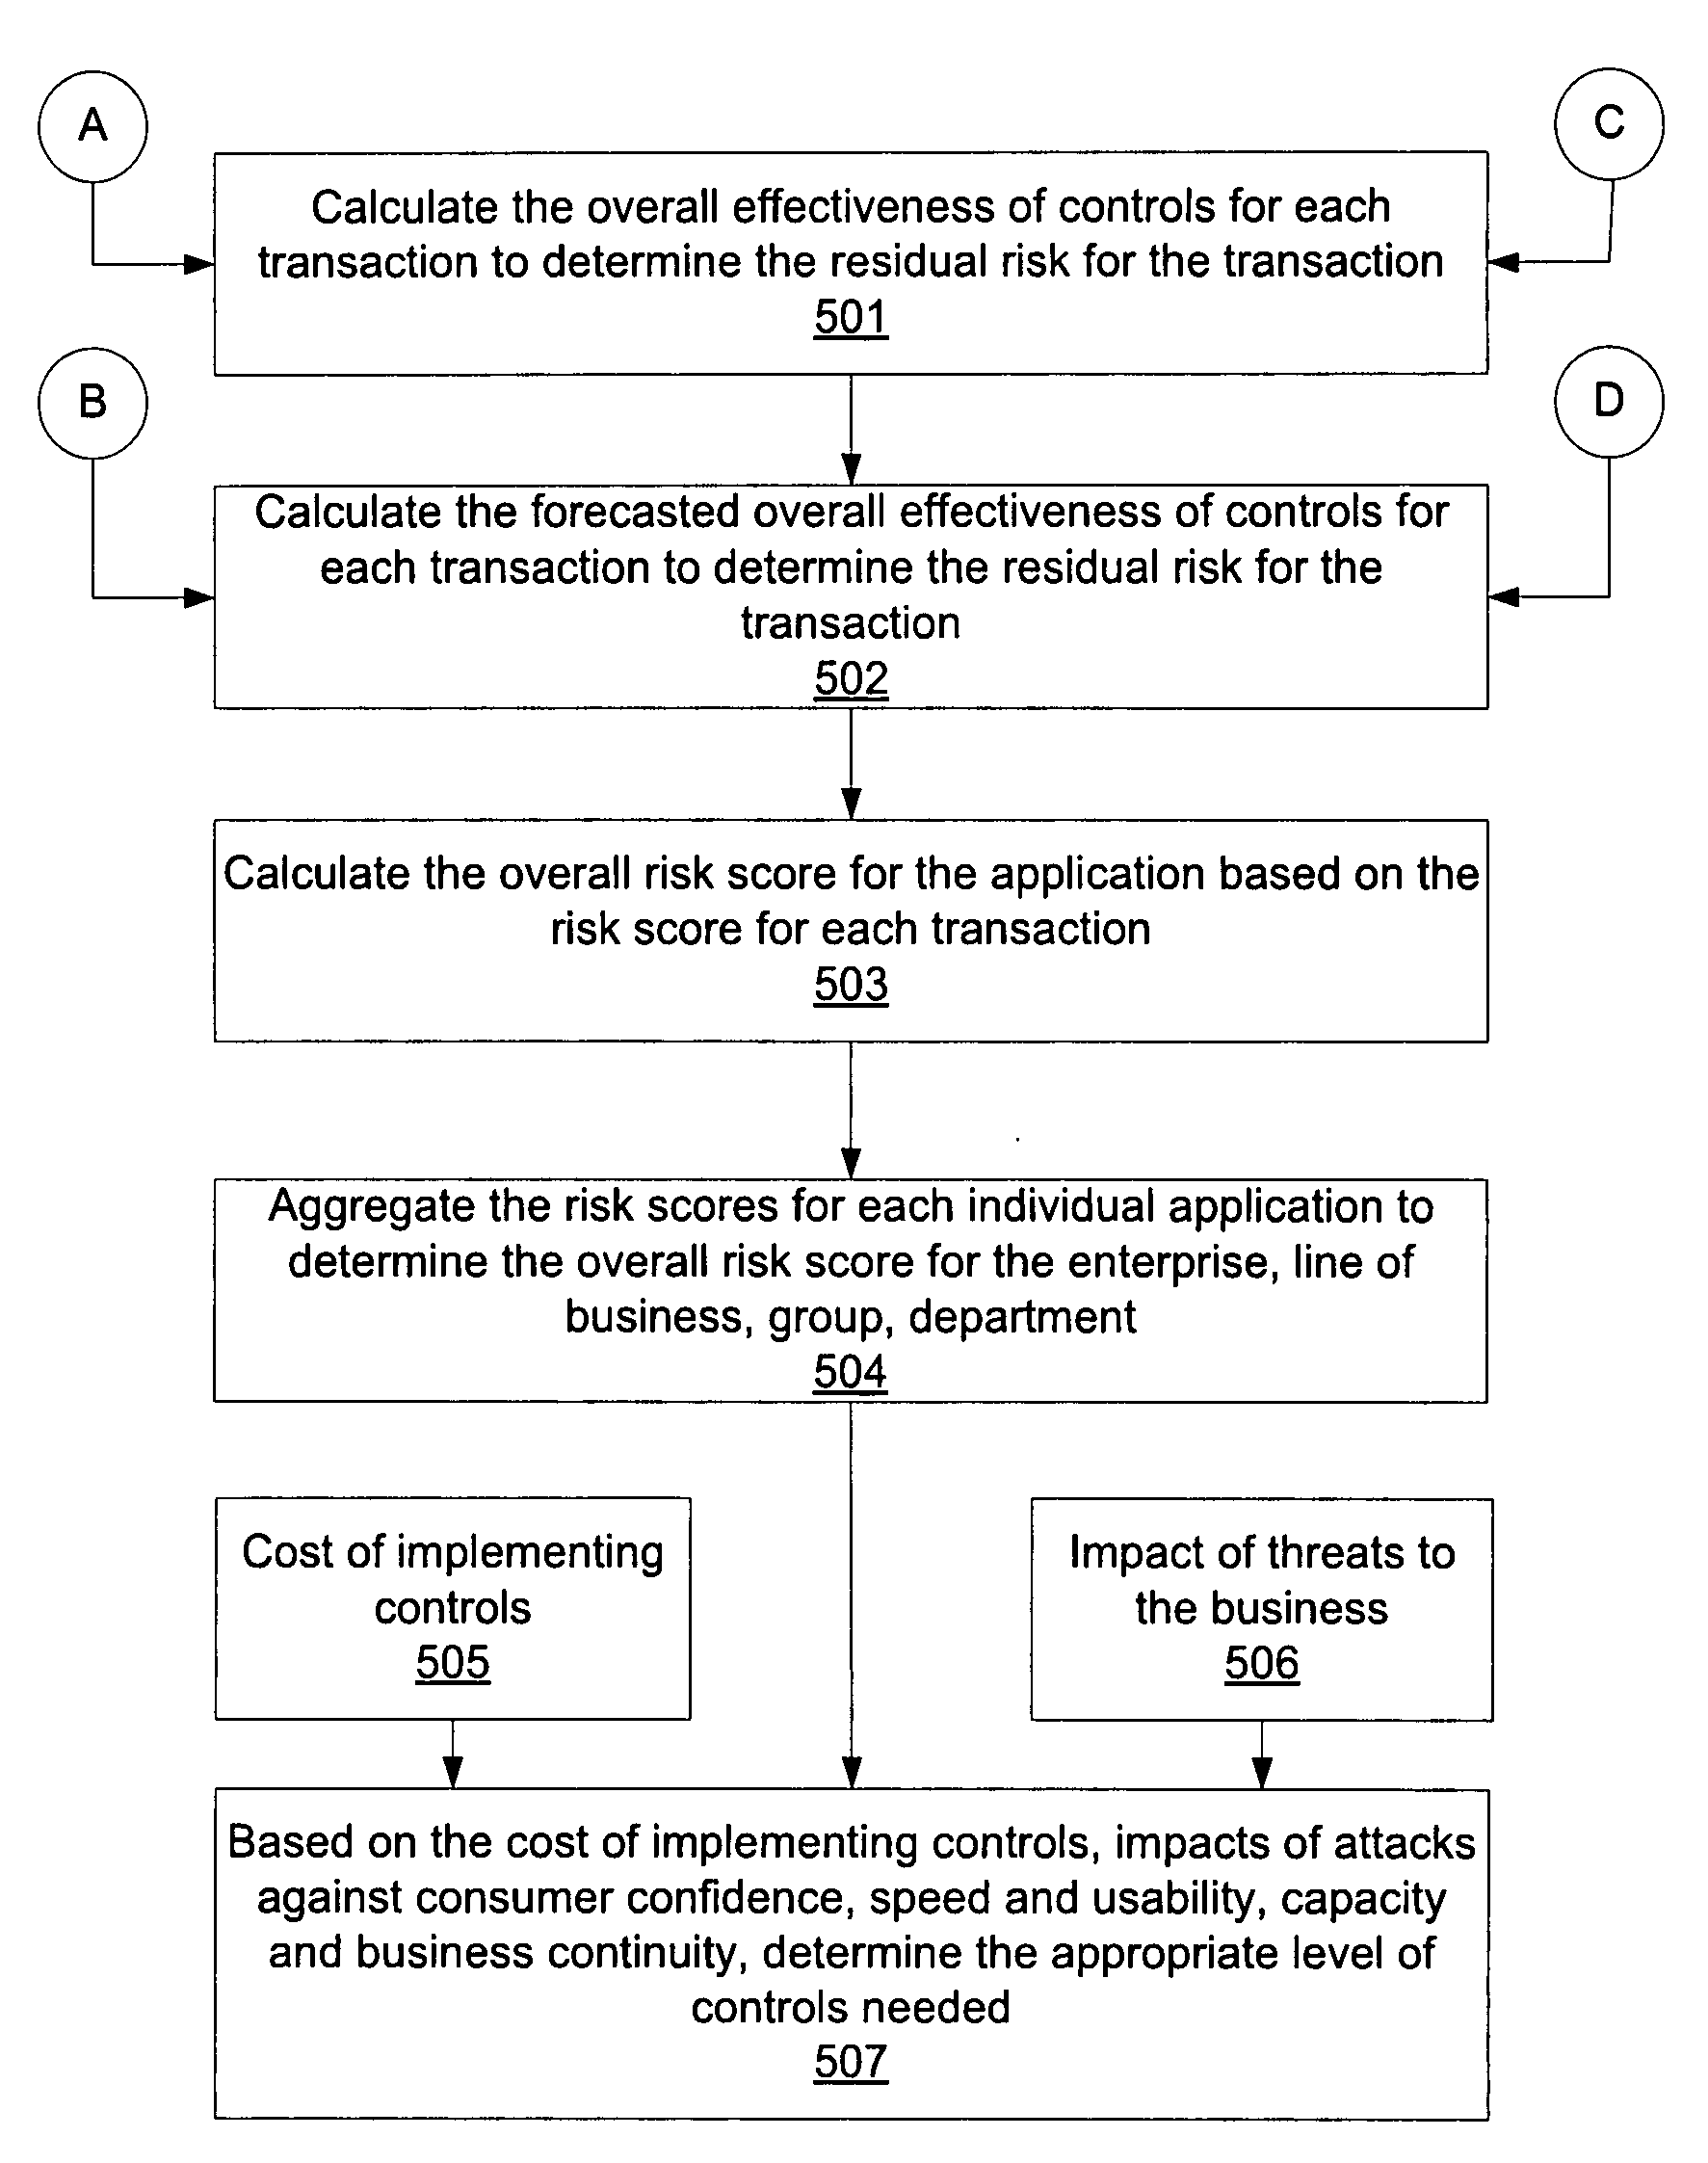
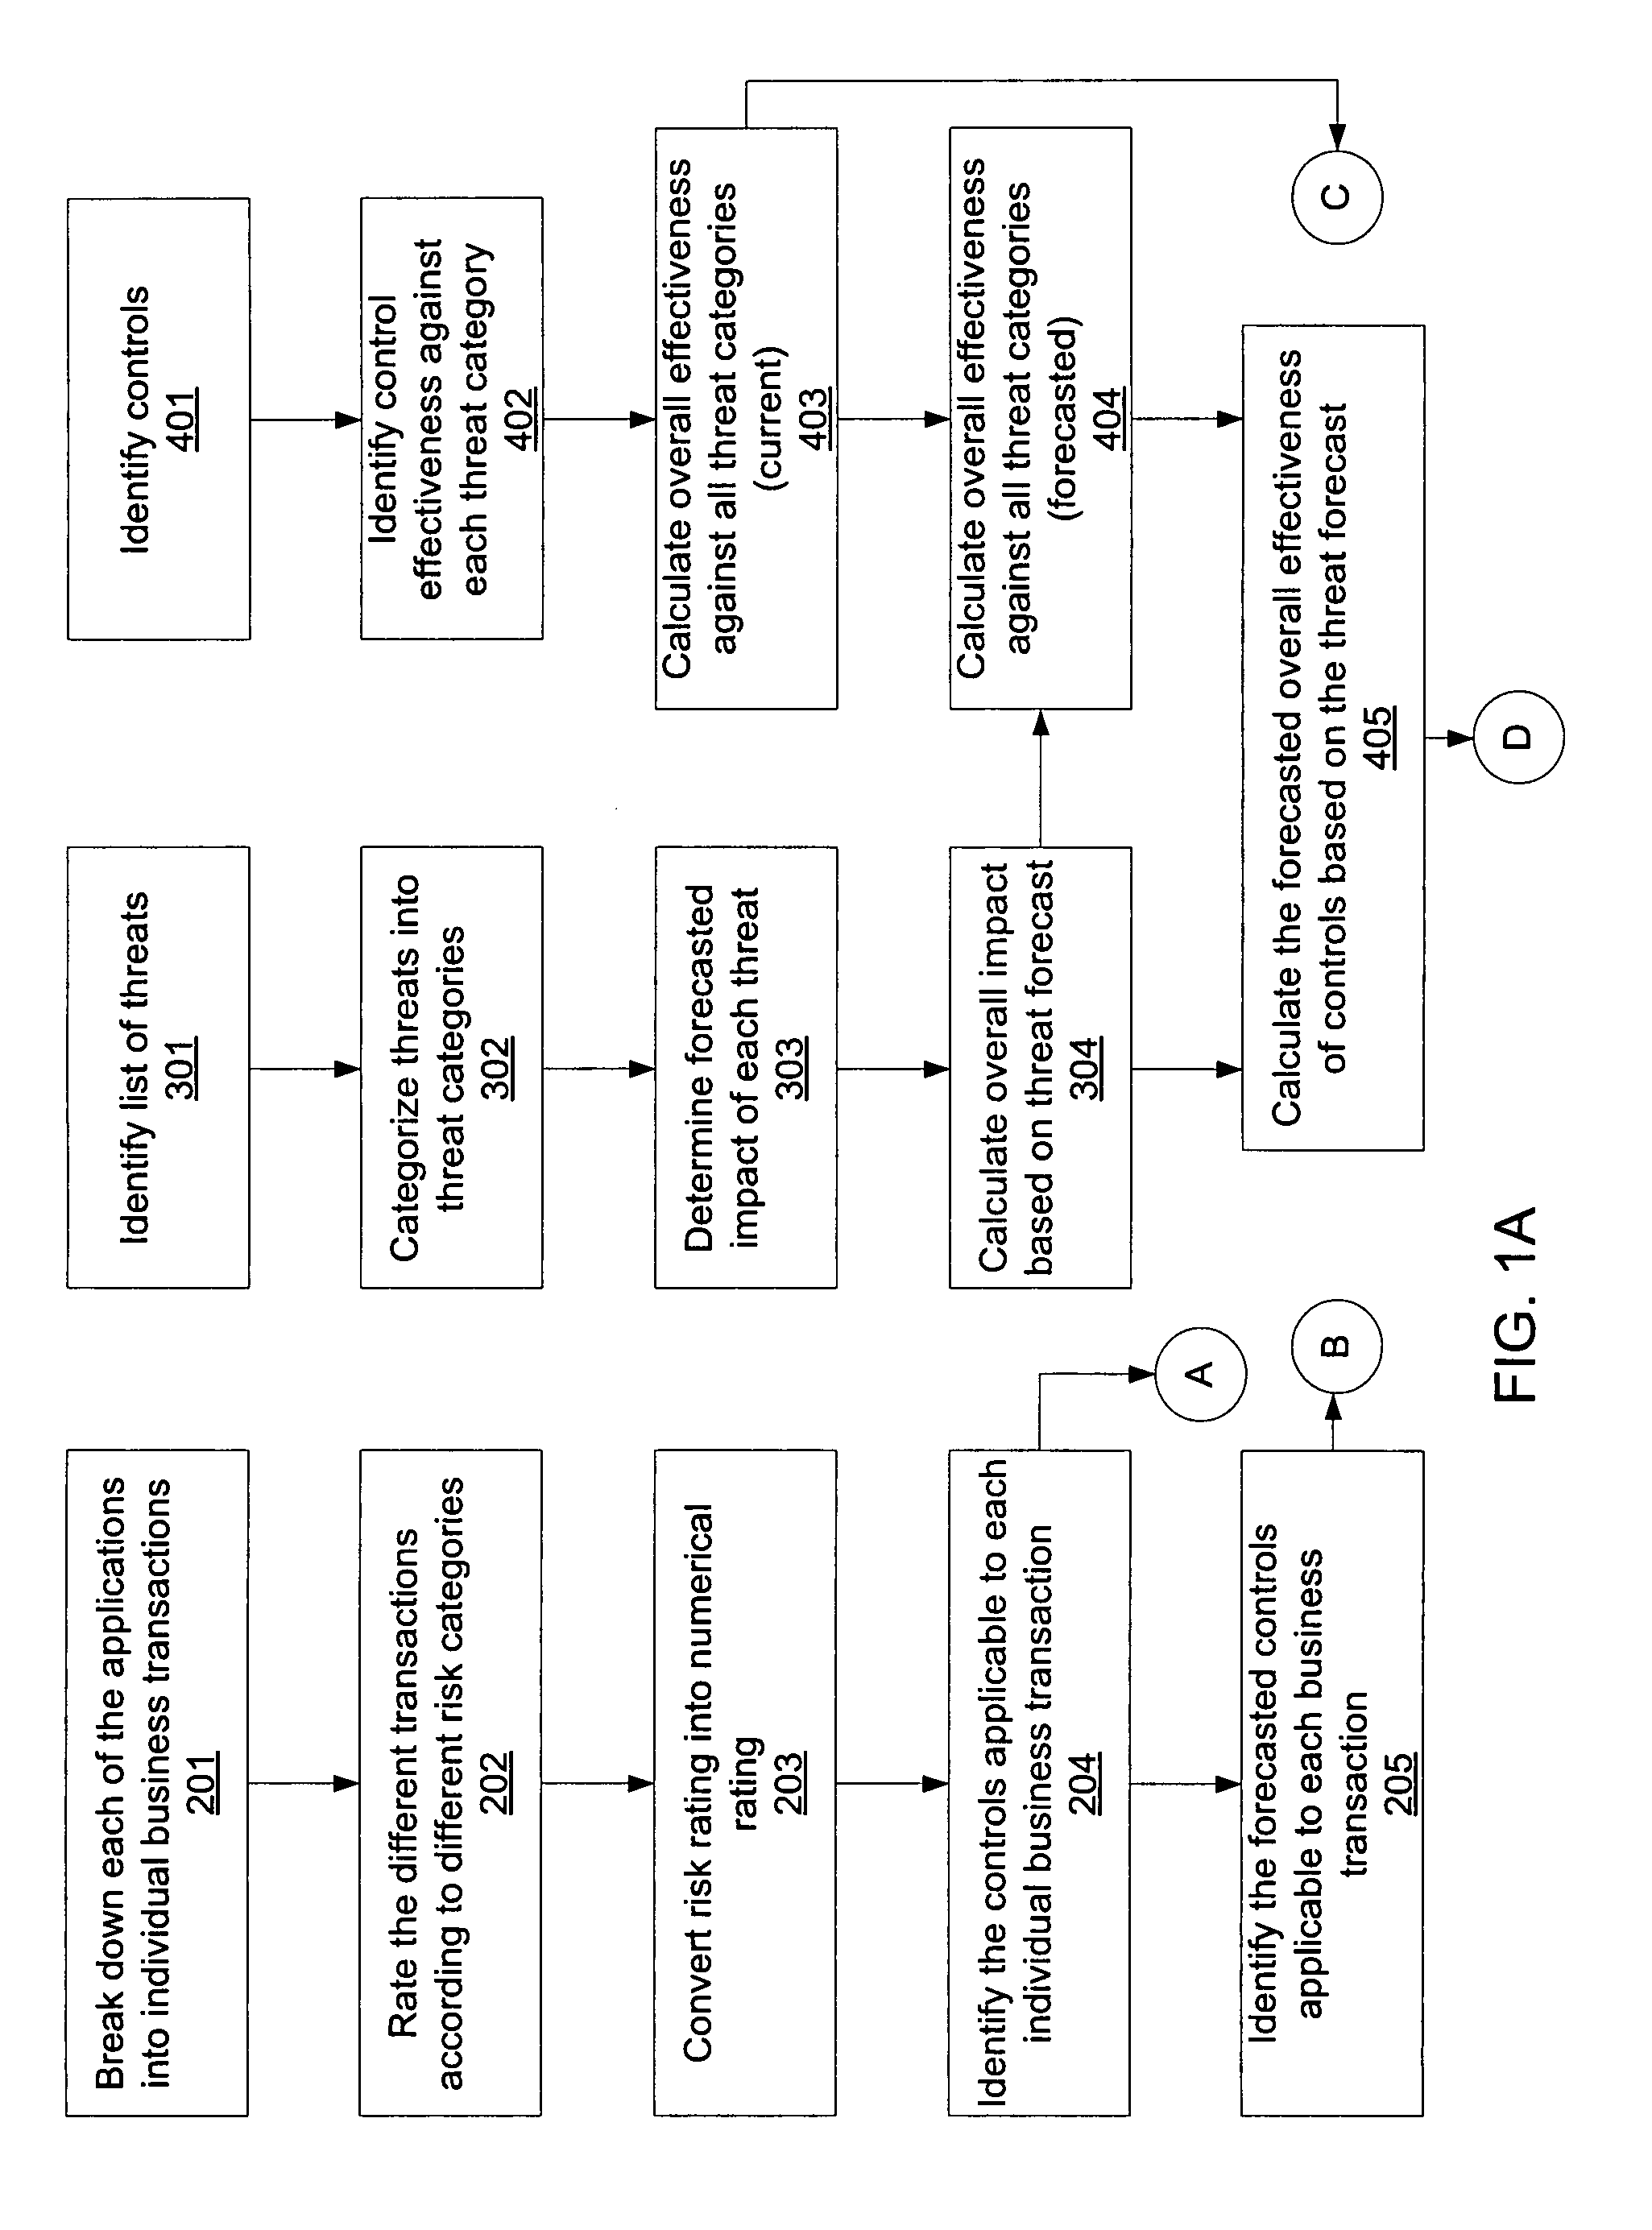
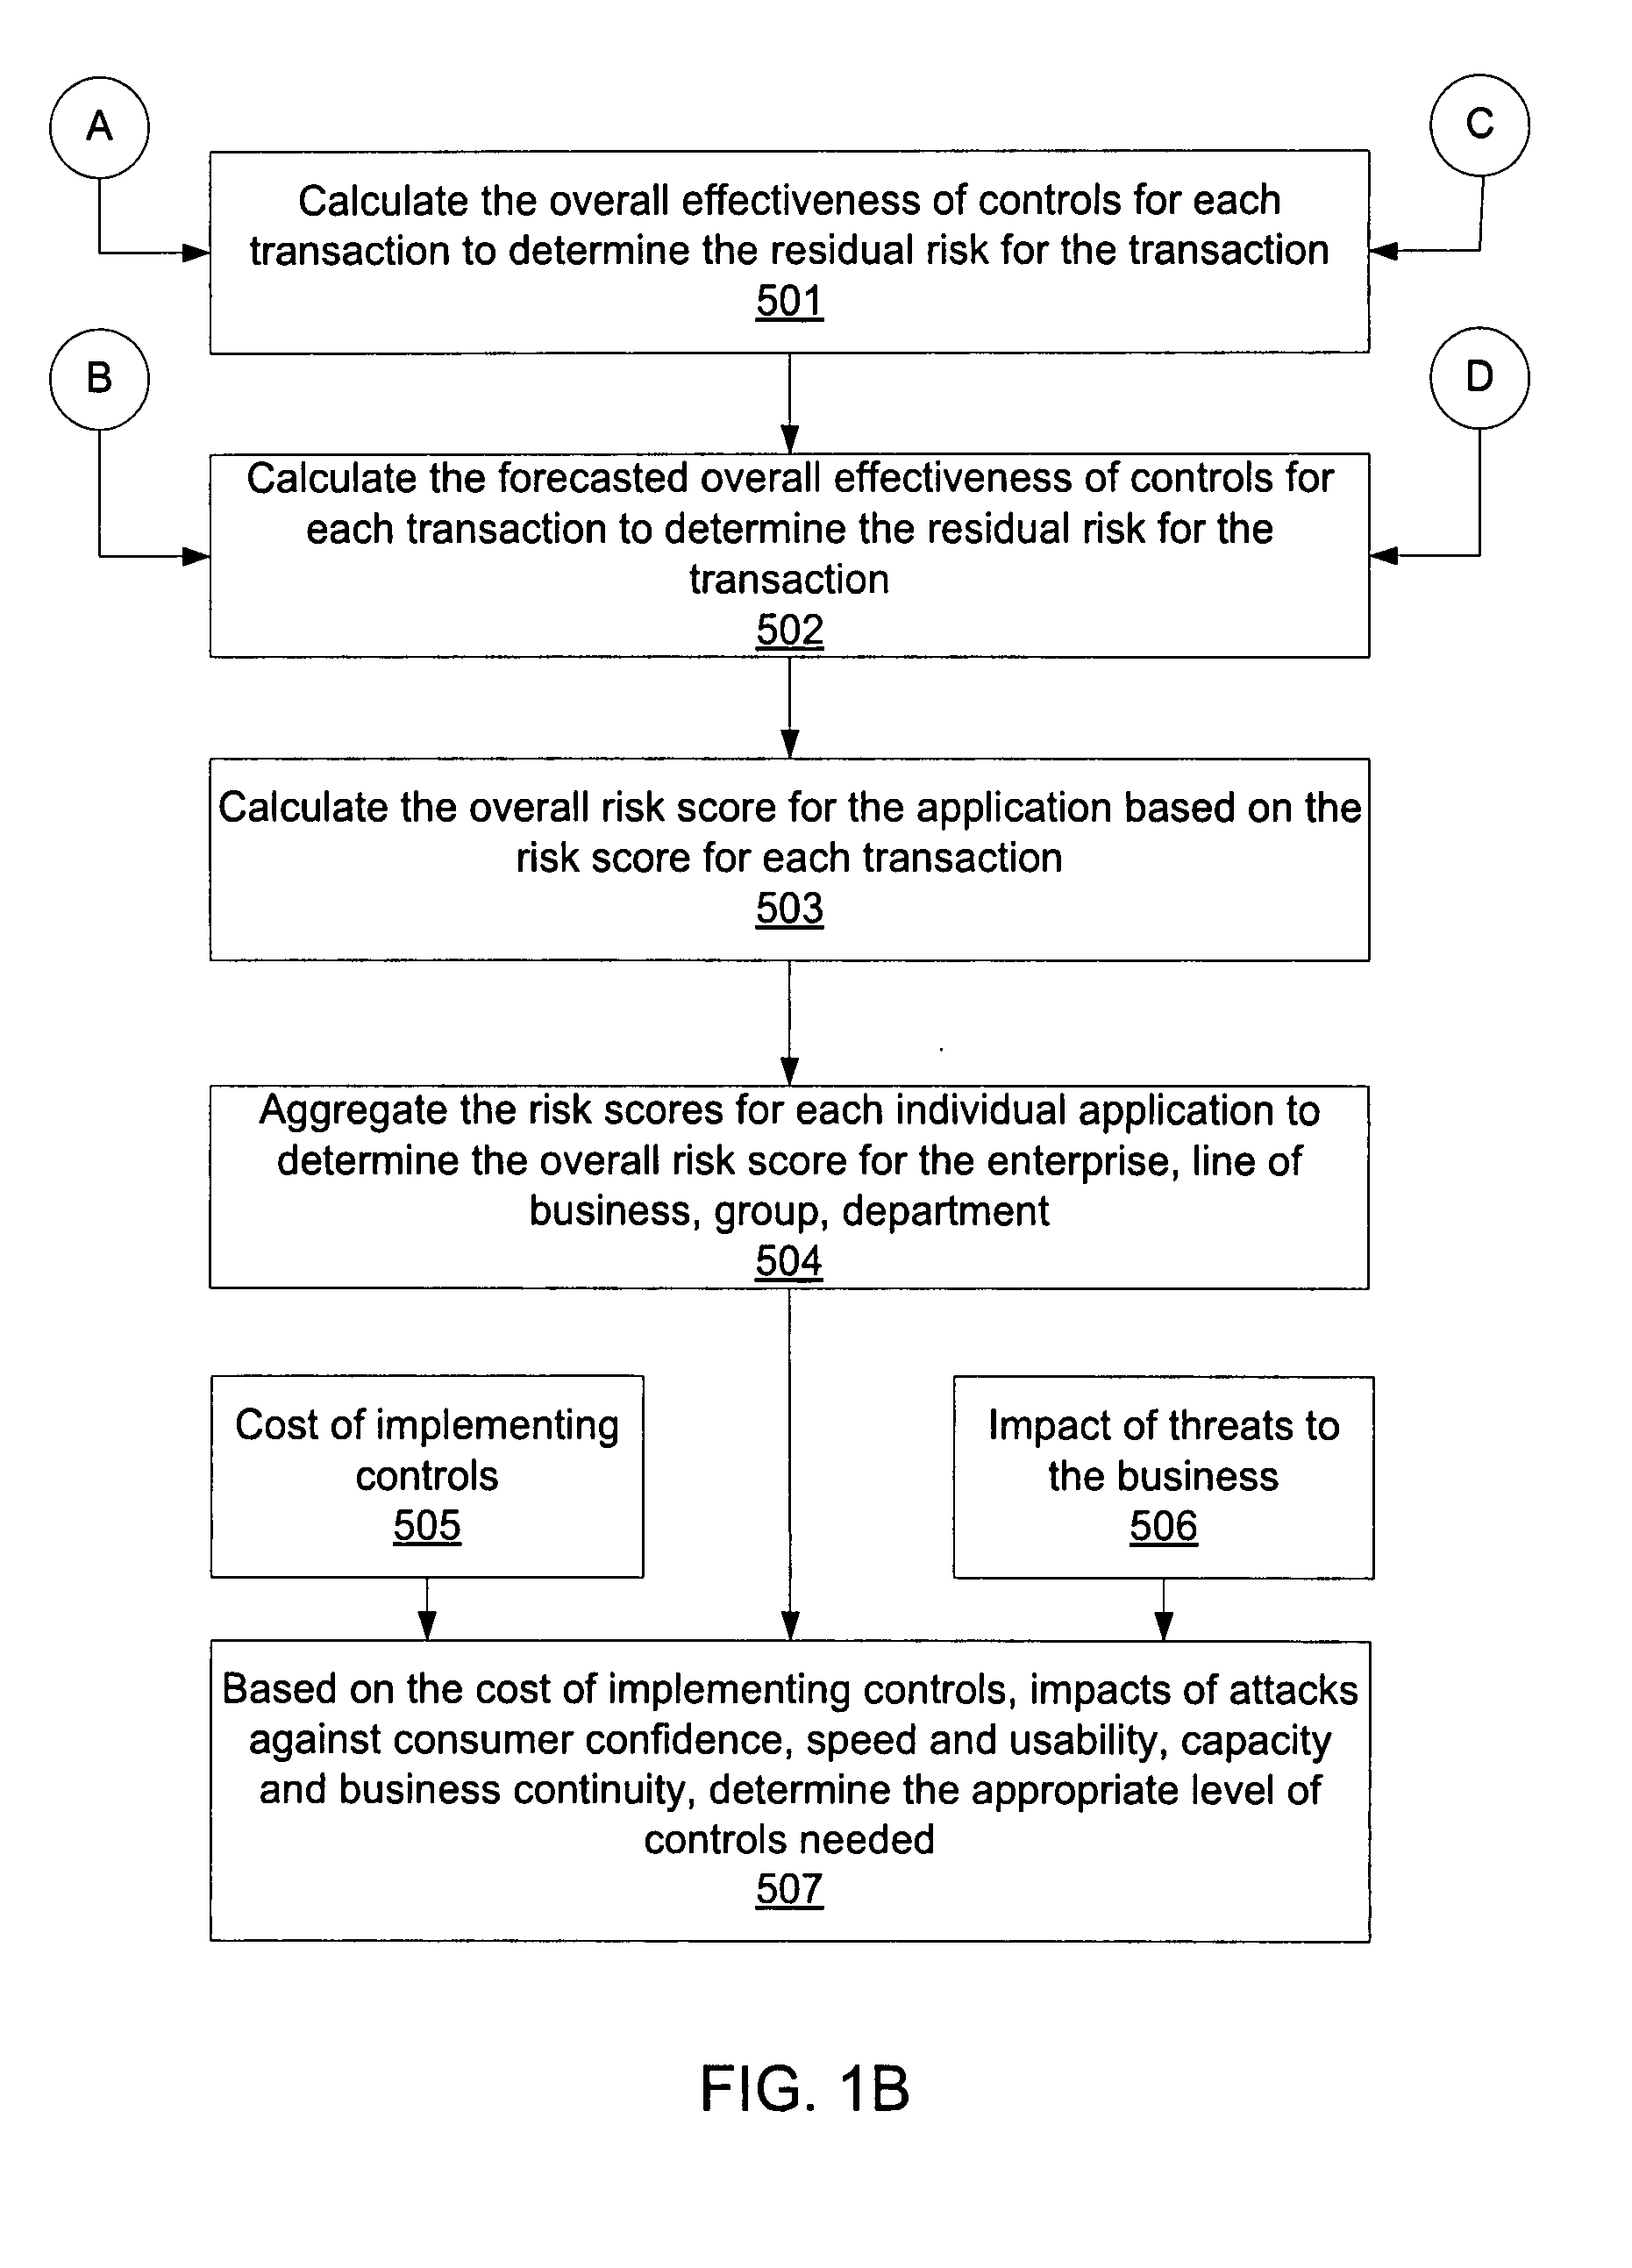
[0013]Another method relating to classifying the threats to the consumer-facing application includes the following steps—receiving an identification of a plurality of threats to a consumer transaction in a consumer-based software application, and receiving an identification of a plurality of threat controls that control at least a portion of the plurality of threats. This method may further include identifying control effectiveness against each of the plurality of threats. This method may also include calculating an overall effectiveness of the controls in terms of an overall effectiveness score with respect to mitigating the effect of the threats on the transaction.
[0014]In accordance with another aspect of the present invention, a system and method determines residual business risks by correlating threats, controls, business continuity factors, and other general risk considerations. Requirements of an initiative of a project are mapped to a taxonomy, and the mapped requirements are rated with respect to its importance to the project. Projected changes in the mapped requirements are forecasted over a specified period of time, such as an eighteen month period. A threat to the project is mapped to the taxonomy, and the mapped threat is rated with respect to its impact on the project. Projected changes in the effectiveness of the control are forecasted based upon historical data, a maturity rating, and the rated effectiveness of the control. Residual risk associated with the project is then determined, and adjustments to one or more resources associated with the project may be made to reduce the determined residual risk.

Problems solved by technology

As with any computer network, the potential for a threat to the network exists.
Still other threats may originate from direct business partners, suppliers, or still other sources.
A vulnerability is a deficiency that leaves an asset open to harm.
When a threat occurs at a business entity and it cannot recover in an immediate manner, the results could lead to revenue losses, customer or supplier losses, goodwill deterioration, and / or shareholder losses.
As business entities operate across multiple locations, the impact on one business unit can inevitably affect other business units.
No system exists to correlate current and forecasted threats to projects and initiatives factoring in current and forecasted controls.
An organization is currently unable to provide a single integrated view of critical operational risk components and risk assessment data.
This limitation forces risk control resource allocations and strategic risk / reward decisions to be based upon disparate and often subjective information.
This problem is evidenced by audits and vulnerability assessments continually exposing additional risks in every environment, line of business challenges in determining how to properly respond to operational risks, and increasing operational loss events.
Many observations, audits, vulnerability assessments, risk assessments, etc. surface a large number of risks in the current environment.
As these risks are surfaced, lines of businesses are challenged with determining how to respond to the risks identified.
Additionally, knowing that not all risks can be controlled or optimized there is limited strategy currently available that assists with forward projection of risk.
Furthermore, risk metrics can change as threats, countermeasures, and controls change or evolve over time.

Method used


Image

  • Threat Modeling and Risk Forecasting Model
  • Threat Modeling and Risk Forecasting Model
  • Threat Modeling and Risk Forecasting Model

Examples


Embodiment Construction

[0031]In the following description of the various embodiments, reference is made to the accompanying drawings, which form a part hereof, and in which is shown by way of illustration various embodiments in which the invention may be practiced. It is to be understood that other embodiments may be utilized and structural and functional modifications may be made without departing from the scope and spirit of the present invention.

[0032]As will be appreciated by one of skill in the art upon reading the following disclosure, various aspects described herein may be embodied as a method, a data processing system, or a computer program product. Accordingly, those aspects may take the form of an entirely hardware embodiment, an entirely software embodiment or an embodiment combining software and hardware aspects. Furthermore, such aspects may take the form of a computer program product stored by one or more computer-readable storage media having computer-readable program code, or instructions...


PUM


Abstract

A system and method for determining residual business risks by correlating threats, controls, business continuity factors, and other general risk considerations is described. Requirements of an initiative of a project are mapped to a taxonomy, and the mapped requirements are rated with respect to its importance to the project. Projected changes in the mapped requirements are forecasted over a specified period of time, such as an eighteen month period. A threat to the project is mapped to the taxonomy, and the mapped threat is rated with respect to its impact on the project. Projected changes in the effectiveness of the control are forecasted based upon historical data, a maturity rating, and the rated effectiveness of the control. Residual risk associated with the project is then determined, and adjustments to one or more resources associated with the project may be made to reduce the determined residual risk.

Description

FIELD OF TECHNOLOGY[0001]Aspects of the disclosure relate to information security services. More specifically, aspects of the disclosure relate to a system and method for identifying and addressing information security and business continuity threats and for measuring risk associated with various transactions.BACKGROUND[0002]Many business entities and organizations operate with a large technological information infrastructure for handling business operations. Whether with respect to particular interfaces with customers or suppliers, or internal interfaces between different departments of an organization, such as financial and engineering, organizations and business entities rely on computerized networks for many, if not all facets of operation.[0003]As with any computer network, the potential for a threat to the network exists. In an organization or business entity, the threat can arise from many sources. In some instances, a threat source may originate from external sources, such a...

Claims


Application Information

Patent Timeline
Patent Type & Authority Applications(United States)
IPC IPC(8): G06F17/00
CPCG06Q10/04G06Q10/06312G06Q40/02G06Q10/0635G06Q10/06313
Inventor BARVE, AJAY M.SANKARAN, ARUNRENFRO, CHADWICK R.YOMINE, DANIEL F.VAUGHAN, ROBERT KEITHGILLESPIE, COREY S.SLOAN, GREGG S.
Owner BANK OF AMERICA CORP
Why Eureka
Eureka Blog
Learn More