Method for process monitoring in a utility system

a technology of process monitoring and utility system, applied in the field of utility system, can solve the problems of reducing efficiency, affecting the entire process employing the apparatus, affecting the efficiency of the entire process, etc., and achieve the effects of reducing efficiency, shortening the life expectancy, and reducing the loss of product and/or revenu

Active Publication Date: 2009-08-13
SQUARE D CO
View PDF5 Cites 39 Cited by
  • Summary
  • Abstract
  • Description
  • Claims
  • Application Information

AI Technical Summary

Benefits of technology

[0005]Aspects disclosed herein allow the end-user to monitor processes easily within a utility monitoring system to make a simpler assessment of the “big picture” impact of discrete events to the respective processes. As used herein, an “event” includes any utility parameter(s) excursion outside of a predetermined threshold. The occurrence of a problem associated with an apparatus at a single facility may adversely affect more than just that apparatus—the problem may directly or indirectly affect the entire process employing the apparatus. Some of the aforementioned adverse “affects” may include damaged equipment, reduced efficiency, shorter life expectancy, loss of product and / or revenue, degraded product quality, injured reputation, supplemental expenses, additional maintenance, and unscheduled downtime, to name a few. Aspects disclosed herein provide the end-user with a better scope on how an event can or will impact their equipment, processes, and products.

Problems solved by technology

The occurrence of a problem associated with an apparatus at a single facility may adversely affect more than just that apparatus—the problem may directly or indirectly affect the entire process employing the apparatus.
Some of the aforementioned adverse “affects” may include damaged equipment, reduced efficiency, shorter life expectancy, loss of product and / or revenue, degraded product quality, injured reputation, supplemental expenses, additional maintenance, and unscheduled downtime, to name a few.

Method used


Image

  • Method for process monitoring in a utility system
  • Method for process monitoring in a utility system
  • Method for process monitoring in a utility system

Examples


Embodiment Construction

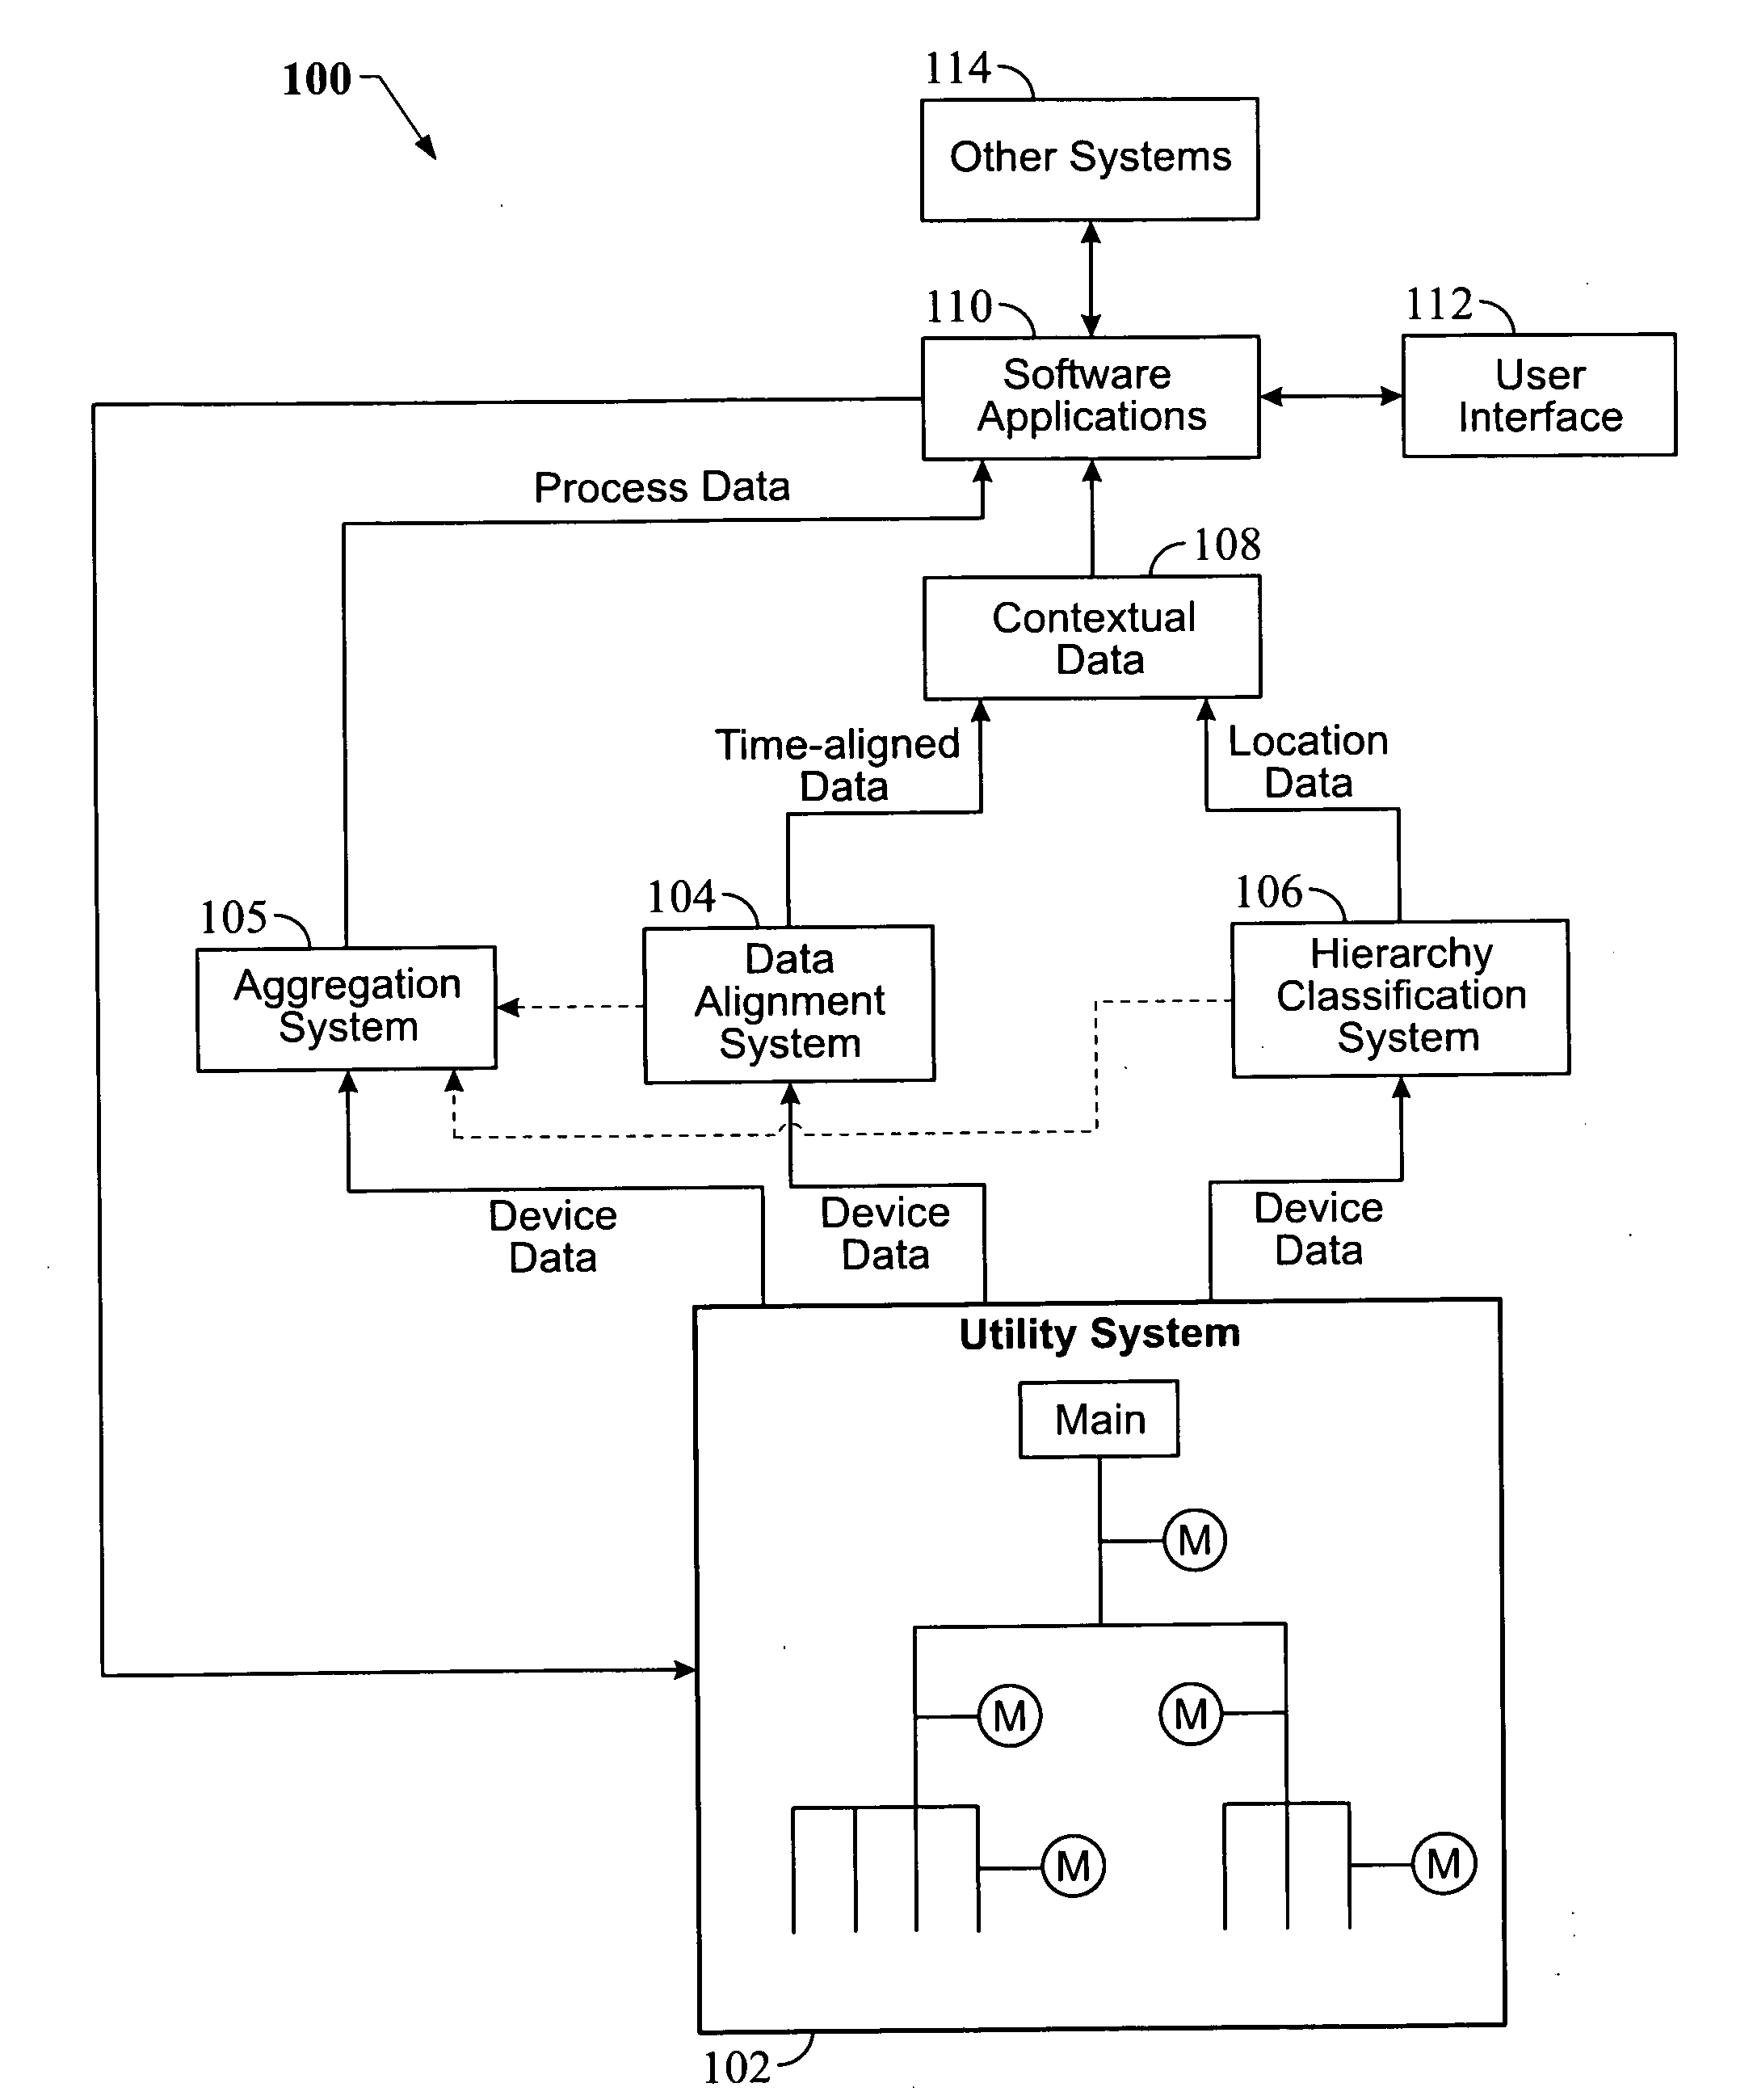
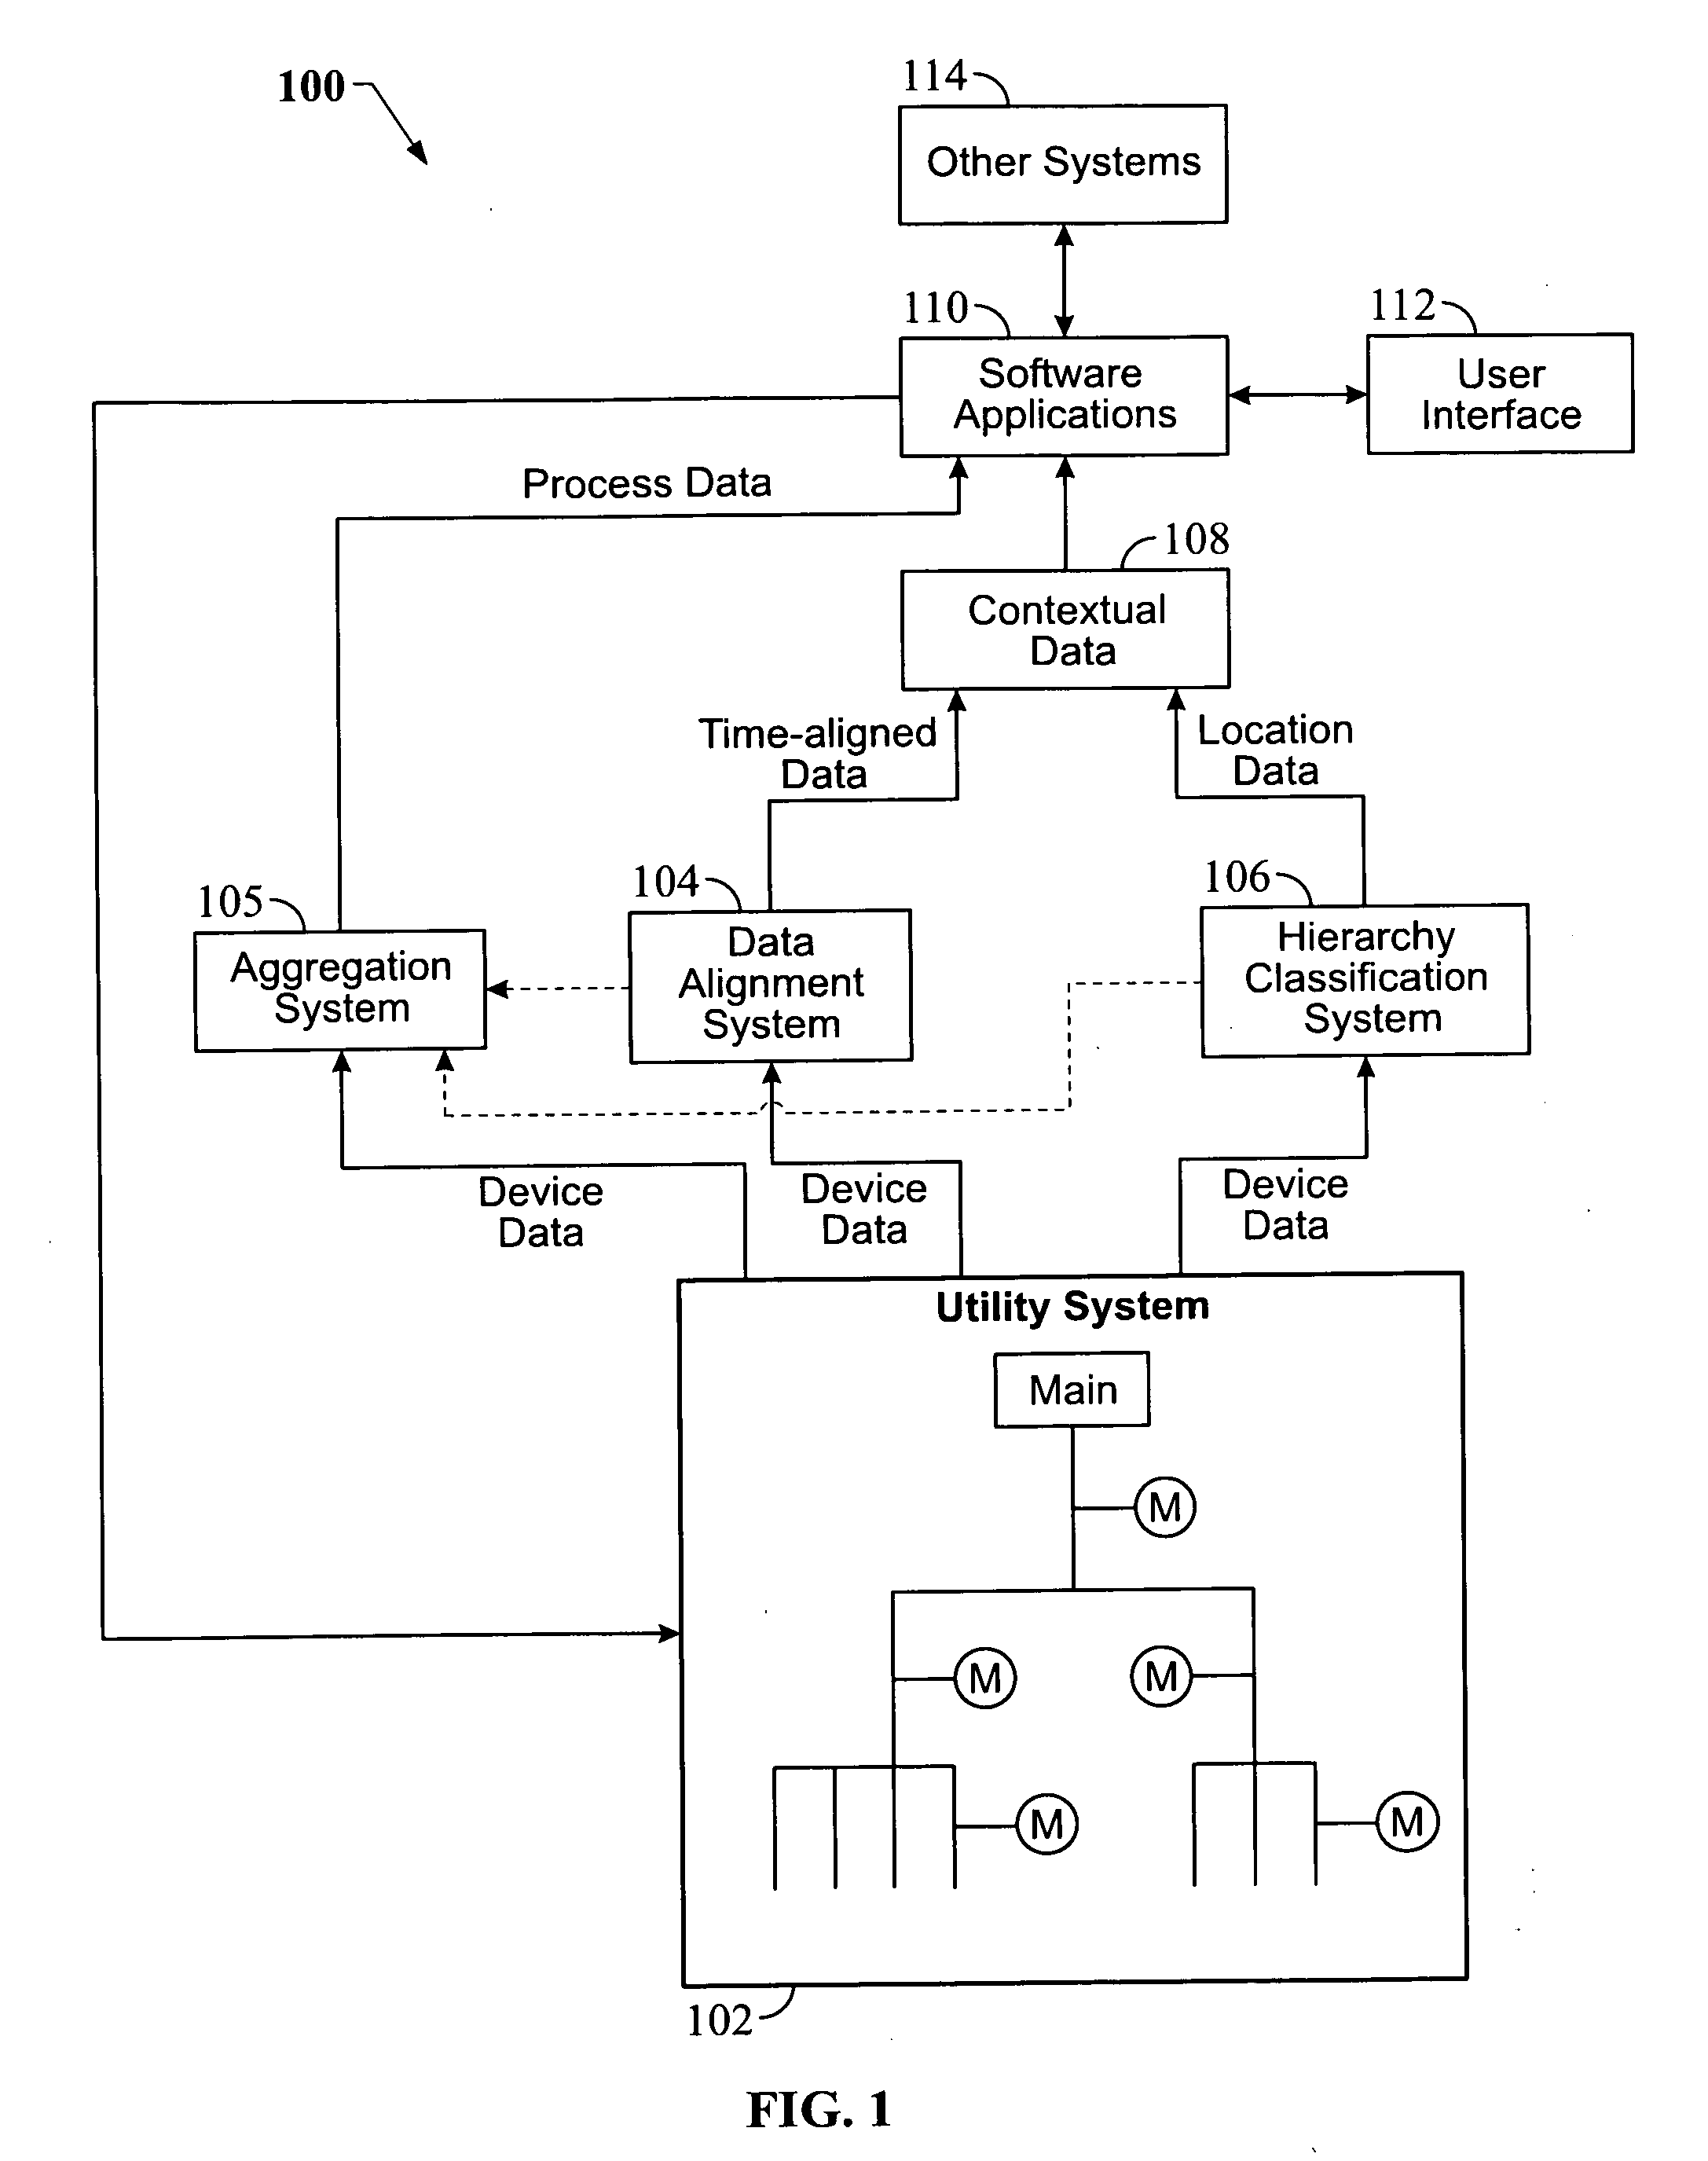
[0029]Turning now to FIG. 1, an automated data integrated monitoring system 100 is generally shown. A utility system 102 having multiple monitoring devices M provides data from each monitoring device M that is communicated to an automated data alignment system 104 and an automated hierarchy classification system 106. The data is aligned automatically in the automated data alignment system 104 and produces data that is aligned such that it represents the data when it was actually seen simultaneously by the monitoring devices M in the power monitoring system 102. The hierarchy classification system 106 automatically learns the hierarchy of monitoring devices present in the utility system 102 and their positional relationships relative to one another. Examples of the hierarchy classification system 106 and algorithms associated therewith are described in U.S. Pat. No. 7,272,518, titled “Automated Hierarchy Classification in Utility Monitoring Systems,” issued Sep. 18, 2007, and in PCT ...


PUM


Abstract

A process monitoring method that aggregates monitoring devices and optionally sensors into one or more groups that are each related to a process of a utility system. The monitoring devices are organized into a monitoring system hierarchy manually or automatically. A process algorithm determines from the hierarchy which monitoring devices are connected to a load. Monitored data from load-connected monitoring device pairs are correlated to produce a correlation coefficient that is compared against a correlation threshold selected between 0 and 1. When the correlation coefficient exceeds the threshold, the device pair is grouped into a process group. Other device pairs exceeding the threshold are likewise grouped into the process group. Multiple processes may be determined with the process algorithm. Sensors may also be grouped manually with the process group containing monitoring devices, which may include virtual monitoring devices. Alarms associated with monitoring devices and sensors are aggregated into one process alarm.

Description

CROSS-REFERENCE TO RELATED APPLICATION[0001]This application is related to U.S. Pat. No. 7,272,518, titled “Automated Hierarchy Classification in Utility Monitoring Systems,” issued Sep. 18, 2007.FIELD OF THE INVENTION[0002]Aspects disclosed herein relate generally to utility systems, and, in particular, to a method for process monitoring in a utility system.BACKGROUND[0003]Today's utility monitoring systems provide end-users with the capability to alarm on a vast array of anomalous parameters. For example, many electrical system monitoring devices can detect and notify the end-user of overvoltage transient events, voltage sags, excessive voltage unbalance, harmonic distortion issues, etc. Although each of these alarms is beneficial, an end-user's “big picture” understanding of the overall condition of a utility monitoring system may be clouded by the details from so many discrete alarms. The sheer number of discrete alarms can be overwhelming and tend to obfuscate rather than pinpo...

Claims


Application Information

Patent Timeline
Patent Type & Authority Applications(United States)
IPC IPC(8): G06F17/18G08B21/00
CPCG01D3/10G01D4/002G05B23/0272Y02E60/74Y02B90/241Y04S10/30Y04S20/32H02J13/0006Y02B90/20Y02E60/00Y04S10/52Y04S20/00H02J13/00001H02J13/00002Y04S10/40Y04S20/30
Inventor BICKEL, JON A.
Owner SQUARE D CO
Why Eureka
Try Eureka