Automatic And Continuous Quantitative Analysis Method And Apparatus For Multiple Components

a quantitative analysis and quantitative analysis technology, applied in the field of automatic and continuous quantitative analysis methods and apparatuses, can solve the problems of inconvenient data processing, difficult to accurately separate the absorption spectra of such multiple organic compounds, and low data processing speed

Inactive Publication Date: 2009-10-01
JASCO CORP
View PDF4 Cites 10 Cited by
  • Summary
  • Abstract
  • Description
  • Claims
  • Application Information

AI Technical Summary

Benefits of technology

[0016]To perform quantitative analysis of a measurement sample that includes a plurality of known components by the automatic and continuous quantitative analysis method according to the present invention, described above, a step of specifying, as a quantification wave number for each component of the plurality of components, a wave number at a tip of one absorption peak that overlaps as little as possible with absorption peaks in infrared absorption spectra of the other components, freely selected as a particular absorption peak for the component, of specifying an order for the plurality of components in which the corresponding infrared absorption spectra are subtracted to generate the difference spectra, and of generating a calibration curve for the component for the absorbance and concentration at the quantification wave number is performed; and a step of repeating the quantification of the concentration of a component of the plurality of components having a prescribed highest order in the measurement sample from an absorbance at an absorption peak corresponding to the quantification wave number of the component having the prescribed highest order, in the infrared absorption spectrum of the measurement sample or the difference spectrum generated in the step immediately before and from the calibration curve for the component having the prescribed highest order, and the subtraction, from the infrared absorption spectrum of the measurement sample or the difference spectrum generated in the step immediately before, of an infrared absorption spectrum for the component having the prescribed highest order alone, where an absorbance at the quantification wave number for the component having the prescribed highest order is set to have the same intensity as the absorbance in the infrared absorption spectrum of the measurement sample or the difference spectrum, to generate the next difference spectrum is performed to quantify each component of the plurality of components included in the measurement sample. Therefore, the concentrations of the plurality of components can be automatically and continuously quantified, and the concentration

Problems solved by technology

Therefore, it is difficult to accurately separate the absorption spectra of such multiple organic compounds having the absorption regions close to each other and similar absorption curve shapes to obtain highly precise quantitative analysis results.
If a Fourier transform infrared spectrophotometer provided with an interference mechanism having a high resolution and a high S/N ratio is used, the separation can be facilitated but, even with it, if the measurement sample includes a plurality of components, a large amount of data is handled in concentration calculations to make the data processing speed lower, which is considered to be inconvenient, especially for continuous analysis (see Japanese Unexamined Patent Applications P

Method used


Image

  • Automatic And Continuous Quantitative Analysis Method And Apparatus For Multiple Components
  • Automatic And Continuous Quantitative Analysis Method And Apparatus For Multiple Components
  • Automatic And Continuous Quantitative Analysis Method And Apparatus For Multiple Components

Examples


Embodiment Construction

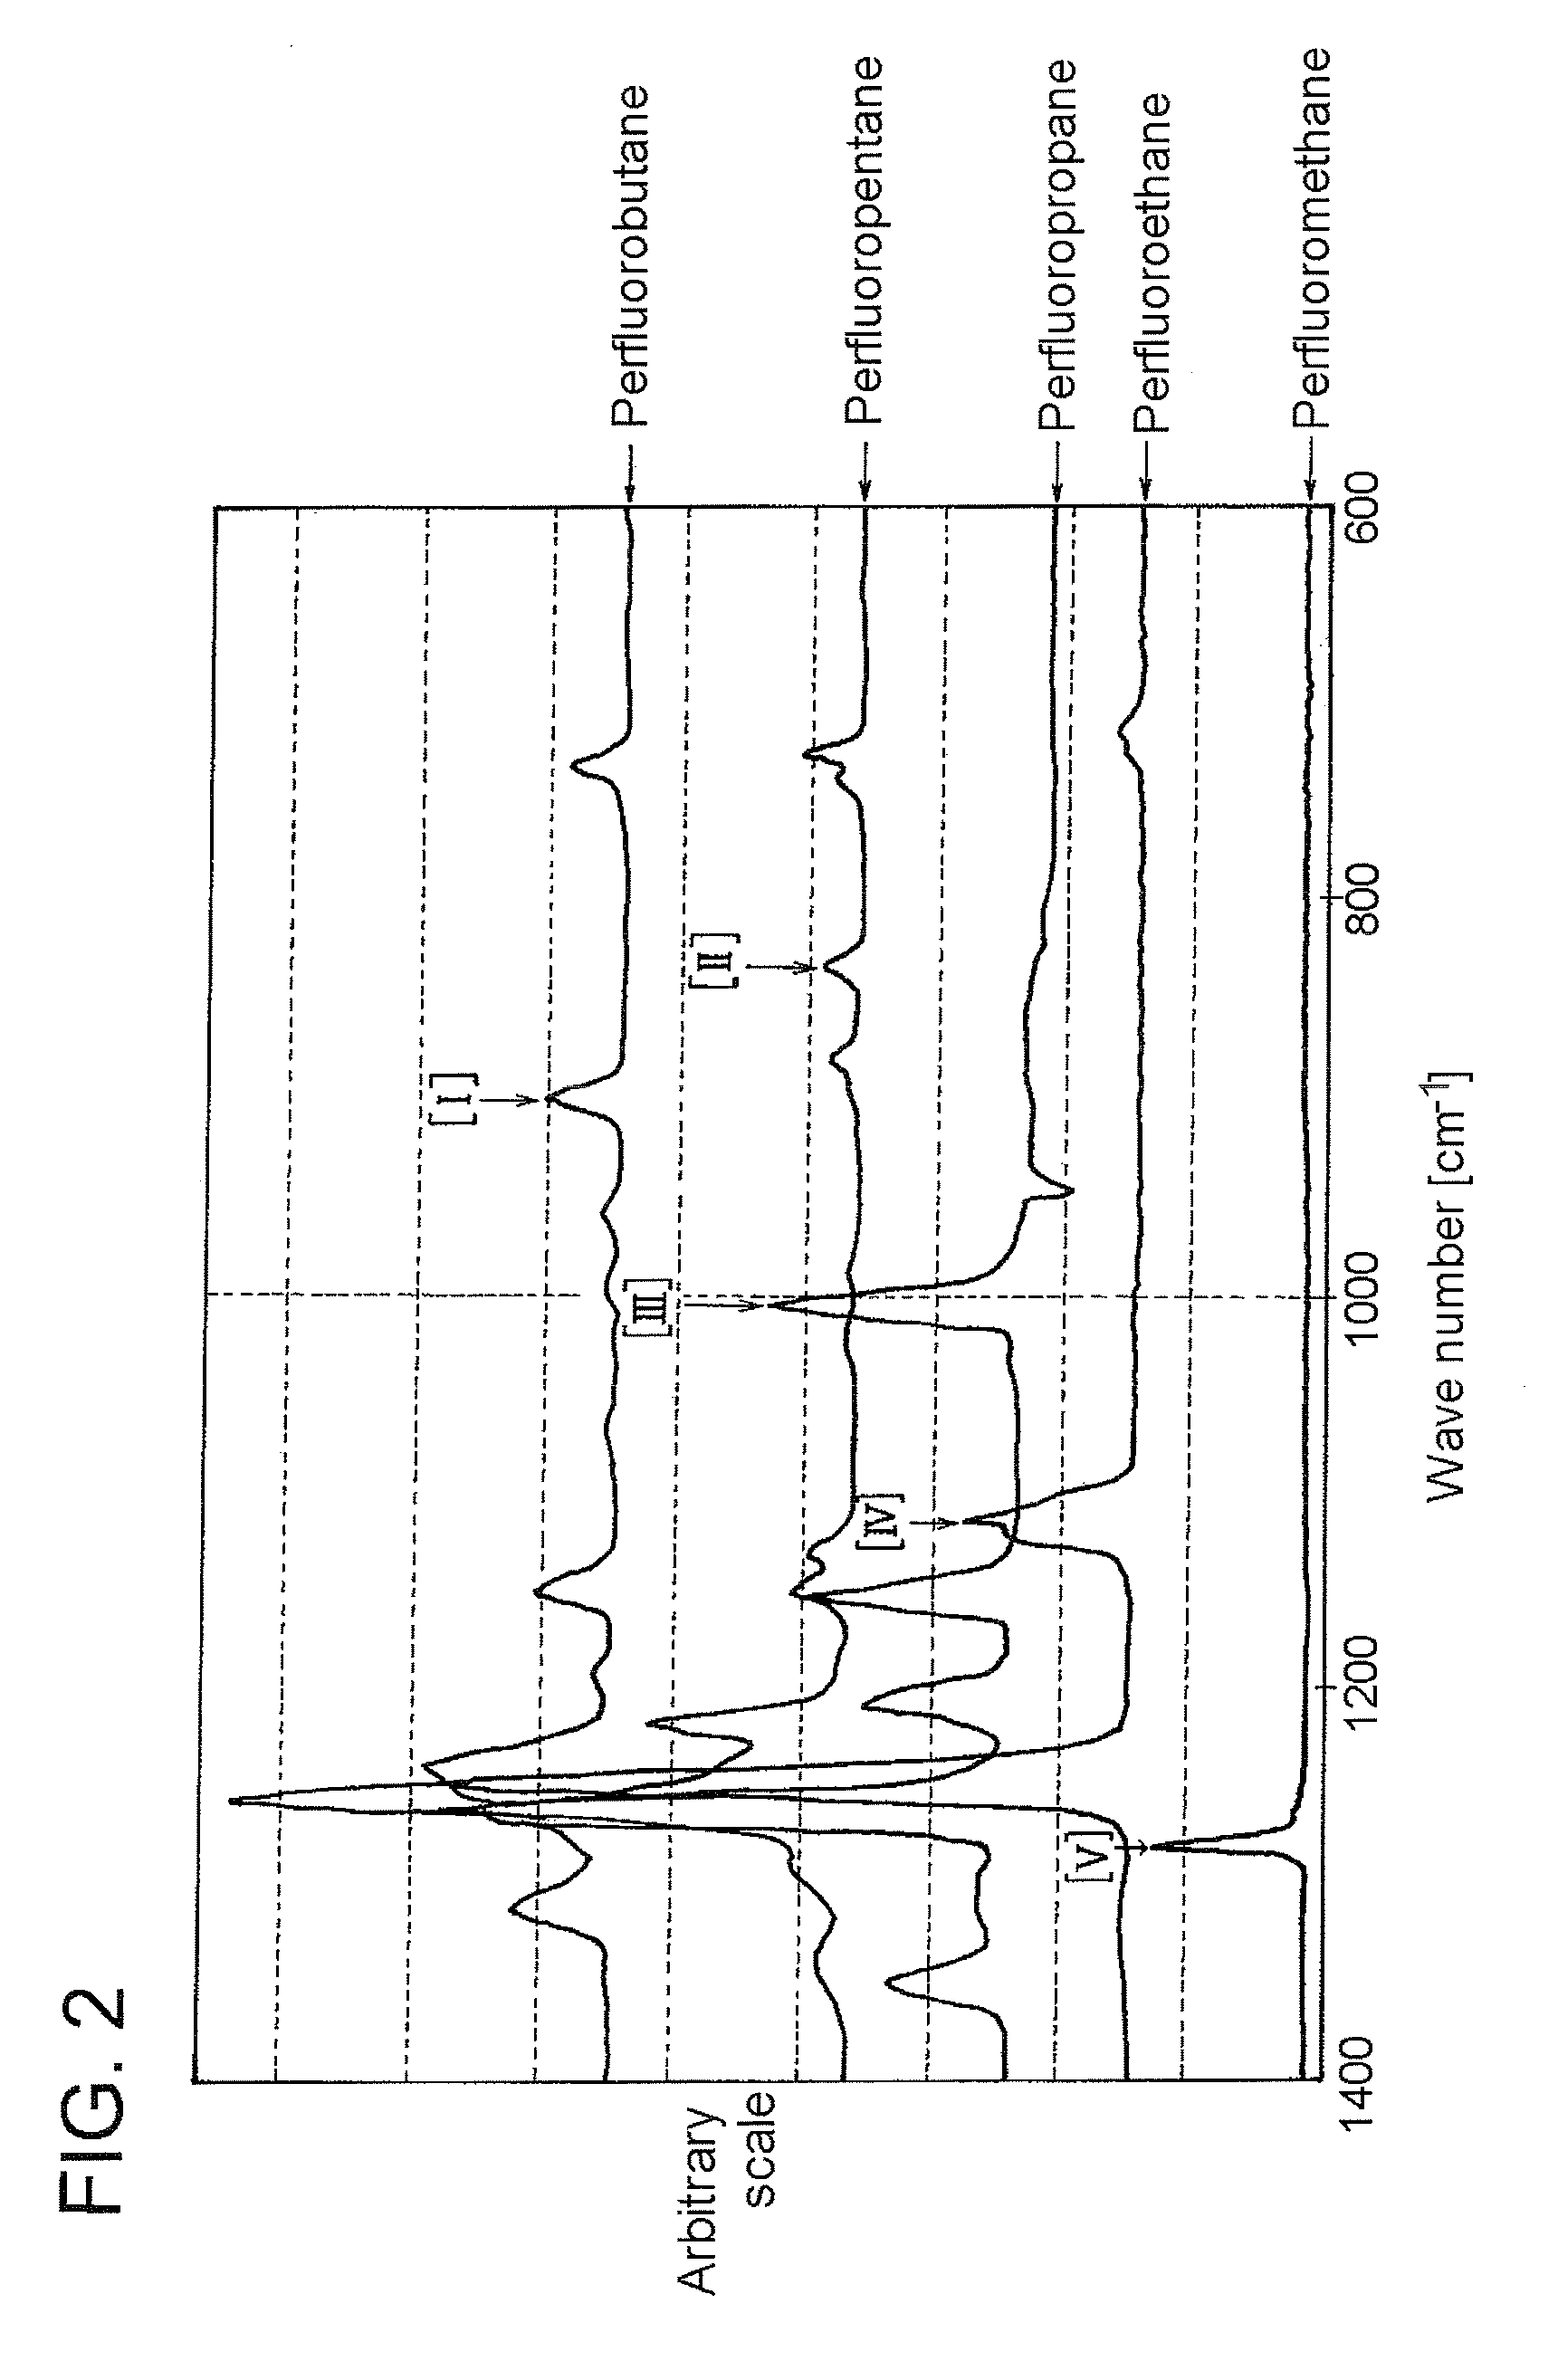
[0025]FIG. 2 is a graph of infrared absorption spectra of five individual components of perfluorocarbon, having predetermined concentrations. The vertical axis indicates the absorbance on an arbitrary scale and the horizontal axis indicates the wave number (cm−1). Among many absorption peaks existing in the infrared absorption spectra of the five individual components, one absorption peak is selected for each component as a particular absorption peak, which overlaps with the absorption peaks of the other components as little as possible. The particular absorption peak can be any absorption peak so long as it overlaps with the other peaks as little as possible. The particular absorption peak is not limited by its absorbance magnitude or its wave number range. In FIG. 2, one absorption peak selected for each of the five individual components in their infrared absorption spectra is indicated by an arrow as particular absorption peaks [I], [II], [III], [IV], and [V], but they are merely...


PUM


Abstract

An automatic and continuous quantitative analysis method and apparatus capable of accurately and quickly quantifying the concentration of each component of a plurality of known components having close infrared absorption regions and similar infrared absorption curve shapes, included in a measurement sample. As a quantification wave number for each component of the plurality of components, a wave number at a tip of one absorption peak that overlaps as little as possible with absorption peaks in infrared absorption spectra of the other components, selected as a particular absorption peak for the component, is specified. A step is repeated in which the concentration of each component of the plurality of components having a prescribed highest order in the measurement sample is quantified from an absorbance at an absorption peak corresponding to the quantification wave number of the component having the prescribed highest order, in the spectrum of the measurement sample or a difference spectrum generated immediately before and from a calibration curve generated in advance for the component having the prescribed highest order, and an infrared absorption spectrum for the component having the prescribed highest order alone, where an absorbance at the quantification wave number for the component having the prescribed highest order is set to have the same intensity as the absorbance is subtracted from the spectrum of the measurement sample or the difference spectrum generated immediately before to generate a difference spectrum.

Description

RELATED APPLICATIONS[0001]This application claims the priority of Japanese Patent Application No. 2008-080620 filed on Mar. 26, 2008, which are incorporated herein by reference.FIELD OF THE INVENTION[0002]The present invention relates to automatic and continuous quantitative analysis methods and apparatuses for analyzing the concentrations of multiple components included in a sample.BACKGROUND OF THE INVENTION[0003]A Fourier transform infrared (FT-IR) spectrophotometer 1 having a structure similar to that outlined in FIG. 1 is generally used for quantitative analysis of multiple components included in a sample. The Fourier transform infrared spectrophotometer 1 includes an analysis section 2 and a data processing section 3. The analysis section 2 includes a light source 10 for emitting an infrared beam; an interference mechanism 17 for generating an interferogram, which includes a beam splitter 12, a fixed mirror 14, and a movable mirror 16; a cell 18 that accommodates a sample and ...

Claims


Application Information

Patent Timeline
IPC IPC(8): G01J5/02G01N21/35G01N21/3504G01N21/3581
CPCG01N2021/3595G01N21/3504
Inventor JIN, CHIHIRO
Owner JASCO CORP
Why Eureka
Try Eureka