Interpretive Computing Over Visualizations, Data And Analytics
a technology of visualization and data, applied in the field of interactive computing over visualizations, data and analytics, can solve the problems of limitations to the type of information that can be visually conveyed, how, and limitations to the extent to which a user (other than the actual author of the model) can manipulate the model
- Summary
- Abstract
- Description
- Claims
- Application Information
AI Technical Summary
Benefits of technology
Problems solved by technology
Method used
Image
Examples
example # 1
ADDITIONAL EXAMPLE #1
Retailer Shelf Arrangements
[0121]Product salespersons often use 3-D visualizations to sell retailers on shelf arrangements, end displays and new promotions. With the pipeline 201, the salesperson will be able to do what-ifs on the spot. Given some product placements and given a minimum daily sales / linear foot threshold, the salesperson may calculate and visualize the minimum required stock at hand. Conversely, given some stock at hand and given a bi-weekly replenishment cycle, the salesperson might calculate product placements that will give the desired sales / linear foot. The retailer will be able to visualize the impact, compare scenarios, and compare profits. FIG. 12 illustrates an example retailer shelf arrangement visualization. The input data might include visual images of the product, a number of the product, a linear square footage allocated for each product, and shelf number for each product, and so forth.
example # 2
ADDITIONAL EXAMPLE #2
[0122]Urban planning mash ups are becoming prominent. Using the principles described herein, analytics can get integrated into such solutions. A city planner will open a traffic model created by experts, and drag a bridge in from a gallery of road improvements. The bridge will bring with it analytical behavior like length constraints and high-wind operating limits. Via appropriate visualizations, the planner will see and compare the effect on traffic of different bridge types and placements. The principles described herein may be applied to any map scenarios where the map might be for a wide variety of purposes. The map might be for understanding the features of a terrain and finding directions to some location. The map might also be a visual backdrop for comparing regionalized data. More recently, maps are being used to create virtual worlds in which buildings, interiors and arbitrary 2-D or 3-D objects can be overlaid or positioned in the map. FI...
example # 3
ADDITIONAL EXAMPLE #3
Visual Education
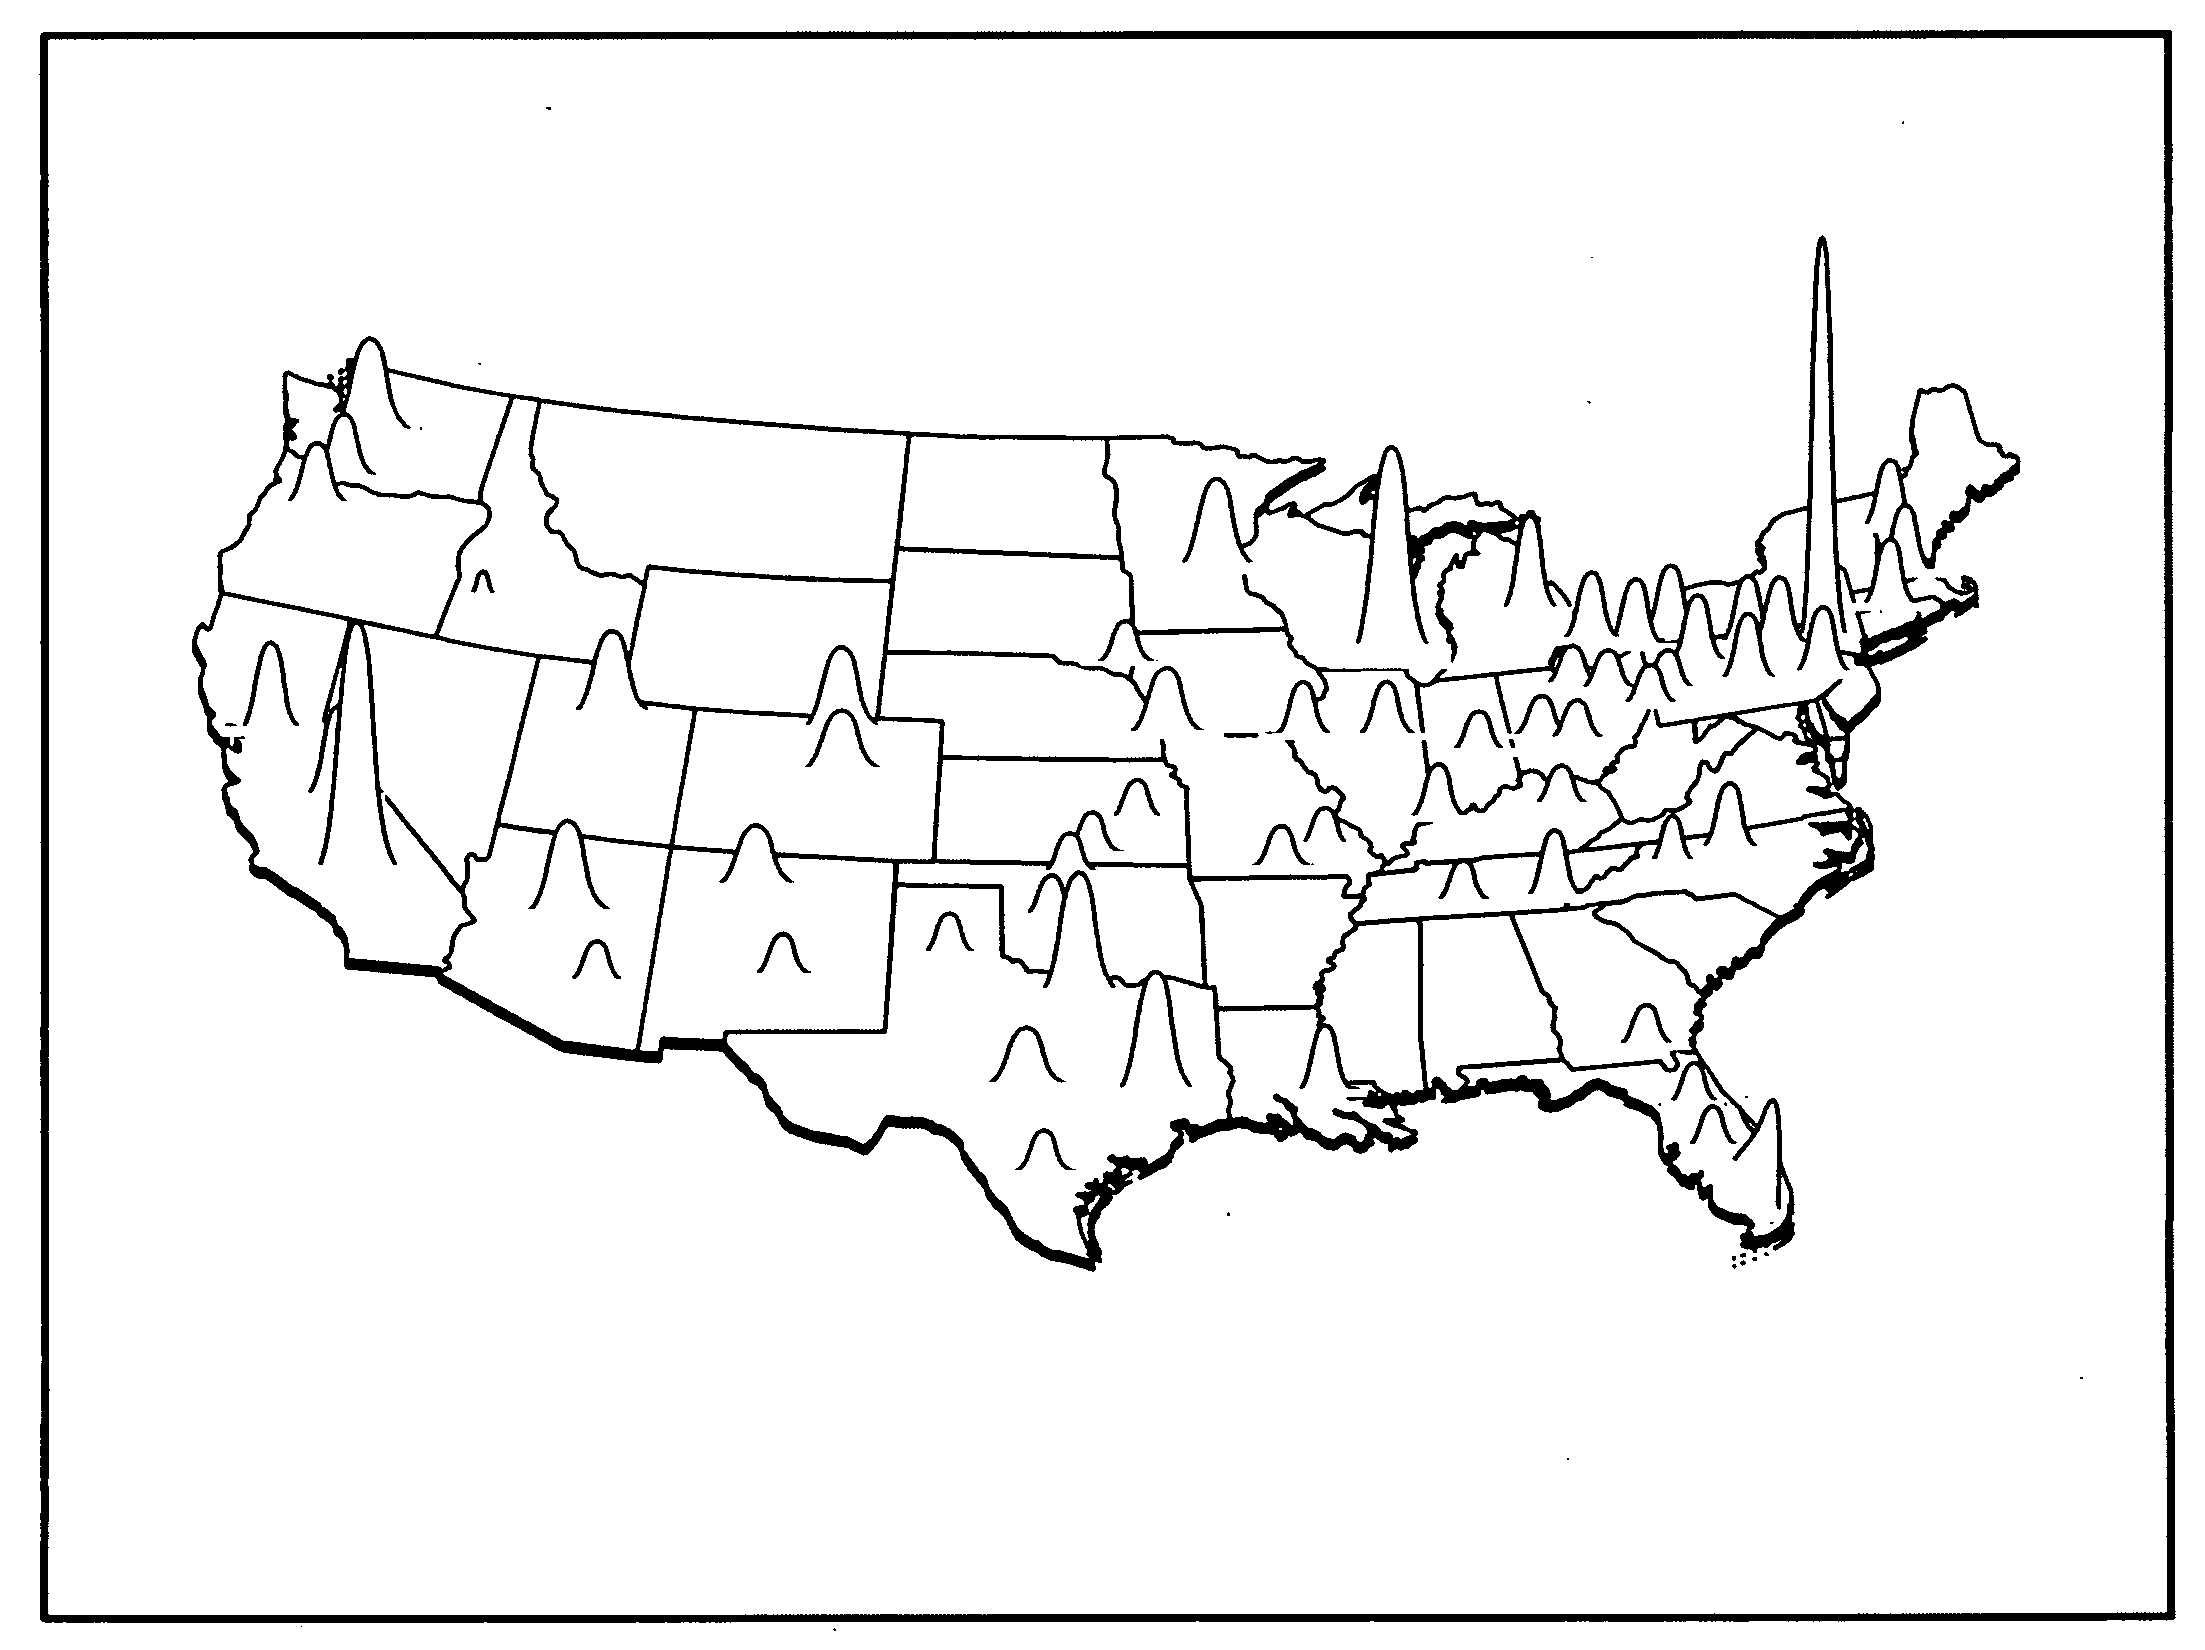
[0123]In domains like science, medicine, and demographics where complex data needs to be understood not just by domain practitioners but also the public, authors can used the principles described herein to create data visualizations that intrigue and engage the mass audience. They will use domain-specific metaphors, and impart the authors' sense of style. FIG. 14 is an illustration about children's education. FIG. 15 is a conventional illustration about population density. Conventionally, such visualizations are just static illustrations. With the principles described herein, these can become live, interactive experiences. For instance, by inputting a geographically distributed growth pattern as input data, a user might see the population peaks change. Some visualizations, where the authored model supports this, will let users do what-ifs. That is, the author may change some values and see the effect on that change on other values.
[0124]According...
PUM
 Abstract
Description
Claims
Application Information
 - R&D
- Intellectual Property
- Life Sciences
- Materials
- Tech Scout
- Unparalleled Data Quality
- Higher Quality Content
- 60% Fewer Hallucinations
Browse by: Latest US Patents, China's latest patents, Technical Efficacy Thesaurus, Application Domain, Technology Topic, Popular Technical Reports.
© 2025 PatSnap. All rights reserved.Legal|Privacy policy|Modern Slavery Act Transparency Statement|Sitemap|About US| Contact US: help@patsnap.com


