Method for providing protein microarrays

a protein microarray and protein technology, applied in the field of biomolecular analysis and biotechnology products, can solve the problems of poor side effect profiles of currently available drugs, side effects, and inability to use intended effects,

Inactive Publication Date: 2010-05-13
LIFE TECH CORP
View PDF0 Cites 1 Cited by
  • Summary
  • Abstract
  • Description
  • Claims
  • Application Information

AI Technical Summary

Benefits of technology

[0161]Each target protein and control protein is usually spotted in more than one spot to provide further statistical confidence in values obtained. In certain example, concentration is determined for a plurality of target proteins, for example at least 100, 200, 250, 500, 750, 1000, 2000, 2500, 5000, 10,000, 20,000, 25,000, 50,000 or 100,1000 target proteins. Each of the target proteins is typically immobilized on the same microarray, but can also be immobilized on a series of microarrays. For example, concentration can be determined for between 10 an 1,000,000 proteins, between 50 and 100,000 proteins, between 100 and 20,000 or between 250 and 10,000. Therefore, an advantage of the present invention is that large numbers of proteins can be analyzed in the same experiment using the same standard curve.
[0162]In methods provided herein, the concentration is typically determined using a cubic curve fitting method having the following formula:Y=a*X3+b*X2+c*X
[0163]Where X is the spot relative intensity and the Y is the spot protein concentration. The fitting formula is used to calculate all other proteome spots in the slides. Open source software Polyfit is applied for this curve fitting purpose. In order to get a designed polynomial like Y=a*X3+b*X2+c*X+d with d=0, instead of using Polyfit the usual way, we create a new function Y′=Y / X=a*X2+b*X+c, using Polyfit for 2nd order, we get coefficients a, b, c, then use this a, c, b for the 3-rd order polynomial
[0164]Because the protein concentration of the control spots is known and the intensity can be obtained from the uploaded result file, a fitting curve can be created and the correspondent fitting formula based on the control spots' intensity and concentration. The cubic curve fitting method is applied.
[0165]The tag on the tagged control can be an affinity purification tag as discussed in further detail herein. The affinity purification tag can be, for example, glutathione S-transferase. In certain aspects, the present invention provides a microarray comprising a plurality of concentration series of tagged control proteins, wherein at least two of the series comprise different tags. Accordingly, another aspect of the invention is a microarray with a plurality of concentration series of tagged control proteins. A concentration series is a series of protein spots of different known concentrations used to construct a standard curve and associated formula for determining a concentration of an unknown protein. For example, a microarray can include 1, 2, 3, 4, 5, 6, 7, 8, 9, 10, 15, 20, or 25 separate concentration series, and although each tagged protein of a series typically includes the same tag, tagged control proteins of different series can include different tags. Therefore, a microarray with multiple concentration series can be sold to a customer for use in determining protein concentrations for proteins that are tagged with any tag represented in a series that is attached to a target protein. In other words, a microarray with multiple concentration series with different tags provides a robust tool that can be used to determine concentration of a target protein for many different tags.
[0166]In certain embodiments of the present invention, the concentration of a protein on an array refers to the concentration of the protein in solution when the protein was initially deposited on the array. Therefore, although the contacting and detecting are performed when the target protein is immobilized, the concentration of the target protein in solution is determined using the standard curve.

Problems solved by technology

Many currently available drugs were designed without the benefit of using the intended druggable targets and structurally-related proteins, and show undesirable, or sometimes unacceptable, side effects.
It is generally believed that the poor side effect profiles of currently available drugs often stem from the interaction of these drugs with (sometimes multiple) family members of the target molecule.
As a consequence, a non-specific drug intended to exert its effects on one physiological function may in fact influence other physiological functions, thereby causing undesirable side effects.

Method used


Image

  • Method for providing protein microarrays
  • Method for providing protein microarrays
  • Method for providing protein microarrays

Examples


example 1

Yeast Protoarray PPI Kit

[0310]The Yeast ProtoArray™ PPI (Protein-Protein Interaction) Kit is shipped as detailed below. Upon receipt, store as indicated. For details on each component, see below.

[0311]All kit components are stable for 6 months when stored properly.

Kit ContentsShippingStorageYeast ProtoArray ™ PPI Proteome MicroarrayBlue ice−20° C.Yeast ProtoArray ™ PPI Control MicroarrayBlue ice−20° C.ProtoArray ™ Buffers Module ADry ice−20° C.ProtoArray ™ Buffers Module BBlue ice 4° C.ProtoArray ™ Mini-Biotinylation ModuleDry ice−20° C.ProtoArray ™ Biotinylation Purification ModuleBlue ice 4° C.ProtoArray ™ Biotinylation Assessment ModuleBlue ice 4° C.

[0312]Yeast ProtoArray™ PPI Proteome Microarray Box contains a mailer with PPI Microarrays 2 yeast proteome microarrays and Yeast ProtoArray™ PPI Control Microarray Box contains a mailer with 2 control microarrays.

[0313]The following components are included in the ProtoArray™ Buffers Module A.

[0314]Sufficient Buffers are included to p...

example

[0410]If the protein concentration of your sample after column purification is 0.5 mg / ml and the MW of your protein is 50,000 Da, calculate the final volume as follows:

5×106×0.550000=50µl

[0411]Dilute 1 μl of each sample for this example with 49 μl 1× Dilution Buffer to generate a 200 fmoles / μl stock solution for each sample.

[0412]Prepare the following dilutions of the biotinylated protein sample and BSA Control Protein after column purification for assessing biotinylation.[0413]1. Prepare a 200 fmoles / μl stock solution for each sample using the formula for SDS-PAGE described above.[0414]2. From the 200 fmoles / μl stock solution for each sample, prepare the following dilutions:[0415]Dilute 1 μl of 200 fmoles / μl solution from each sample with 9 μl with 1× Dilution Buffer to generate the 20 fmoles / μl sample (total volume is 10 μl).[0416]Dilute 2 μl of 20 fmoles / μl solution from each sample with 6 μl with 1× Dilution Buffer to generate the 5 fmoles / μl sample (total volume is[0417]3. Prep...

example 2

Method for Predicting a Biological Pathway

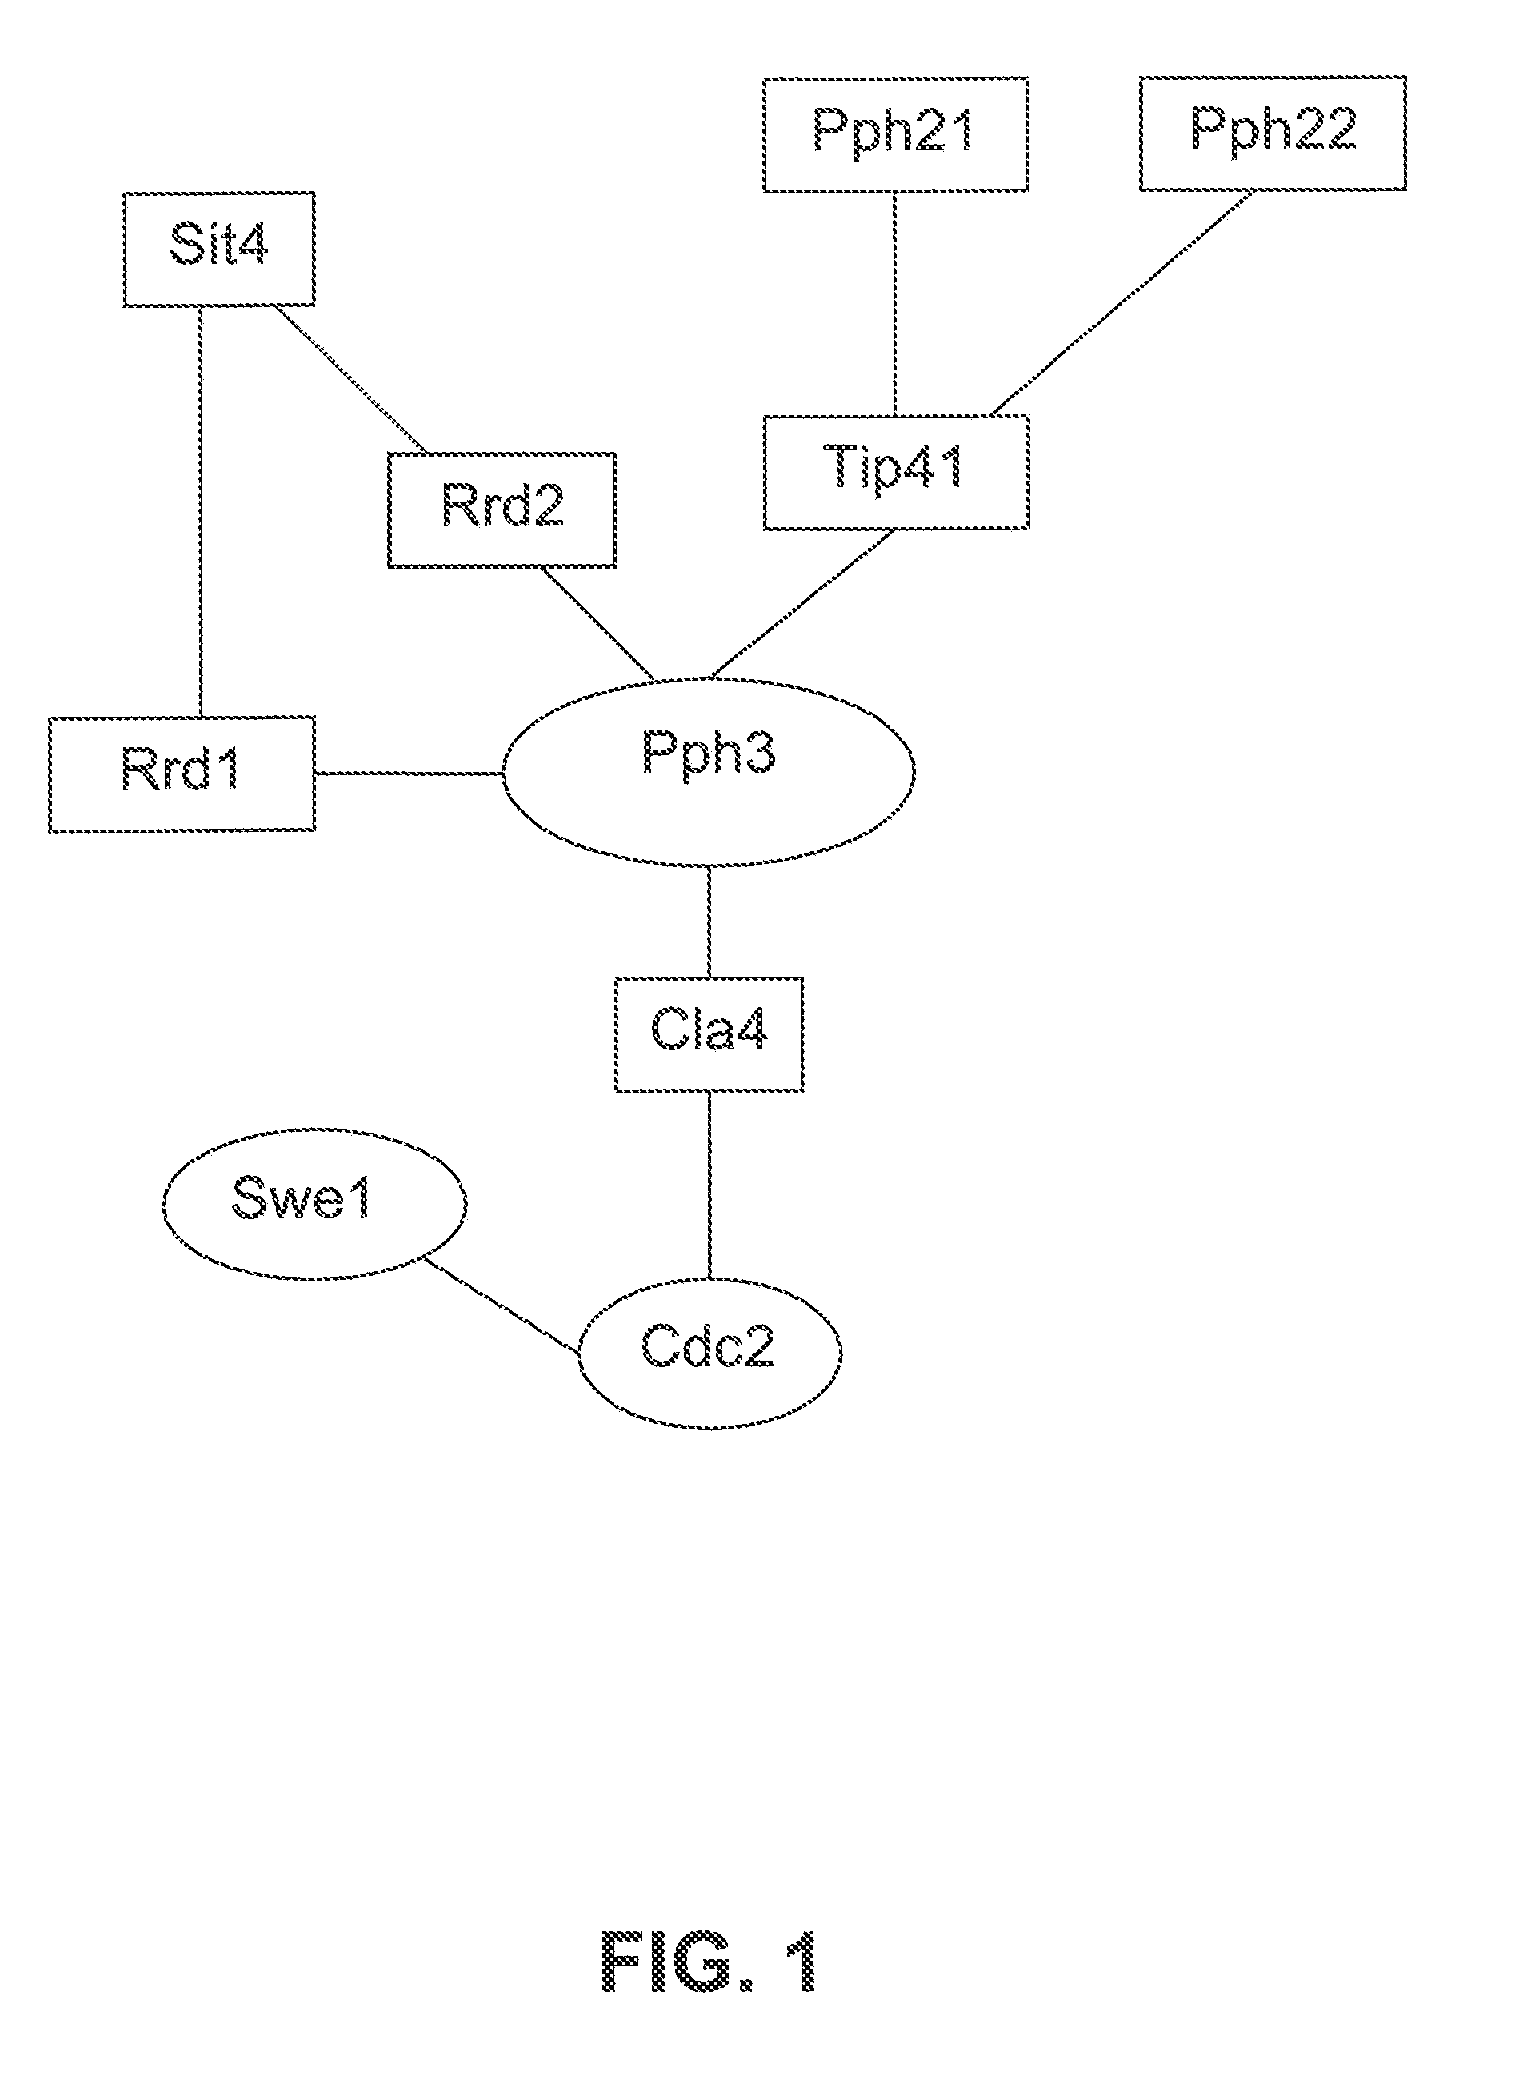
[0596]The following example illustrates the use of protein array data in combination with biological pathway knowledge and other data types, to generate biological pathway diagrams that indicate a predicted role of a test protein in a biological pathway. A protein array containing the majority of proteins from the yeast S. cerevisae was probed with a yeast protein phosphatase (Pph3). Two notable interactions were observed on the array. One interactor was identified as Tip41, a protein known to associate with Pph3 and a second interactor was identified as Rrd1 (Ito, T., et al., A comprehensive two-hybrid analysis to explore the yeast protein interactome. Proc Natl Acad Sci USA, 2001. 98(8): p. 4569-74). The function of Rrd1 is unknown but has been predicted to be a regulator of Pph3 because Pph3 overexpression can suppress the synthetic lethal phenotype of a rrd1,rrd2 double mutant (Rempola, B., et al., Functional analysis of RRD1 (YIL153w) a...


PUM

PropertyMeasurementUnit
molar ratioaaaaaaaaaa
temperatureaaaaaaaaaa

Abstract

The present application relates to methods for providing a protein microarray product and related products and services to a customer, methods, kits, and systems for labeling a probe for a protein microarray, and methods for determining protein concentrations using a protein microarray. The methods for providing a protein microarray can include, in certain aspects, a computer function for performing some of the steps of the methods. Methods and kits for labeling a probe can include a control array that includes a molecule that binds to a label of a probe.

Description

RELATED APPLICATIONS[0001]The present application claims benefit under 35 U.S.C. §119(e) of U.S. patent application Nos. 60 / 588,158 filed Jul. 14, 2004, 60 / 591,541 filed Jul. 26, 2004, 60 / 591,827 filed Jul. 27, 2004 60 / 592,239 filed Jul. 28, 2004 and 60 / 653,586 filed Feb. 15, 2005, all of which are incorporated herein by reference in their entireties.FIELD OF THE INVENTION[0002]The present invention relates to biomolecular analysis and biotechnology products, and more particularly to biomolecular analysis and biotechnology products related to biomolecular arrays.BACKGROUND OF THE INVENTION[0003]Many currently available drugs were designed without the benefit of using the intended druggable targets and structurally-related proteins, and show undesirable, or sometimes unacceptable, side effects. It is generally believed that the poor side effect profiles of currently available drugs often stem from the interaction of these drugs with (sometimes multiple) family members of the target m...

Claims


Application Information

Patent Timeline
Patent Type & Authority Applications(United States)
IPC IPC(8): G06Q50/00C40B40/10G06Q30/00G06F3/048G06K9/00G16B25/00G16B50/00
CPCG01N33/6842G01N33/6845G06Q30/0601G06F19/28G06Q10/103G06F19/20G16B25/00G16B50/00
Inventor PREDKI, PAUL F.SCHWEITZER, BARRY
Owner LIFE TECH CORP
Why Eureka
Try Eureka