

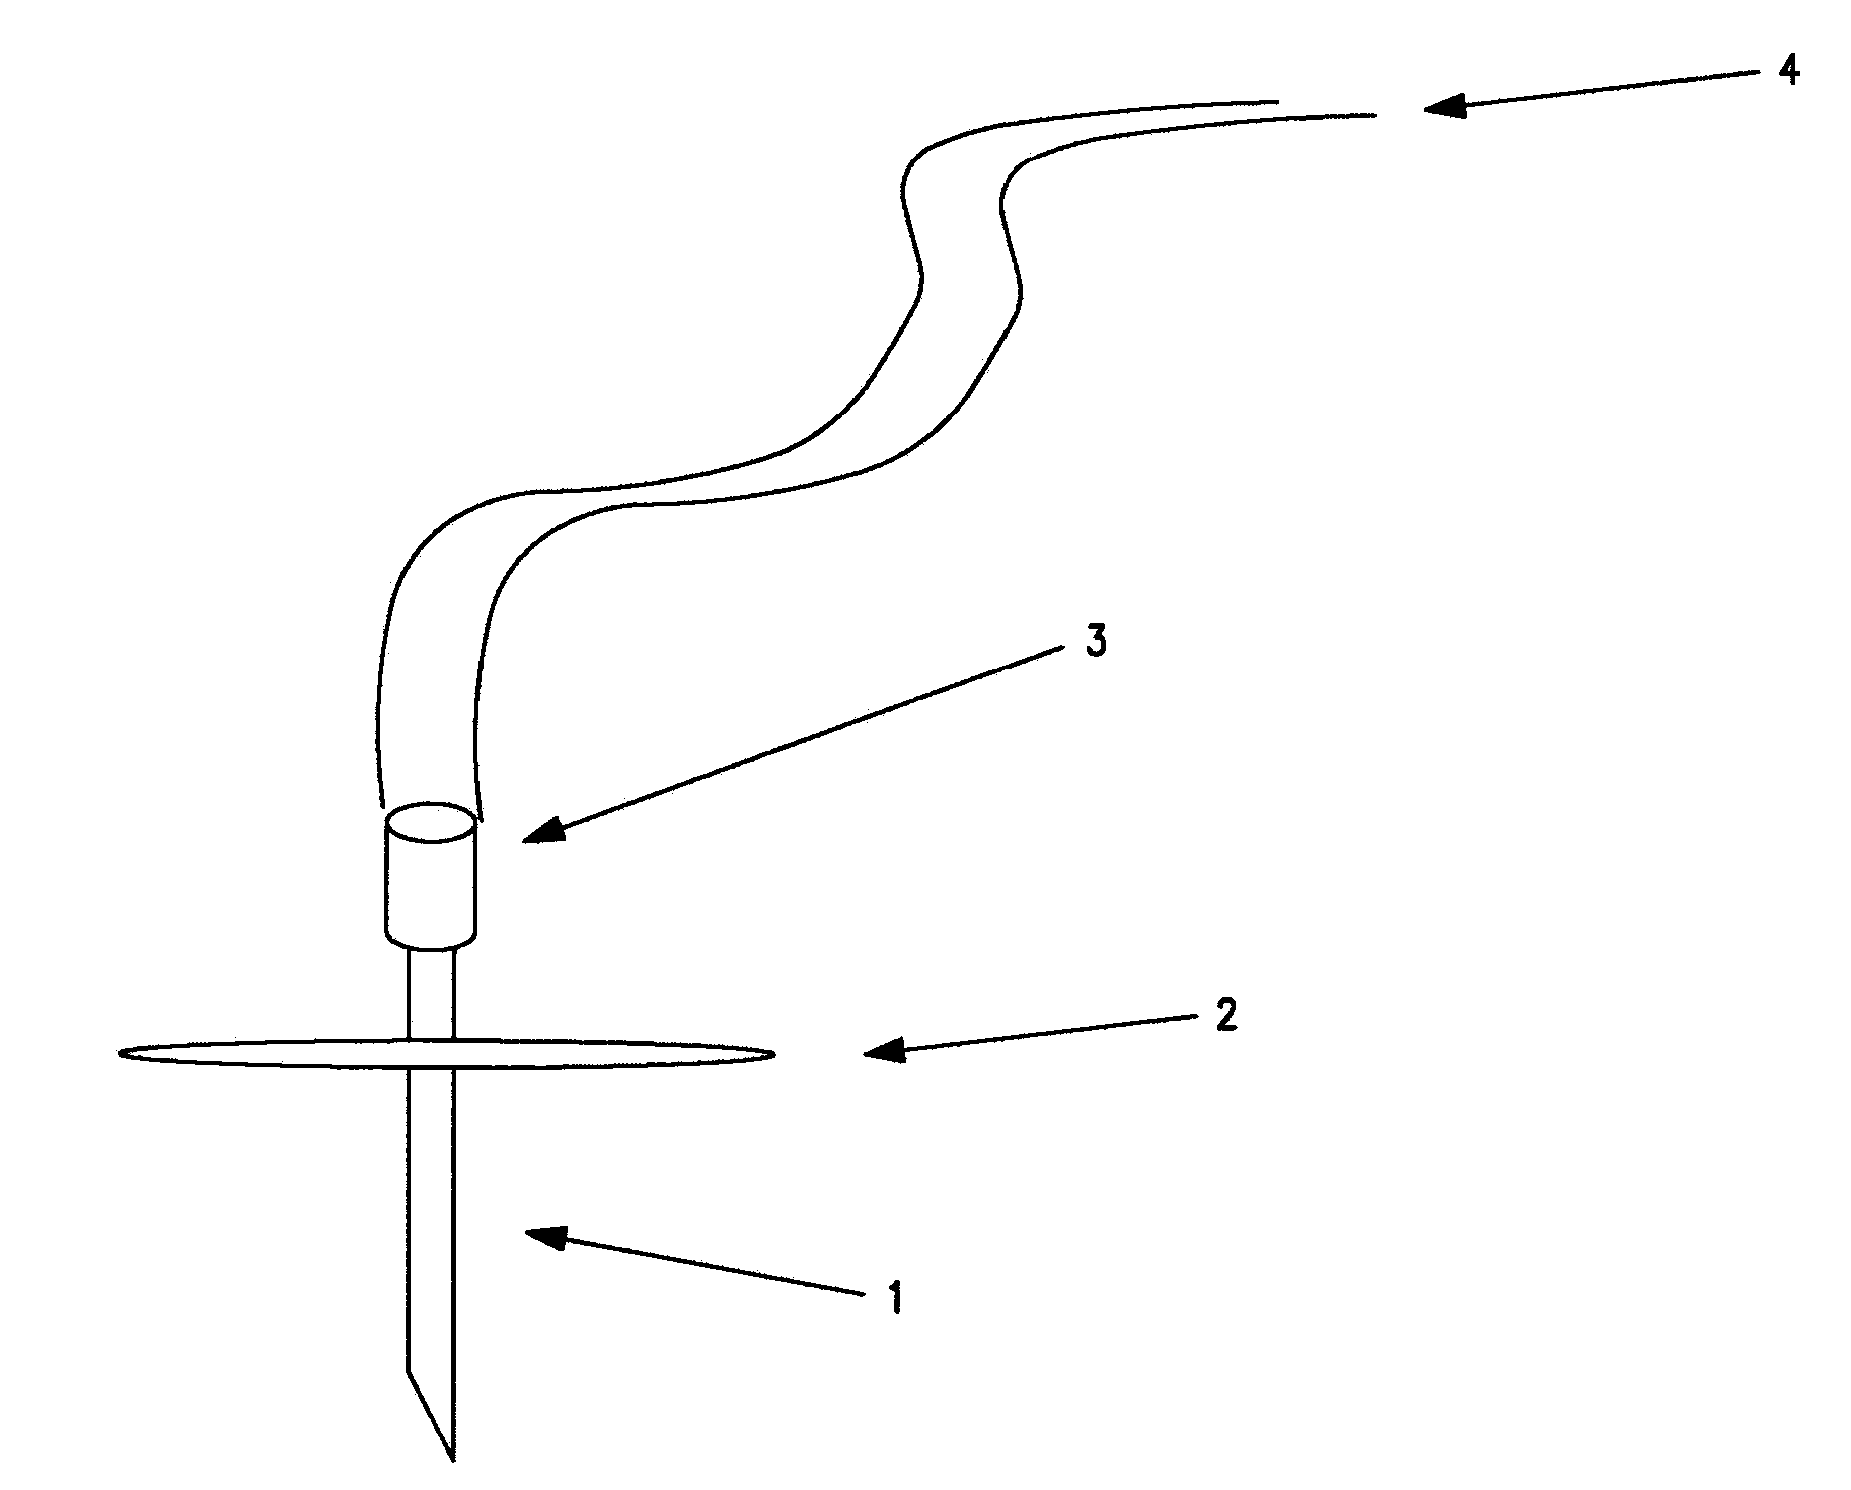
Device and Methods for Subcutaneous Delivery of High Viscosity Fluids
- Summary
- Abstract
- Description
- Claims
- Application Information
AI Technical Summary
Benefits of technology
Problems solved by technology
Method used
Image

Examples
example 1
Flow Analysis of Infusion Sets
[0056]This example illustrates flow rate characteristics for a variety of infusion set designs.
[0057]To conduct flow rate analysis of various infusion set configurations a system as shown in FIG. 3 was utilized. A mechanically driven syringe pump was coupled to a pressure sensor via tubing of varying lengths and inner diameters. To measure the inline high pressure an analog pressure gauge was disposed between the pressure sensor and a collection beaker. The inline low pressure was measured using a transducer coupled to the pressure sensor and interpreted by a computer.
[0058]Test regents utilized in the experiments included sterile water, 10%, 15%, 20% human IgG (Carimune M) solutions, and 10% and 20% human IgG (GammaGard™) solutions. Human IgG was incorporated into the test solutions to confer viscosity to the solution.
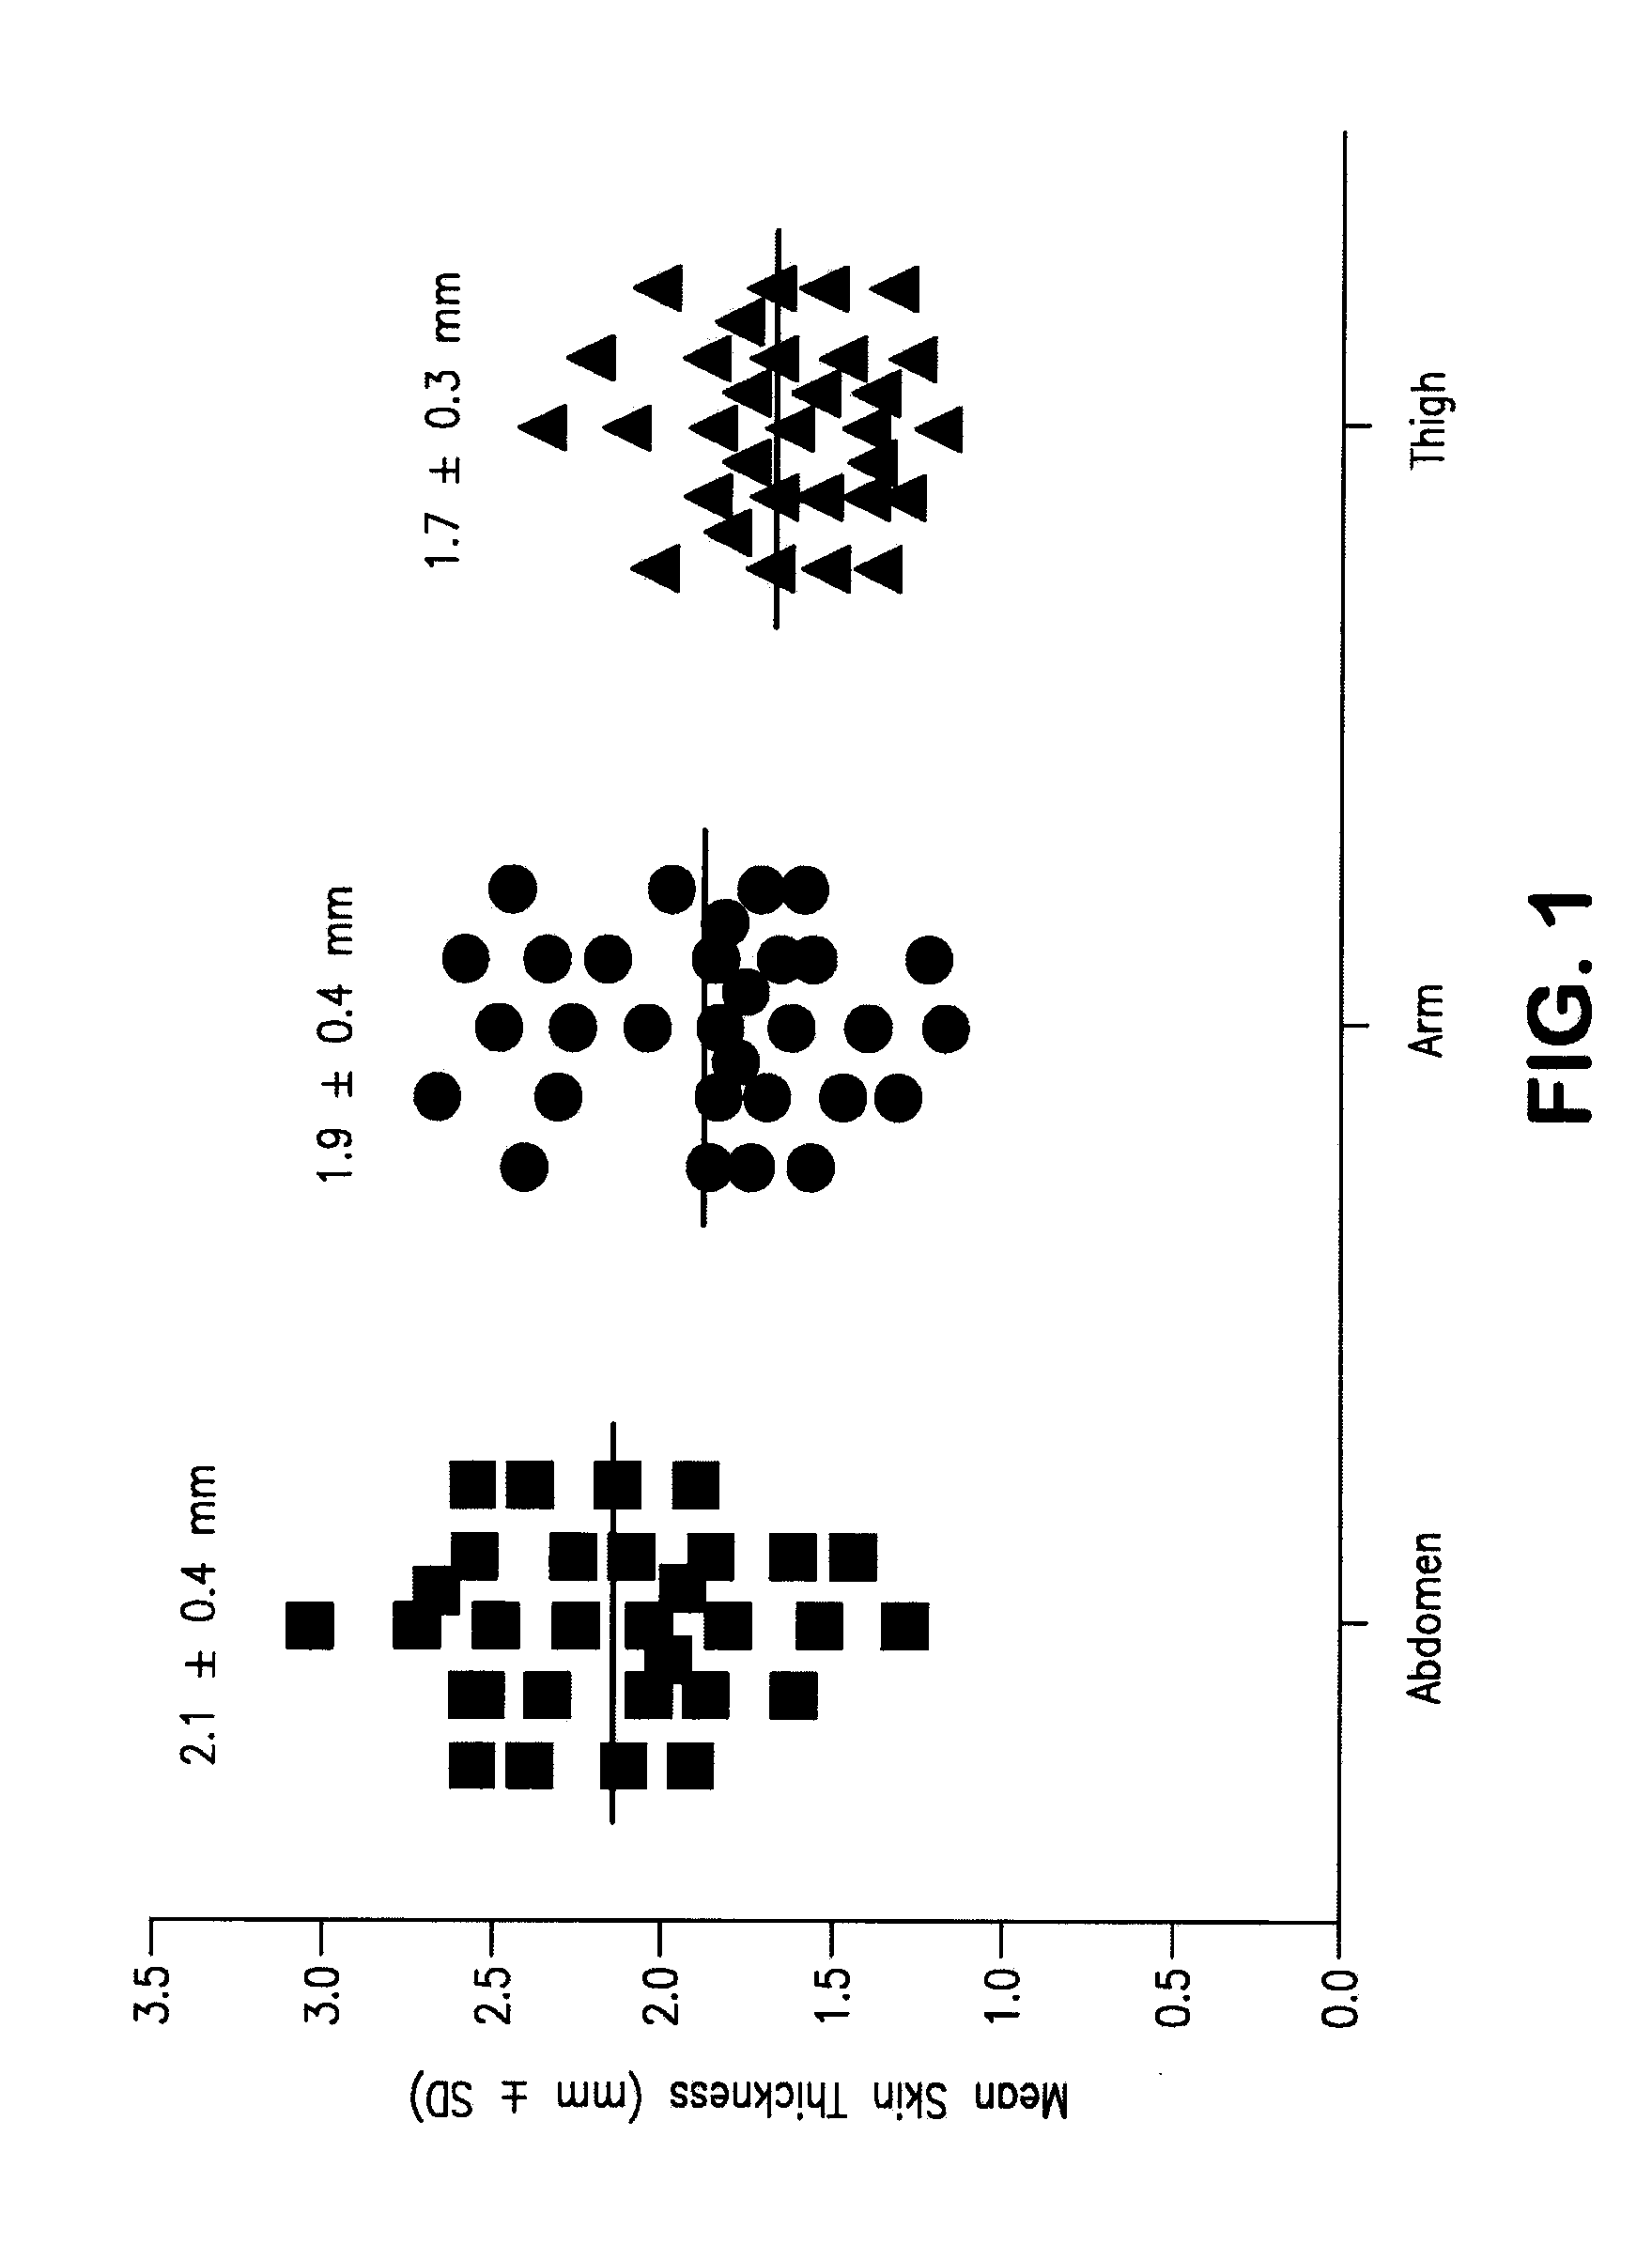
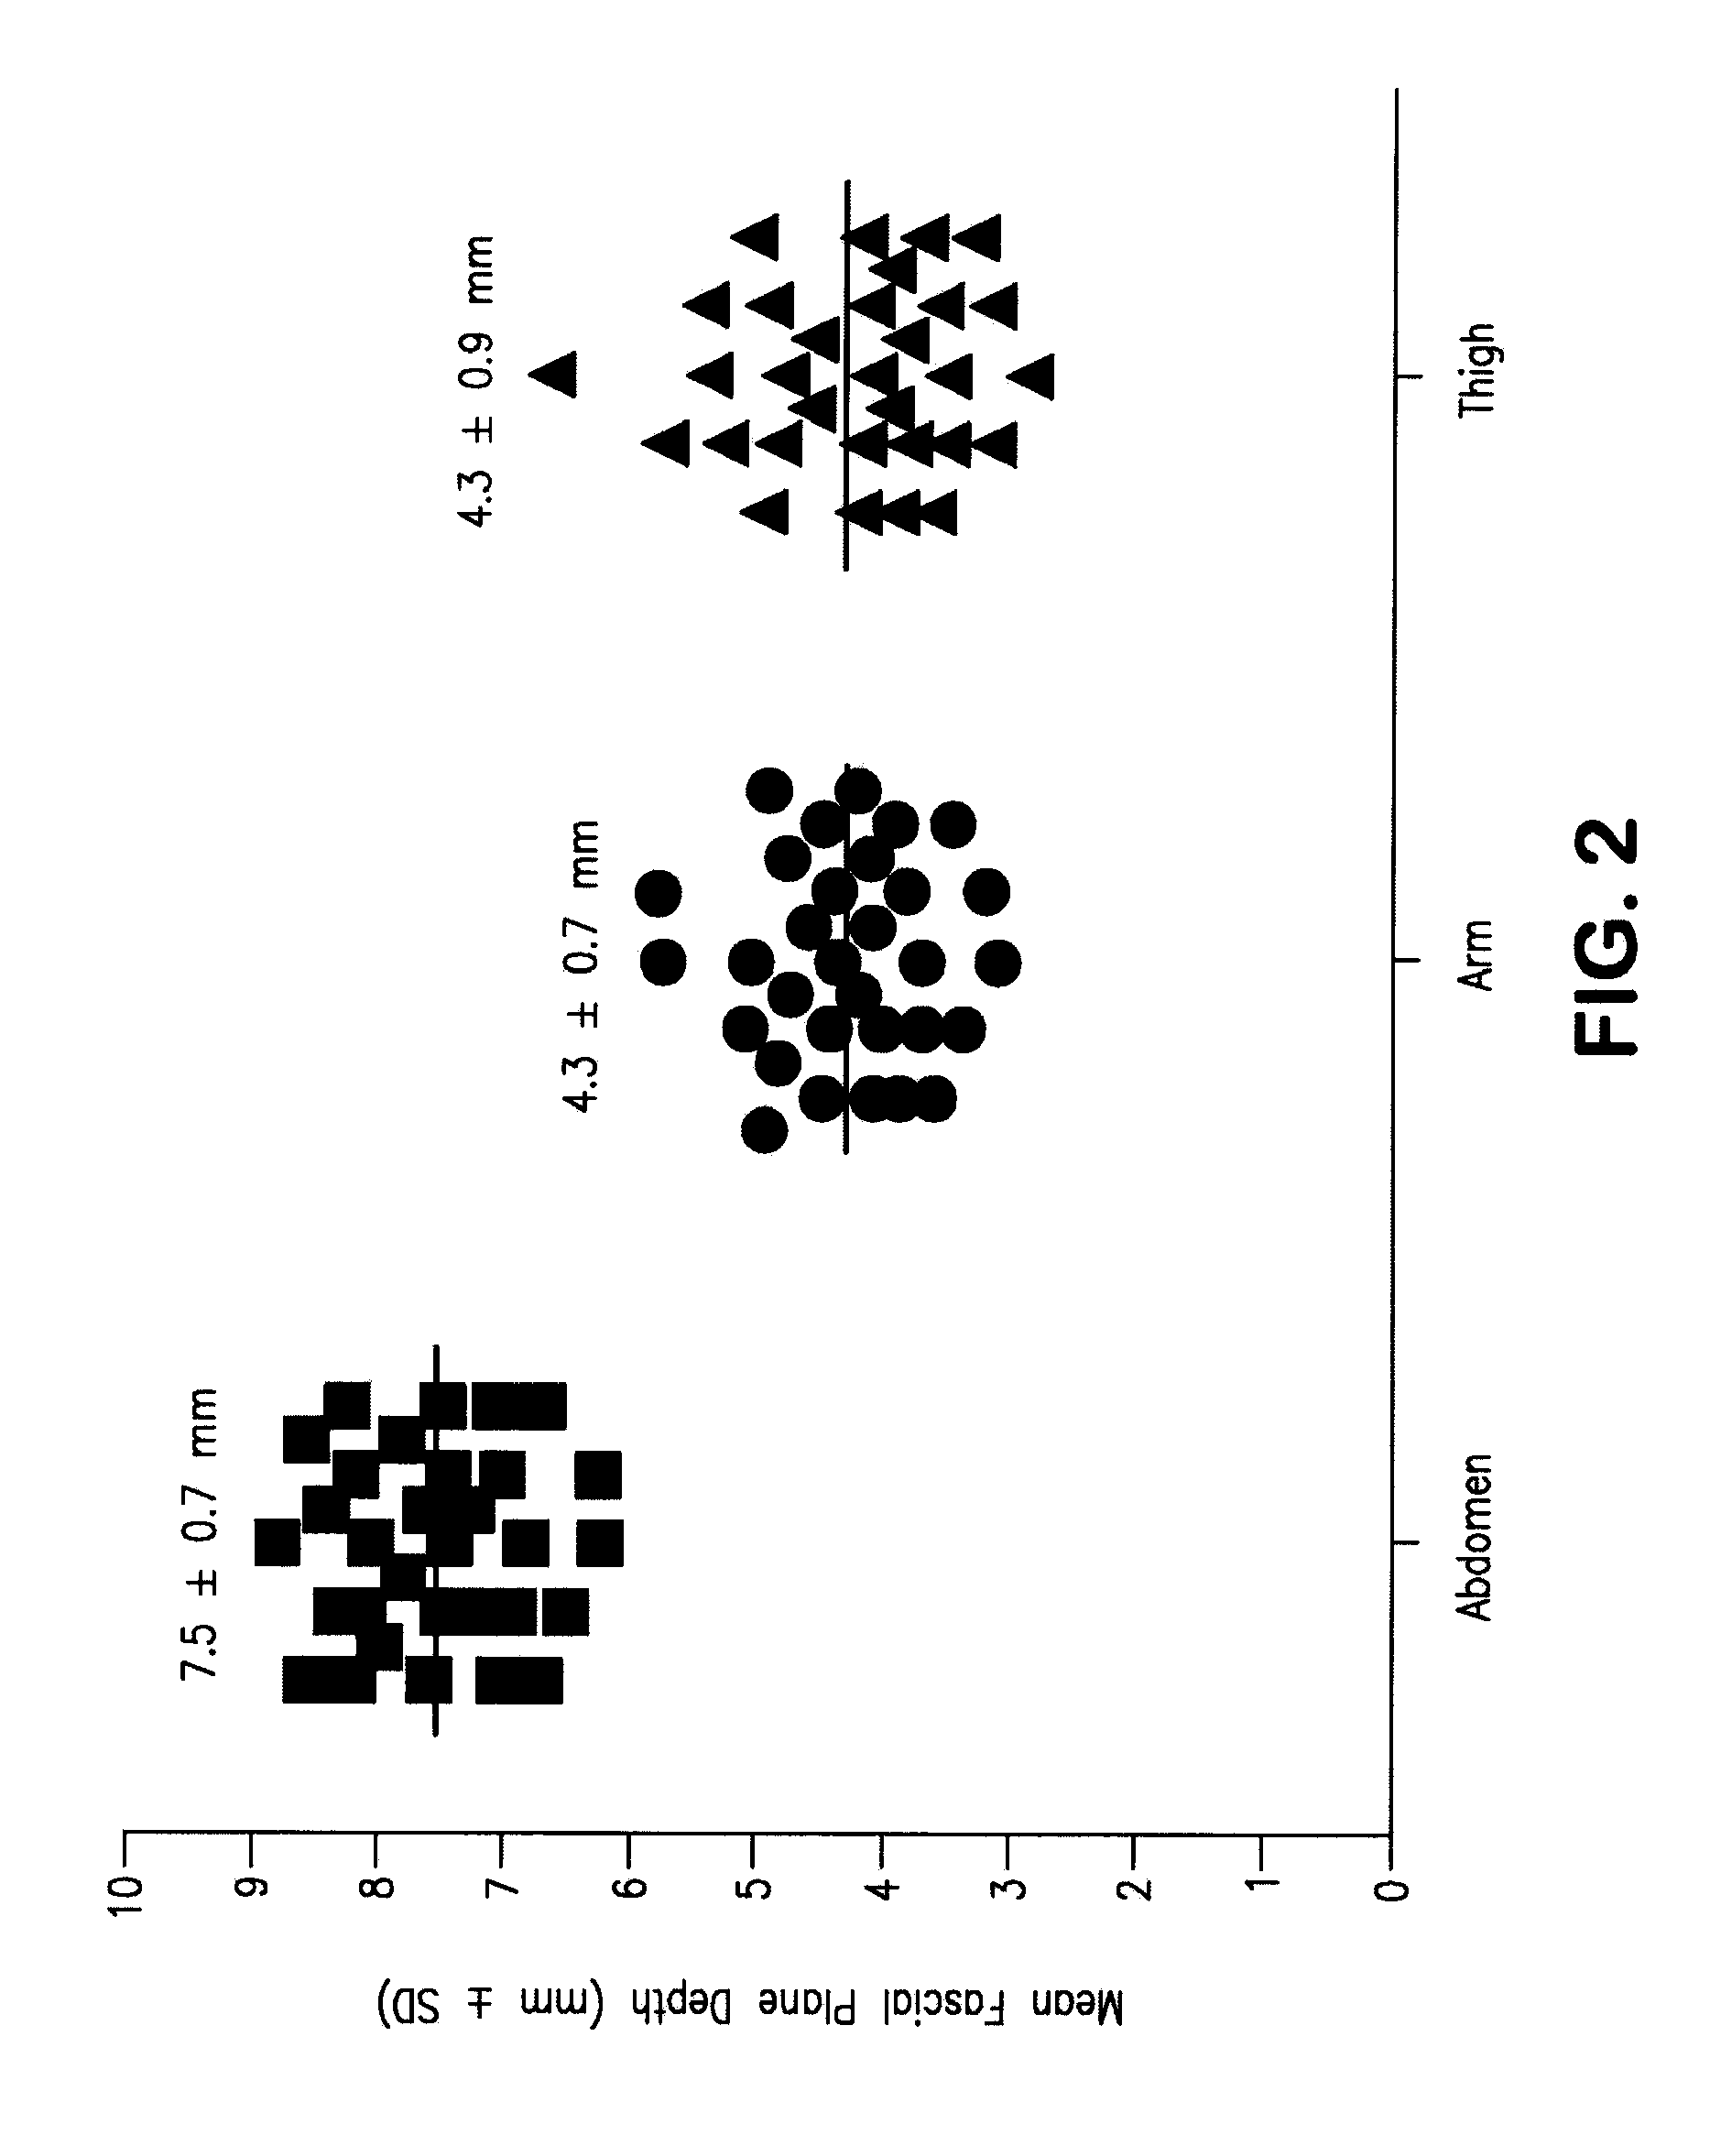
[0059]The critical parameters for infusion set design to achieve the desired flow rates and inline parameters were determined. As shown...
example 2
Flow Analysis of Infusion Sets
[0060]This example illustrates flow rate characteristics for a variety of infusion set designs. The experiment was carried out using the same methods as described in Example 1 utilizing infusion sets with the features as presented in Table 15.
TABLE 15Analysis of Custom Designed Infusion SetsTubingTubingInnerInfusionNeedle GaugeNeedle LengthLengthDiameterNeedleSet(Ga)(mm)(in)(mm)ShapeA*271381-1.2StraightB*251381-1.2StraightC276101SoftCurveD276101StraightE256101SoftCurveF256101StraightG246101SoftCurveH246101Straight*Denotes non-custom infusion sets used for reference.
[0061]The results of flow analysis using different percentages of human IgG (Carimune™) solution at two different flow rates using the infusion set designs presented in Table 14 are shown in FIGS. 6 and 7.
[0062]FIG. 6 is a graphical representation of inline pressures generated by the various infusion sets represented in Table 15. Solutions containing different percentages of human IgG (Carim...
PUM
 Abstract
Description
Claims
Application Information