Data mining model interpretation, optimization, and customization using statistical techniques
a data mining model and statistical technique technology, applied in the field of system and method for interpreting, optimizing, and customizing data mining models, can solve the problems of high-cost or high-value decision may require rigorous data mining interpretation, and no solution exists to address all three of these problems, so as to improve the quality, robustness and reliability of data mining results, and facilitate the interpretation of data mining results for analysts. , the effect of high degree of statistical expertis
- Summary
- Abstract
- Description
- Claims
- Application Information
AI Technical Summary
Benefits of technology
Problems solved by technology
Method used
Image
Examples
example 1
Statistical Significance of Data Groups Discovered by Data Mining Algorithms
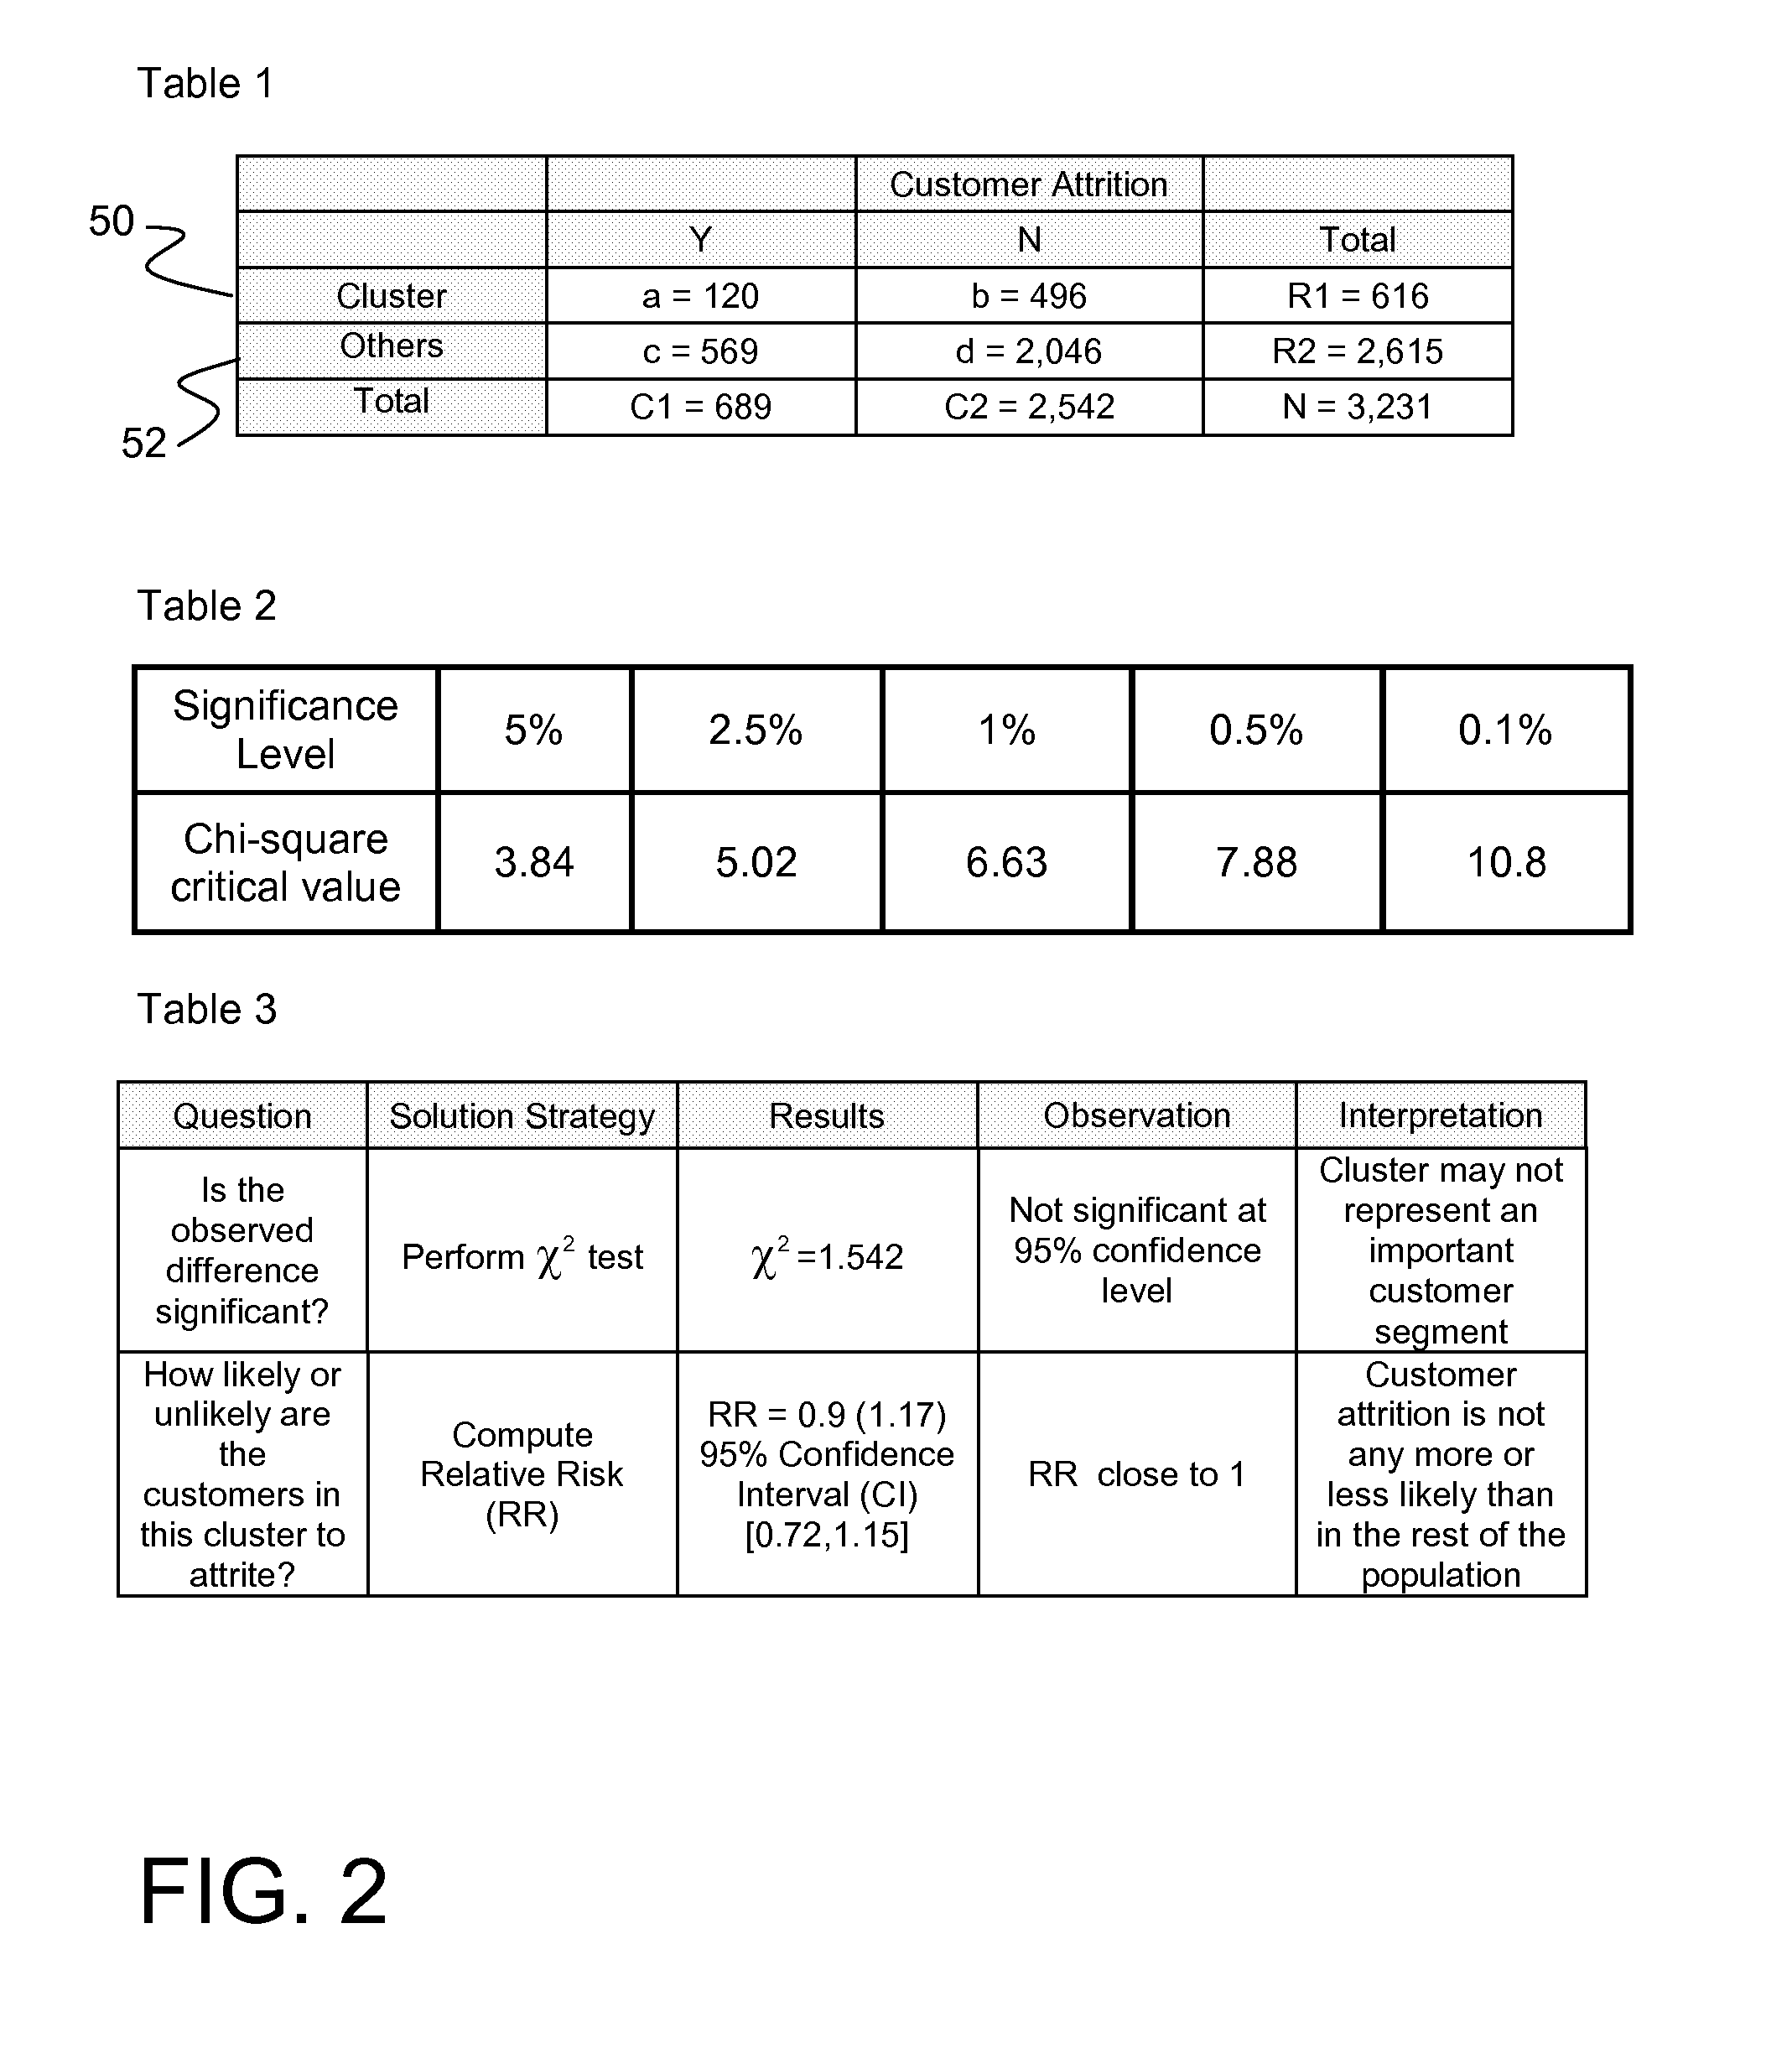
[0027]One of the major tasks in data mining is clustering or partitioning of the data into data groups, i.e., subsets or clusters, with members of each group sharing similar characteristics. Interpreting the results of the clustering task may be difficult in terms of assessing how different a given cluster is from all other entities (e.g., records) or from another cluster. A classification model also may construct groups, although classification algorithms operate differently and for different purposes than do clustering algorithms. Data groups can also be constructed using other algorithms, e.g., regression models (e.g., rank and divide records into groups by deciles, quartiles, etc.) or query (e.g., construct groups meeting a set of specific criteria or attributes).
[0028]However the data groups are constructed, one of the challenges in interpreting the data mining results is to determine whether the partit...
example 2
Significance Testing for Evaluating Classification Results
[0041]Predictive modeling is another major task in data mining. In this second example, the test results for a decision tree model of credit card attrition are presented as a confusion matrix in FIG. 5, table 5. The confusion matrix shows how well the model performed in predicting the actual attrition status of the customers in the test dataset.
[0042]Performing a chi-square test results in a computed chi-square value of 75, the results are highly significant even at a 99.9% confidence level. In addition to statistical significance of the results, diagnostic measures such as sensitivity, specificity, accuracy, odds ratio, positive and negative predictive values can be computed. These diagnostic measures are of great practical value and in fields such as medical diagnostics reporting them along with the test results is mandatory.
[0043]The computed diagnostic measures shown in FIG. 5, table 7 give insight and a rigorous basis to...
PUM
 Abstract
Description
Claims
Application Information
 - R&D
- Intellectual Property
- Life Sciences
- Materials
- Tech Scout
- Unparalleled Data Quality
- Higher Quality Content
- 60% Fewer Hallucinations
Browse by: Latest US Patents, China's latest patents, Technical Efficacy Thesaurus, Application Domain, Technology Topic, Popular Technical Reports.
© 2025 PatSnap. All rights reserved.Legal|Privacy policy|Modern Slavery Act Transparency Statement|Sitemap|About US| Contact US: help@patsnap.com


