System and method for characterizing fractures in a subsurface reservoir

a subsurface reservoir and fracture technology, applied in seismology for waterlogging, borehole/well accessories, instruments, etc., can solve the problems of large amount of effort, significant affecting well productivity and recovery efficiency, and unique and specialized challenges, so as to optimize fracture properties

Active Publication Date: 2010-09-30
CHEVROU USA INC
View PDF19 Cites 85 Cited by
  • Summary
  • Abstract
  • Description
  • Claims
  • Application Information

AI Technical Summary

Benefits of technology

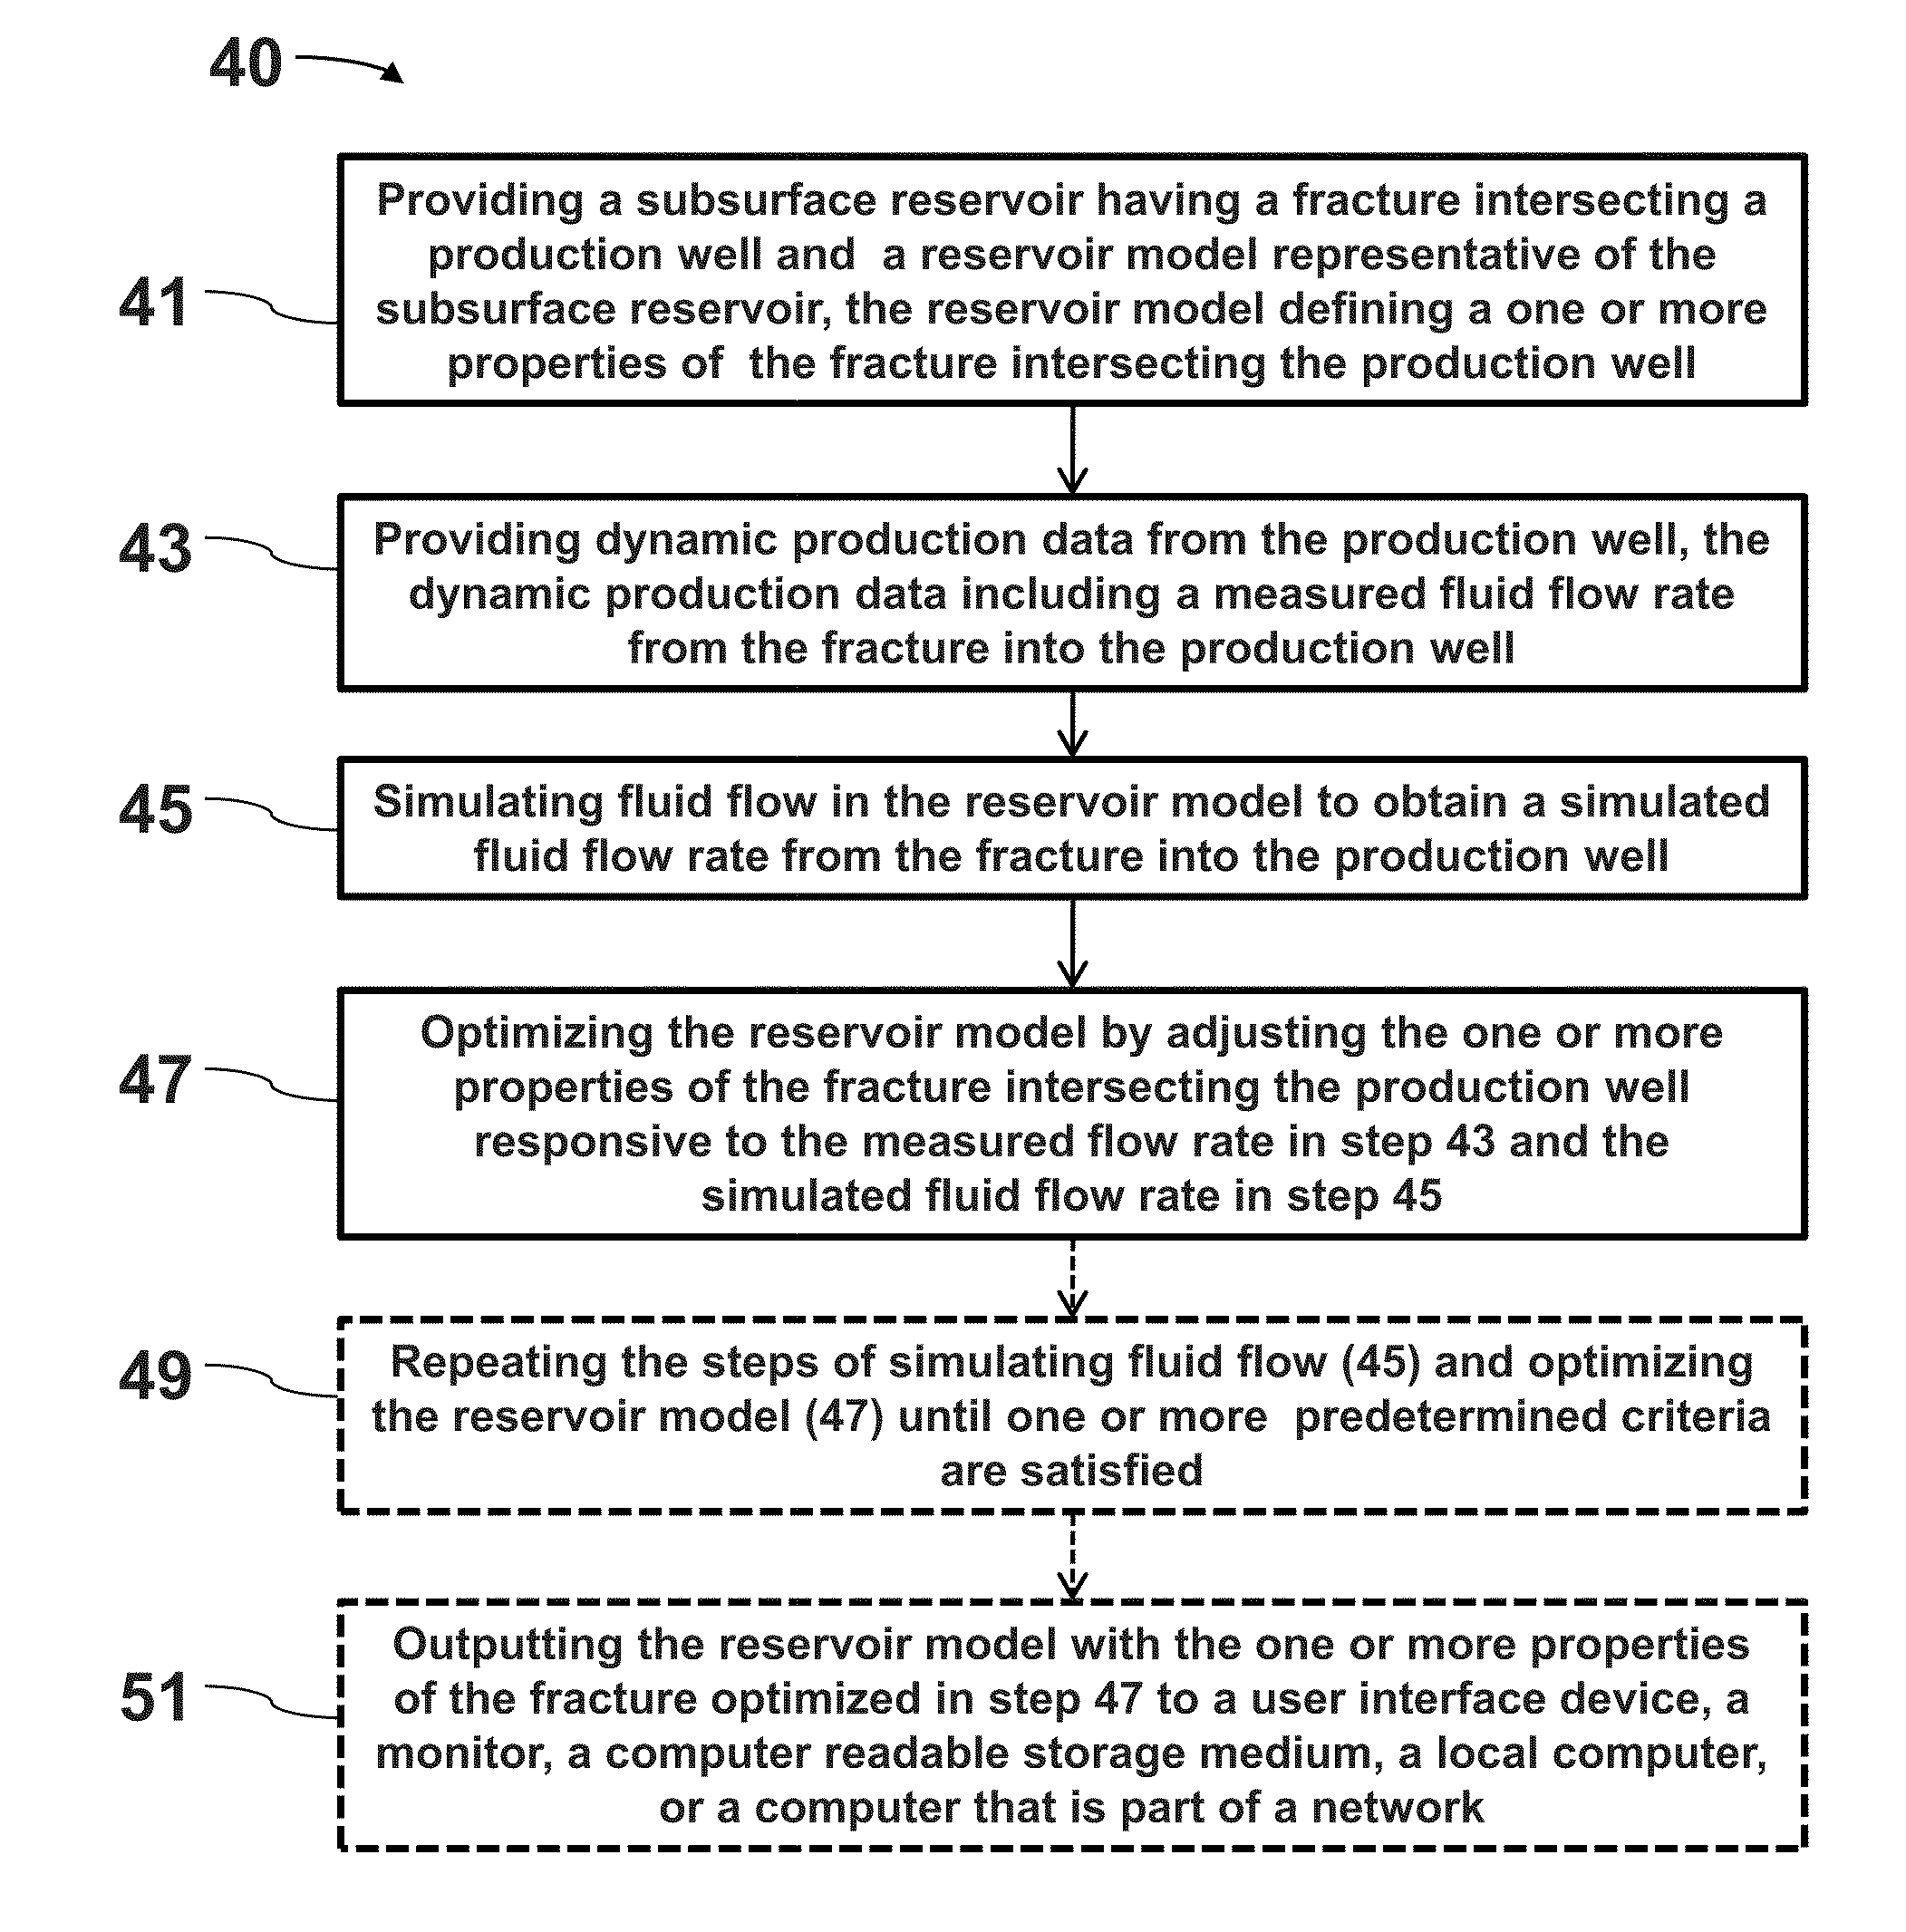
[0011]According to an aspect of the present invention, a method is disclosed for simulating fluid flow rates in a subsurface reservoir. The method includes the step of providing static and dynamic data for a production well in a subsurface reservoir that intersects at least one fracture. The dynamic data includes measured fluid flow rates from the fracture or fractures into the production well. A well model defining properties of the one or more fractures intersecting the production well is generated using the static and dynamic data. Fluid flow is simulated in the well model to obtain simulated fluid flow rates between the one or more fractures and the production well. Fracture properties defined in the well model are adjusted based on the simulated fluid flow rates and the measured fluid flow rates from the one or more fractures into the well. For example, the fracture properties can be optimized utilizing a genetic algorithm, simulated annealing, stochastic perturbation methods, or a combination thereof. Fluid flow in the updated well model having the adjusted fracture properties is simulated to obtain updated simulated fluid flow rates, which can be output or displayed. For example, the updated simulated fluid flow rates can be sent to a user interface device, a monitor, a computer readable storage medium, a local computer, or a computer that is part of a network.

Problems solved by technology

A large amount of effort has therefore, been dedicated to developing reservoir characterization and simulation techniques to better predict how fluid will flow within a reservoir.
Highly complex geological subsurface reservoirs, such as fractured reservoirs, present unique and specialized challenges with regards to forecasting fluid flow.
A fractured reservoir is a reservoir in which a network of fractures enhances the permeability field, thereby significantly affecting well productivity and recovery efficiency.
Furthermore, several fracture sets can coexist in a rock forming connected networks of significant extent and complexity.
This can contribute to considerable well-to-well production variability and makes performance predictions highly uncertain for fractured reservoirs.

Method used


Image

  • System and method for characterizing fractures in a subsurface reservoir
  • System and method for characterizing fractures in a subsurface reservoir
  • System and method for characterizing fractures in a subsurface reservoir

Examples


example 1

[0074]FIG. 6 shows a simple example presented to demonstrate the aforementioned system and method. A well is provided that has an upper and lower fracture zone. Production logging tool data from the well shows a response of 180 barrels per day in the upper fracture zone and a response of 240 barrels per day in the lower fracture zone. To simulate the flow rates for this well model, an initial fracture half length of 350 feet is assigned to each of these fractures. Based on these fracture lengths the simulated well model predicts a flow rate of 210 barrels per day from each zone.

[0075]The fracture lengths are then adjusted based on the difference between the simulated flow rates and measured dynamic flow rates using Equation 3. Using a value of one for the n_exp in Equation 3, the fracture length in the upper fracture zone is calculated to a reduced length of 300 feet (180 b / d / 210 b / d*350 ft=300 ft). The fracture length in the lower fracture zone is calculated to an increased length ...

example 2

[0077]This example demonstrates the system and method disclosed herein and specifically helps illustrate how pressure data can be used to further constrain fracture sizes by providing a more accurate estimate of the gridblock permeability. In addition, this example showcases how the uncertainty range of possible fracture sizes can be ascertained by changing some uncertain parameters and rerunning the routine.

[0078]FIG. 8 shows dynamic production logging tool data for an actual well that was recorded about three months after the well was placed online. In FIG. 8, the horizontal bars show the location and quantity of wellbore inflow. In particular, there are five identified fracture zones that show sufficient increased fluid flow.

[0079]A Fullbore MicroImager (FMI) electrical resistivity image of the well provides a log of fracture locations, orientations, and apertures, which is shown in the table below:

DIPDipDepthMagnitudeAzimuthAperture(ft)(degrees)(degrees)(mm)13045309.0779.3520→13...

example 3

[0089]FIG. 11 shows production logging tool data for a well in a more geologically complex reservoir. In this example, the model has more fractures, and the porosity and permeability are extracted from a full field model. The PLT data was recorded about 500 days after the well came online. On the right side of the figure, there are a number of horizontal bars that indicate the location of fracture zones at which fluid flow is produced. The lengths of the horizontal bars show how much fluid flow is coming in at each fracture zone. There are twelve zones that show some inflow or increase in fluid flow. However, the production in two of the fracture zones is very little. Since these two fracture zones are in close proximity to more prolific fracture zones, the flow from these two zones will be included with the neighboring more prolific fractured zones. Therefore, the fracture sizes will only be determined in 10 zones during simulation.

[0090]Similar to the previous example, there are m...


PUM


Abstract

The disclosed methods, systems, and software are described to optimize fracture characteristics and simulate fluid flow rates in a well model. The well model, which includes at least one fracture intersecting a production well, is generated with static and dynamic data. Fluid flow in the well model is simulated to obtain simulated fluid flow rates between fractures and the well. Fracture properties, such as length, height and aperture, are then updated responsive to measured and simulated fluid flow rates. Multiple simulation runs and updating of the fracture properties can be performed until the simulated fluid flow rates converge with the measured fluid flow rates. Pressure data can be used to determine gridblock permeability, which in turn helps constrain the model, thus providing more reliable fracture properties. Uncertainty ranges of the fracture properties can also be calculated.

Description

CROSS-REFERENCE TO RELATED APPLICATION[0001]The present application for patent claims the benefit of U.S. Provisional Application for Patent bearing Ser. No. 61 / 162,962, filed on Mar. 24, 2009, the entirety of the application is incorporated herein by reference.FIELD OF THE INVENTION[0002]The present invention relates in general to methods, systems, and software for simulating fluid flow and characterizing fractures in a subsurface reservoir, and in particular to methods, systems, and software that utilize dynamic production data to accurately determine fracture properties and predict fluid flow within the subsurface reservoir.BACKGROUND OF THE INVENTION[0003]The field of hydrocarbon production is directed to retrieving hydrocarbons that are trapped in subsurface reservoirs. These hydrocarbons can be recovered by drilling wells into the reservoirs such that hydrocarbons are able to flow from the reservoirs into the wells and up to the surface. The geology of a reservoir has a large ...

Claims


Application Information

Patent Timeline
Patent Type & Authority Applications(United States)
IPC IPC(8): G06G7/57
CPCG06F17/5018G01V11/00E21B49/00G06F30/23G01V99/005G01V2210/646G01V2210/663E21B2200/20
Inventor NARR, WAYNEHOFFMAN, BENJAMIN TODDLI, LIYONG
Owner CHEVROU USA INC
Why Eureka
Try Eureka