Performance reports associated with continuous sensor data from multiple analysis time periods

a technology of continuous sensor data and performance reports, applied in the field of providing performance reports to persons with diabetes, can solve the problems of inability to make educated insulin therapy decisions, diabetes-related problems, and likely late discovery of hyper- or hypo-glycemic conditions by people with diabetes

Inactive Publication Date: 2011-01-06
DEXCOM
View PDF8 Cites 486 Cited by
  • Summary
  • Abstract
  • Description
  • Claims
  • Application Information

AI Technical Summary

Benefits of technology

[0026]In an embodiment of the fifth aspect, the performance report generation instructions include a first analysis time period and a second analysis time period.
[0027]In an embodiment of the fifth aspect, the performance report module is additionally configured to determine a first statistical value based on continuous sensor analyte data associated with the first analysis time period, and a second statistical value based on continuous sensor analyte data associates with the second analysis time period, wherein the performance indication is based on a comparison of the first statistical value and the second statistical value.
[0028]In an embodiment of the fifth aspect, the performance report generation instructions include a first analysis time period and target sensor data.
[0029]In an embodiment of the fifth aspect, the performance report module is additionally configured to determine a first statistical value based on continuous sensor analyte data associated with the first analysis time period, wherein the performance indication is based on a comparison of the first statistical value and the target sensor data.
[0030]In an embodiment of the fifth aspect, the performance module is additionally configured to determine when a pre-defined criteria associated with the therapy recommendation is met and initiate display of the therapy recommendation on the user interface when the performance module determines that the pre-defined criteria is met.

Problems solved by technology

In the diabetic state, the victim suffers from high blood sugar, which may cause an array of physiological derangements (for example, kidney failure, skin ulcers, or bleeding into the vitreous of the eye) associated with the deterioration of small blood vessels.
Conventionally, a person with diabetes carries a self-monitoring blood glucose (SMBG) monitor, which typically requires uncomfortable finger pricking methods.
Unfortunately, these time intervals are so far apart that the person with diabetes will likely find out too late about hyper- or hypo-glycemic conditions.
In fact, it is not only unlikely that a person with diabetes will take a timely SMBG value, it is likely that the person with diabetes will not know if their blood glucose value is going up (higher) or down (lower) based on conventional methods.
Thus, their ability to make educated insulin therapy decisions is inhibited.

Method used


Image

  • Performance reports associated with continuous sensor data from multiple analysis time periods
  • Performance reports associated with continuous sensor data from multiple analysis time periods
  • Performance reports associated with continuous sensor data from multiple analysis time periods

Examples


example performance

Reports

[0079]FIGS. 5-8 illustrate exemplary performance reports that include various statistical values and performance indicators in accordance with various embodiments.

[0080]FIG. 5 illustrates one exemplary performance report 500 that includes statistical values and performance indicators for each of two analysis time periods, which in this example are months. In particular, the performance report 500 illustrates statistical values associated with a first analysis time period (from January 29 to February 27) in column 510 and statistical values associated with a second analysis period (from February 28 to March 27) in column 520. The performance report 500 also indicates performance indicators indicative of similarities between the statistical values in columns 510 and 520 in column 530. For example, in a row 540, the mean glucose levels of the sensor readings during each of the analysis time periods are provided in columns 510, 520, and a percentage change in the mean glucose lev...

example method

of Generating Performance Reports

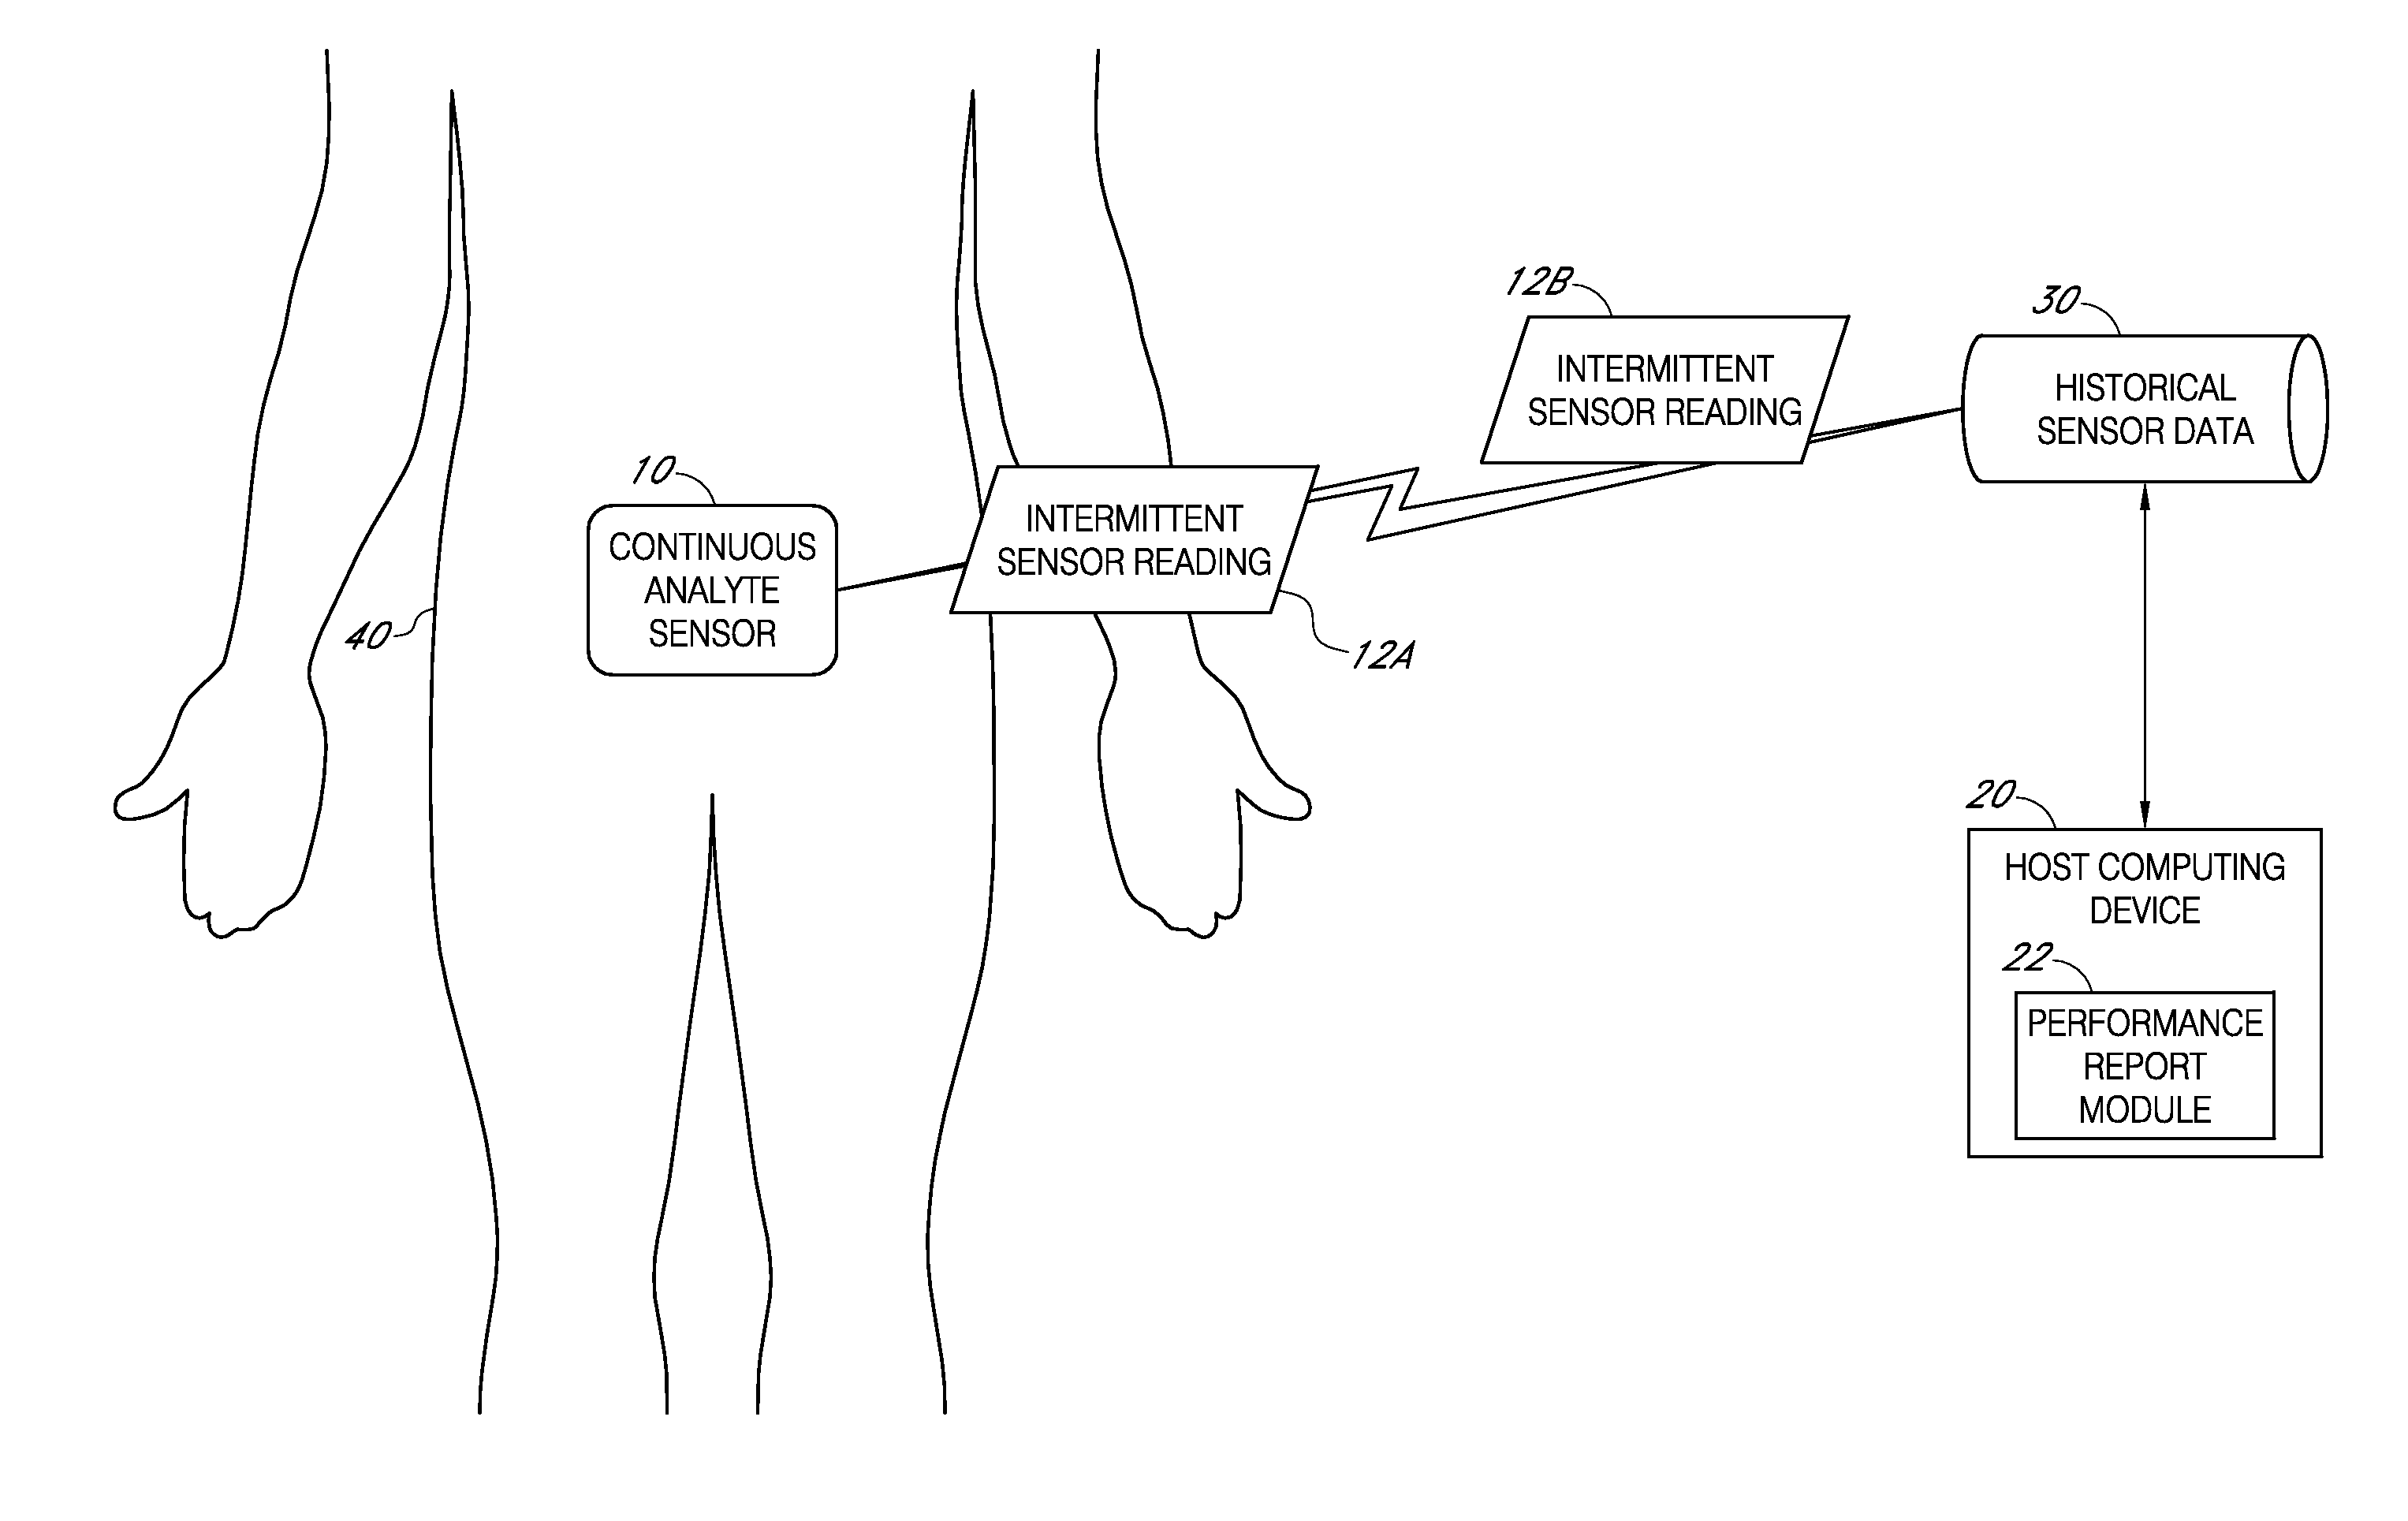
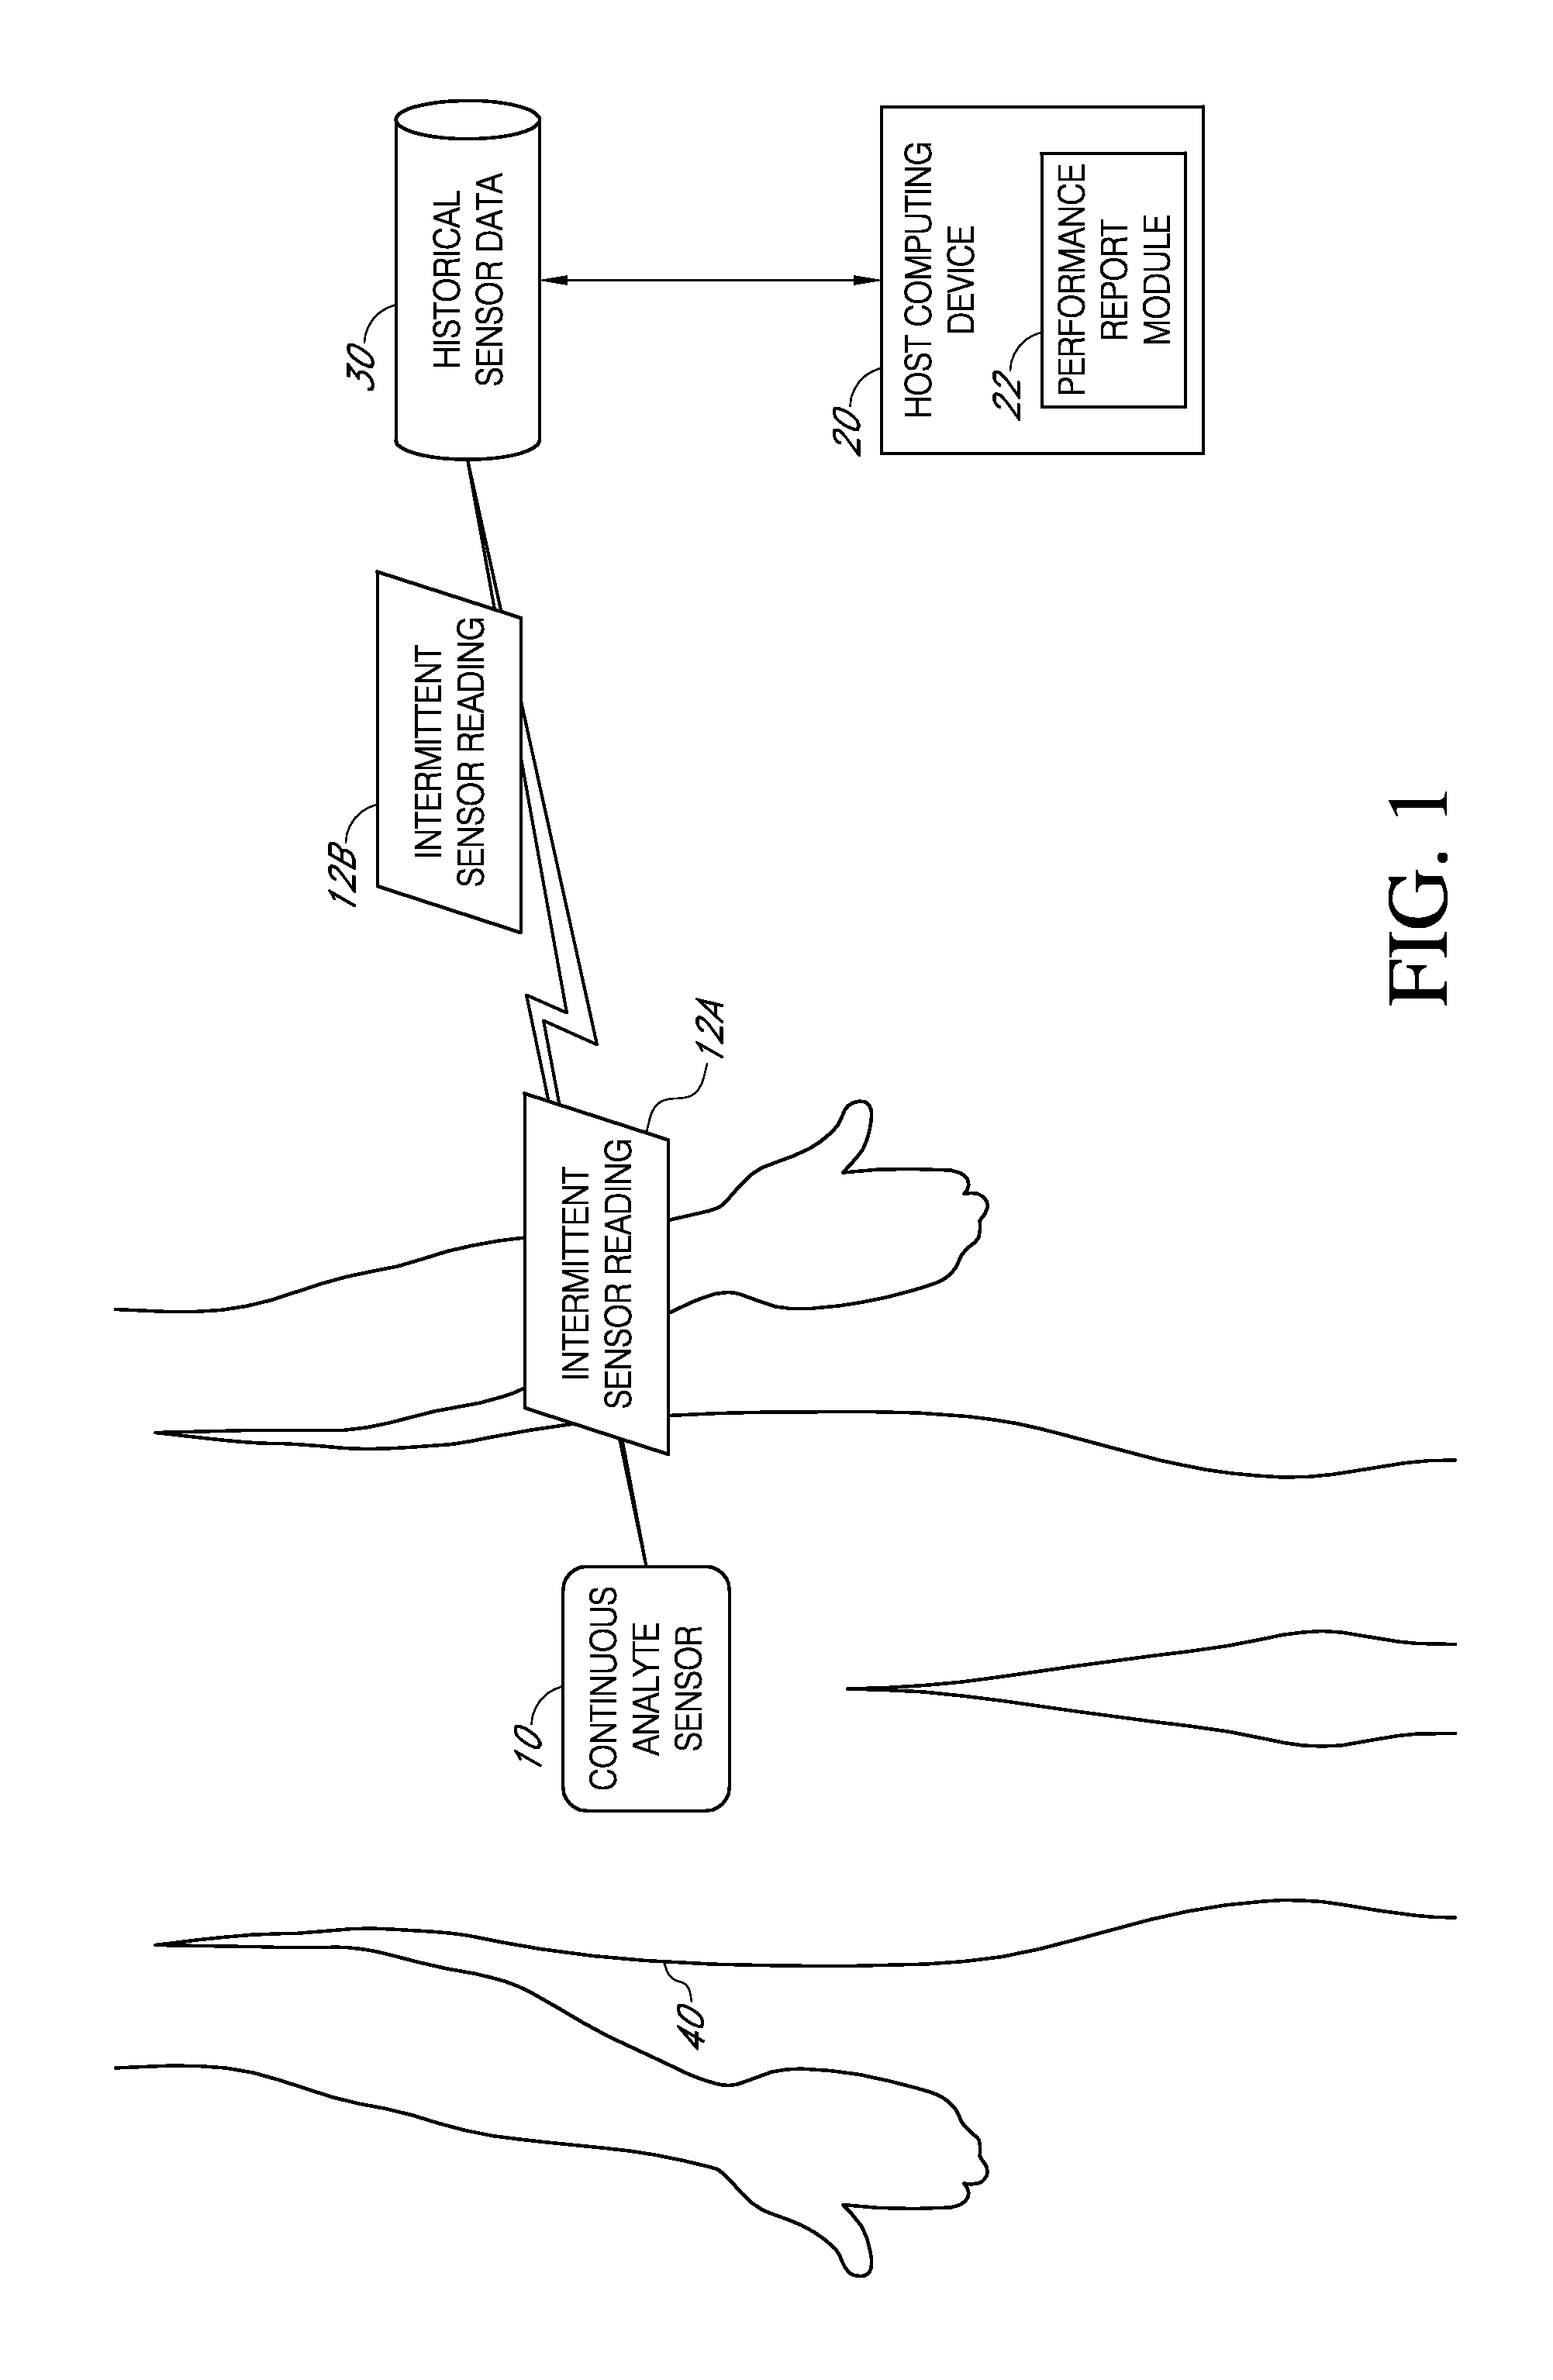
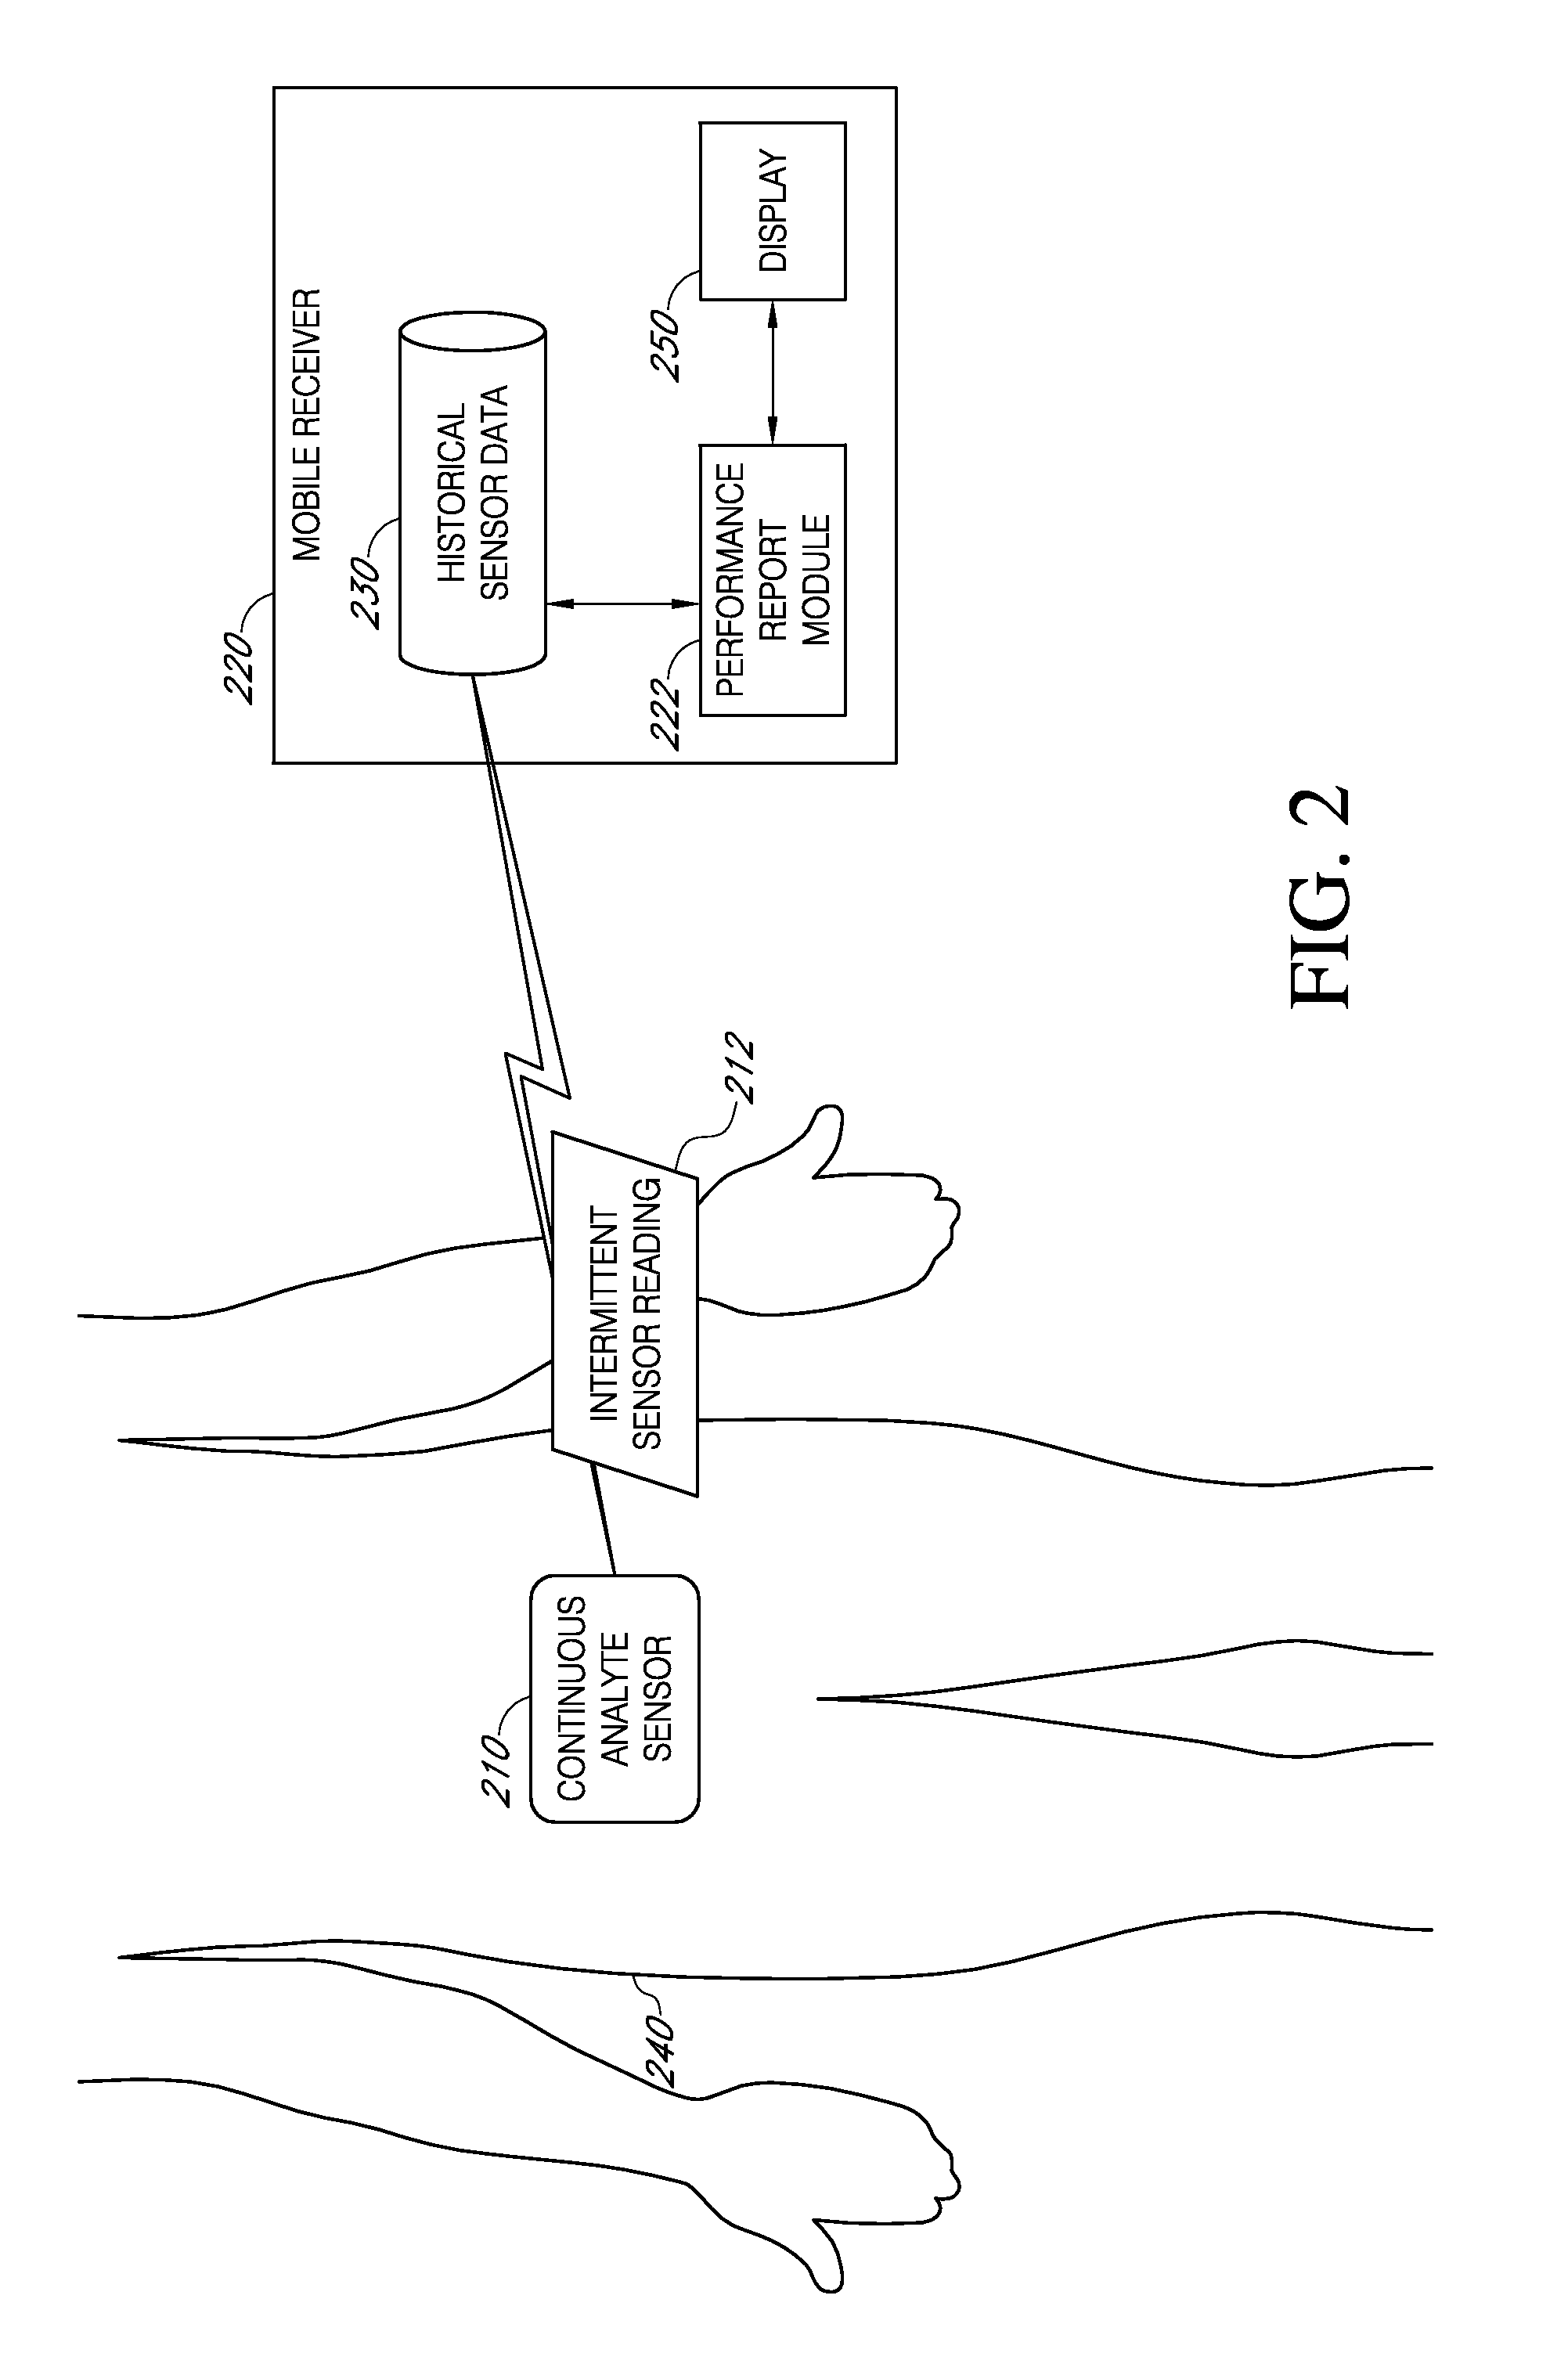
[0099]FIG. 10 is a flowchart illustrating a method of generating performance reports indicating performance indicators between continuous sensor data from two or more analysis time periods in accordance with one embodiment. The various tasks performed in connection with the method of FIG. 10 may be implemented by software, hardware, firmware, a computer-readable medium storing computer executable instructions for performing the process method, or any combination thereof. In addition, the various tasks performed in connection with the method of FIG. 10 may be performed by any suitable computing device, such as the host computing device 20 of FIG. 1, the mobile receiver 220 of FIG. 2, and / or any other suitable computing device. For ease of convenience, the method of FIG. 10 may be described from time-to-time with respect to the host computing device 20; however, any reference to the host computing device 20 should be construed to cover any other suitab...


PUM


Abstract

A method of providing performance reports to persons associated with the monitoring of an analyte level, such as blood glucose concentrations in a host, is provided. The performance reports can indicate a measure of an analyte variability of the host over a first analysis time period compared to a measure of analyte variability of the host over one or more other analysis time periods. The analyte level of the host can be received in each of a plurality of sensor readings from a continuous analyte sensor, such as multiple sensor readings per hour, so that the analyte variability that is used in determining the performance report of the host can be based on not just a few metered readings taken by the host, but a plurality of intermittent readings that are taken by a continuous analyte sensor, for example. Various types of performance reports can be generated, such as reports that comprise charts, graphs, tables, and/or other visual indicia of a host's performance during one analysis period versus another analysis period.

Description

CROSS-REFERENCE TO RELATED APPLICATIONS[0001]This application claims the benefit under 35 U.S.C. §119(e) of U.S. provisional application Ser. No. 61 / 174,436, filed Apr. 30, 2009, the disclosure of which is hereby expressly incorporated by reference in its entirety and is hereby expressly made a portion of this application.FIELD OF THE INVENTION[0002]Systems and methods for providing performance reports to persons with diabetes that generally indicate a measure of a glucose variability of the person over multiple analysis time periods are provided.BACKGROUND OF THE INVENTION[0003]Diabetes mellitus is a disorder in which the pancreas cannot create sufficient insulin (Type I or insulin dependent) and / or in which insulin is not effective (Type 2 or non-insulin dependent). In the diabetic state, the victim suffers from high blood sugar, which may cause an array of physiological derangements (for example, kidney failure, skin ulcers, or bleeding into the vitreous of the eye) associated wi...

Claims


Application Information

Patent Timeline
Patent Type & Authority Applications(United States)
IPC IPC(8): A61B5/145
CPCA61B5/0031A61B5/14532A61B5/14546A61B5/743A61B2560/045G06F19/345G06F19/3487A61B5/681G16H15/00G16H50/20A61B5/14503A61B5/486A61B5/7275
Inventor MENSINGER, MICHAEL R.RUPPERT, DEBORAH M.
Owner DEXCOM
Why Eureka
Try Eureka