System and method for making decisions

a decision-making system and decision-making technology, applied in the field of decision-making and analysis, can solve problems such as dangerous problems, difficult and impacted selection of correct action or decision, and perennial problems such as surpris

Inactive Publication Date: 2011-02-17
DECISION COMMAND
View PDF9 Cites 27 Cited by
  • Summary
  • Abstract
  • Description
  • Claims
  • Application Information

AI Technical Summary

Benefits of technology

[0023]Many decisions are improved by the generation of new ideas or insights. The invention provides a system for creating new ideas that are directly pertinent to the specific issues involved in the decision. New ideas and insight can assist in many situations including: discerning issues or considerations that might have been missed or overlooked, such as a surprise; developing creative ways to overcome disagreements or disp

Problems solved by technology

As has been well-researched in various behavioral sciences and is repeatedly observed in real life, in complex situations selecting the correct action or decision is difficult and impacted by many factors.
These deficiencies can cause dangerous problems.
Surprise is a per

Method used


Image

  • System and method for making decisions
  • System and method for making decisions
  • System and method for making decisions

Examples


example 1

Error Increase

[0186]In this example, which is indicative of prior systems, the revenue in a business is 100 (in millions of dollars). The costs are 95. Hence, profits are 5.

Revenue =100Costs =95Profit =5

[0187]But in this example there are a variety of problems so there is an estimated 10% error in the revenue figure. The real revenue, thus, is anything from 90 to 110. For simplicity, it is first assumed the costs remain at 95. Now the problem becomes

Revenue =[90 to 110]Costs =95Profit =[−5 to 15]

[0188]Originally, the profit was believed to be 5, but due to the error in the input information, it could be from −5 to 15. In other words, due to the procedure employed, an input error of 10% balloons to a perhaps 200% output error. The elasticity here is inordinately large since this is a very large increase.

example 2

Better Algorithm

[0189]A different procedure might treat the errors in a superior manner. To illustrate, in this example there are 60 white balls and 30 red balls. Thus the percentage of white balls is 66⅔%:

6060+30

[0190]Now it is assumed that an error has been discovered. There were not 60 white balls, but 70. This is a 16⅔% error in the input (10 on a base of 60).

[0191]The correct result is thus 70% white balls:

7070+30

[0192]Previously it was believed that the percentage of white balls was 66⅔ when it really was 70. That is an error of 5% in the output (3⅓ on a base of 66⅔).

[0193]The input data was in error by 16⅔%. However, the final result, the output, was in error only 5%. In other words, the input error of 16⅔% has been reduced to 5%, less than ⅓ as large.

[0194]The two different example procedures above treated the errors quite differently: one vastly increased the error while the other reduced it. It is a matter of the elasticity. In designing an algorithm there are many choices...

example 3

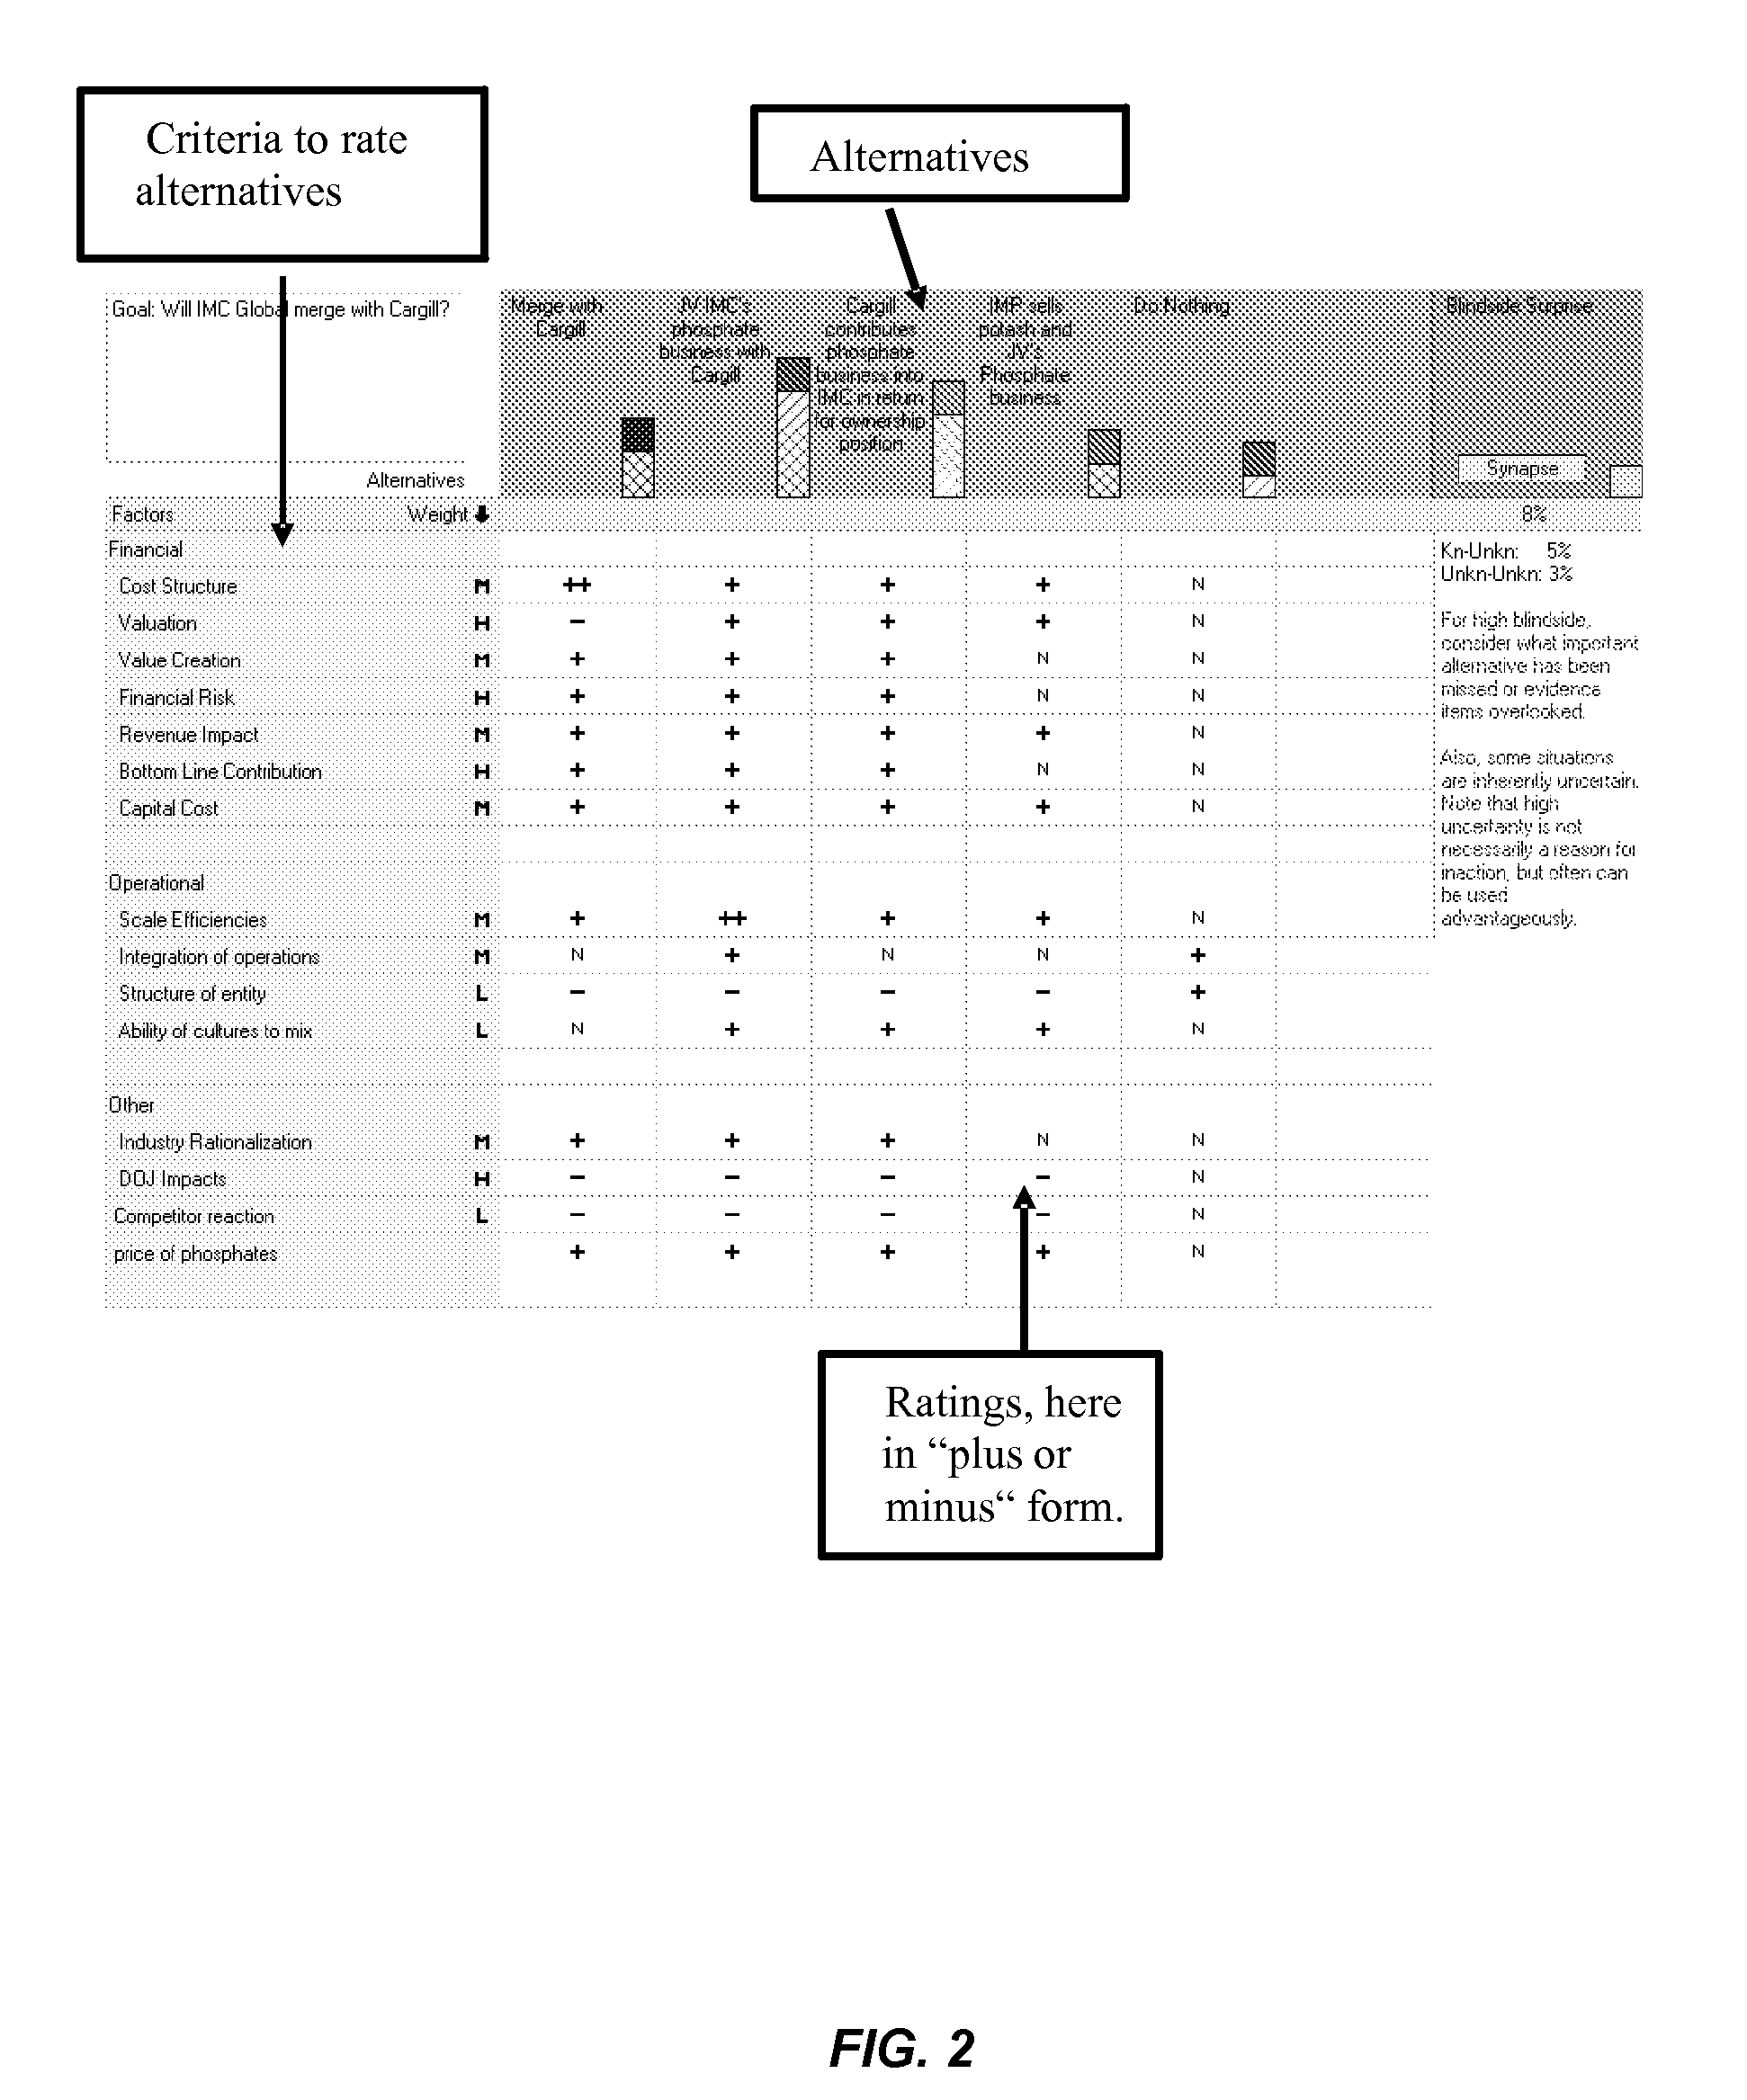
[0197]FIG. 13 depicts a decision about acquiring a firm in India. Along the top in blue (at arrow 1), the different alternatives are listed. Along the left side in yellow (at arrow 2), are the criteria that are employed to select the best alternative. In the column at the right side of the yellow (at arrow 3), are provided the weights of the importance of each criterion factors, in this case they range from Low, Medium to High.

[0198]At arrow 4 is a large white group of cells with plus and minus ratings. Blank cells default to neutral. These cells depict how each alternative rated on each criteria. Across a row are the ratings given the different alternatives for the specific criterion or factor. For example, the possibility “Acquire 100% of Indian Firm” received a double plus on the factor “Immediate growth with revenues likely doubling”. Also along the top in blue are cigarette-like bars and corresponding numbers (see arrow 5). The numbers are the probability that the corresponding...


PUM


Abstract

Systems and methods are disclosed that assist in making decisions, valuing a choice or action, promoting creative solutions, and reducing risks. Among other situations, the systems and methods consider situations where the user or users are evaluating a possible single choice or several alternative choices. The criteria to evaluate the decisions are input into a grid, and the user or users rate the one or more alternatives against the different criteria. Given several alternative choices or options, the system and method provides the probability each alternative is the right selection. In one embodiment, the system implements a Bayesian approach. The systems and methods may estimate the value of an option or choice, where the value might be financial or other metric, and may estimate the value of a risk, opportunity or factor that might influence the result. The systems and methods may estimate the amount the chance of being surprised or missing some relevant consideration has been reduced by the analysis. The possibility of black or gray swans can also be estimated, in the phraseology of Nassim Taleb. Systems and methods so disclosed may be employed in financial analyses, project or strategy selection, betting, resolution of disagreements, intelligence analysis, and so on.

Description

CROSS-REFERENCE TO RELATED APPLICATIONS[0001]This application is a continuation-in-part patent application of U.S. patent application Ser. No. 11 / 651,827, filed Jan. 10, 2007, entitled “System and Method for Making Decisions”, now U.S. Pat. No. 7,676,446, which claims the benefit of the following US Provisional Patent Applications: U.S. Provisional Patent Application Ser. No. 60 / 758,452, filed Jan. 11, 2006, entitled “Method For Determining Bias, Assumptions Or Atypical Reasoning In Decision Making”; U.S. Provisional Patent Application Ser. No. 60 / 758,453, filed Jan. 11, 2006, entitled “Method For Use When Making A Decision That Estimates The Chance That The Individual Can Do A Better Job Because He Or She Has Missed Something Important”; and U.S. Provisional Patent Application Ser. No. 60 / 758,454, filed Jan. 11, 2006, entitled “Method To Visually Display The Pros and Cons of Alternative Decision Choices”; each of which is incorporated by reference herein in its entirety.FIELD OF TH...

Claims


Application Information

Patent Timeline
IPC IPC(8): G06N5/02
CPCG06N5/04
Inventor ZANGWILL, WILLARD I.
Owner DECISION COMMAND
Why Eureka
Try Eureka