

Power consumption projection
a power consumption and projection technology, applied in the direction of material dimension control, process and machine control, instruments, etc., can solve the problems of limiting factor, most machines never achieve, and the number is not helpful for planning purposes, so as to effectively estimate energy consumption, energy cost, and energy efficiency
- Summary
- Abstract
- Description
- Claims
- Application Information
AI Technical Summary
Benefits of technology
Problems solved by technology
Method used
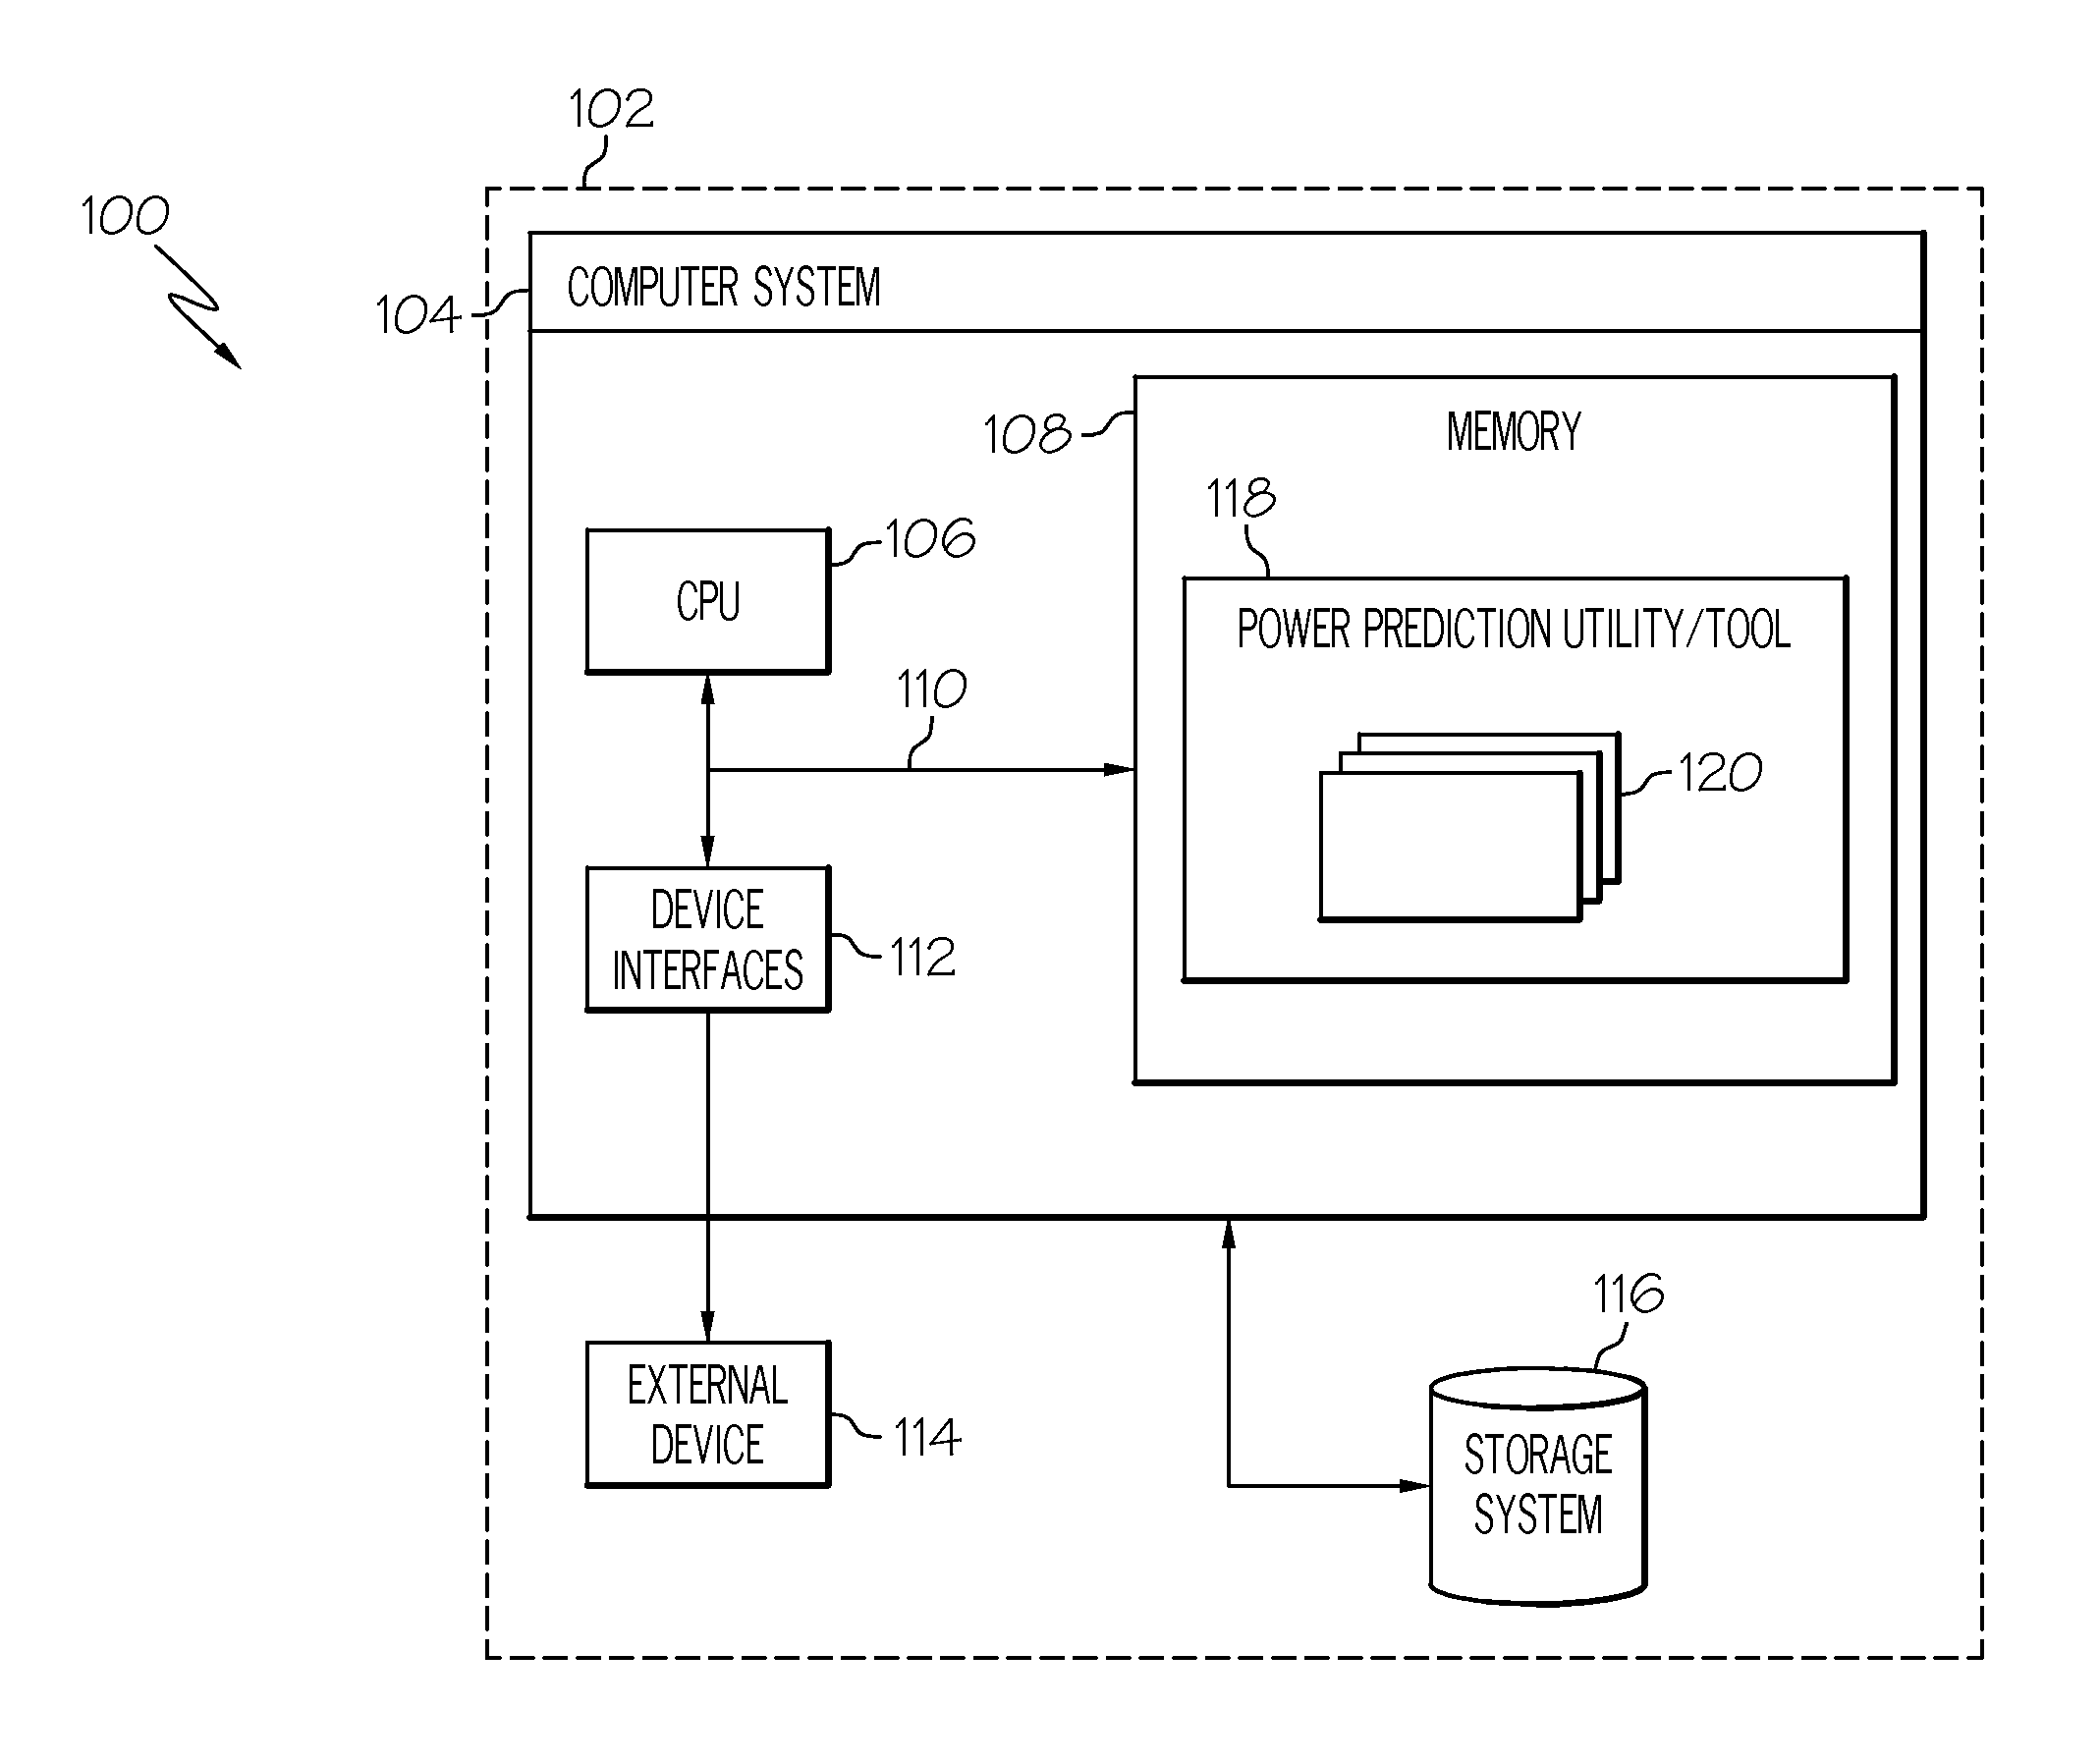
Image

Examples
example 1
Illustrative Example 1
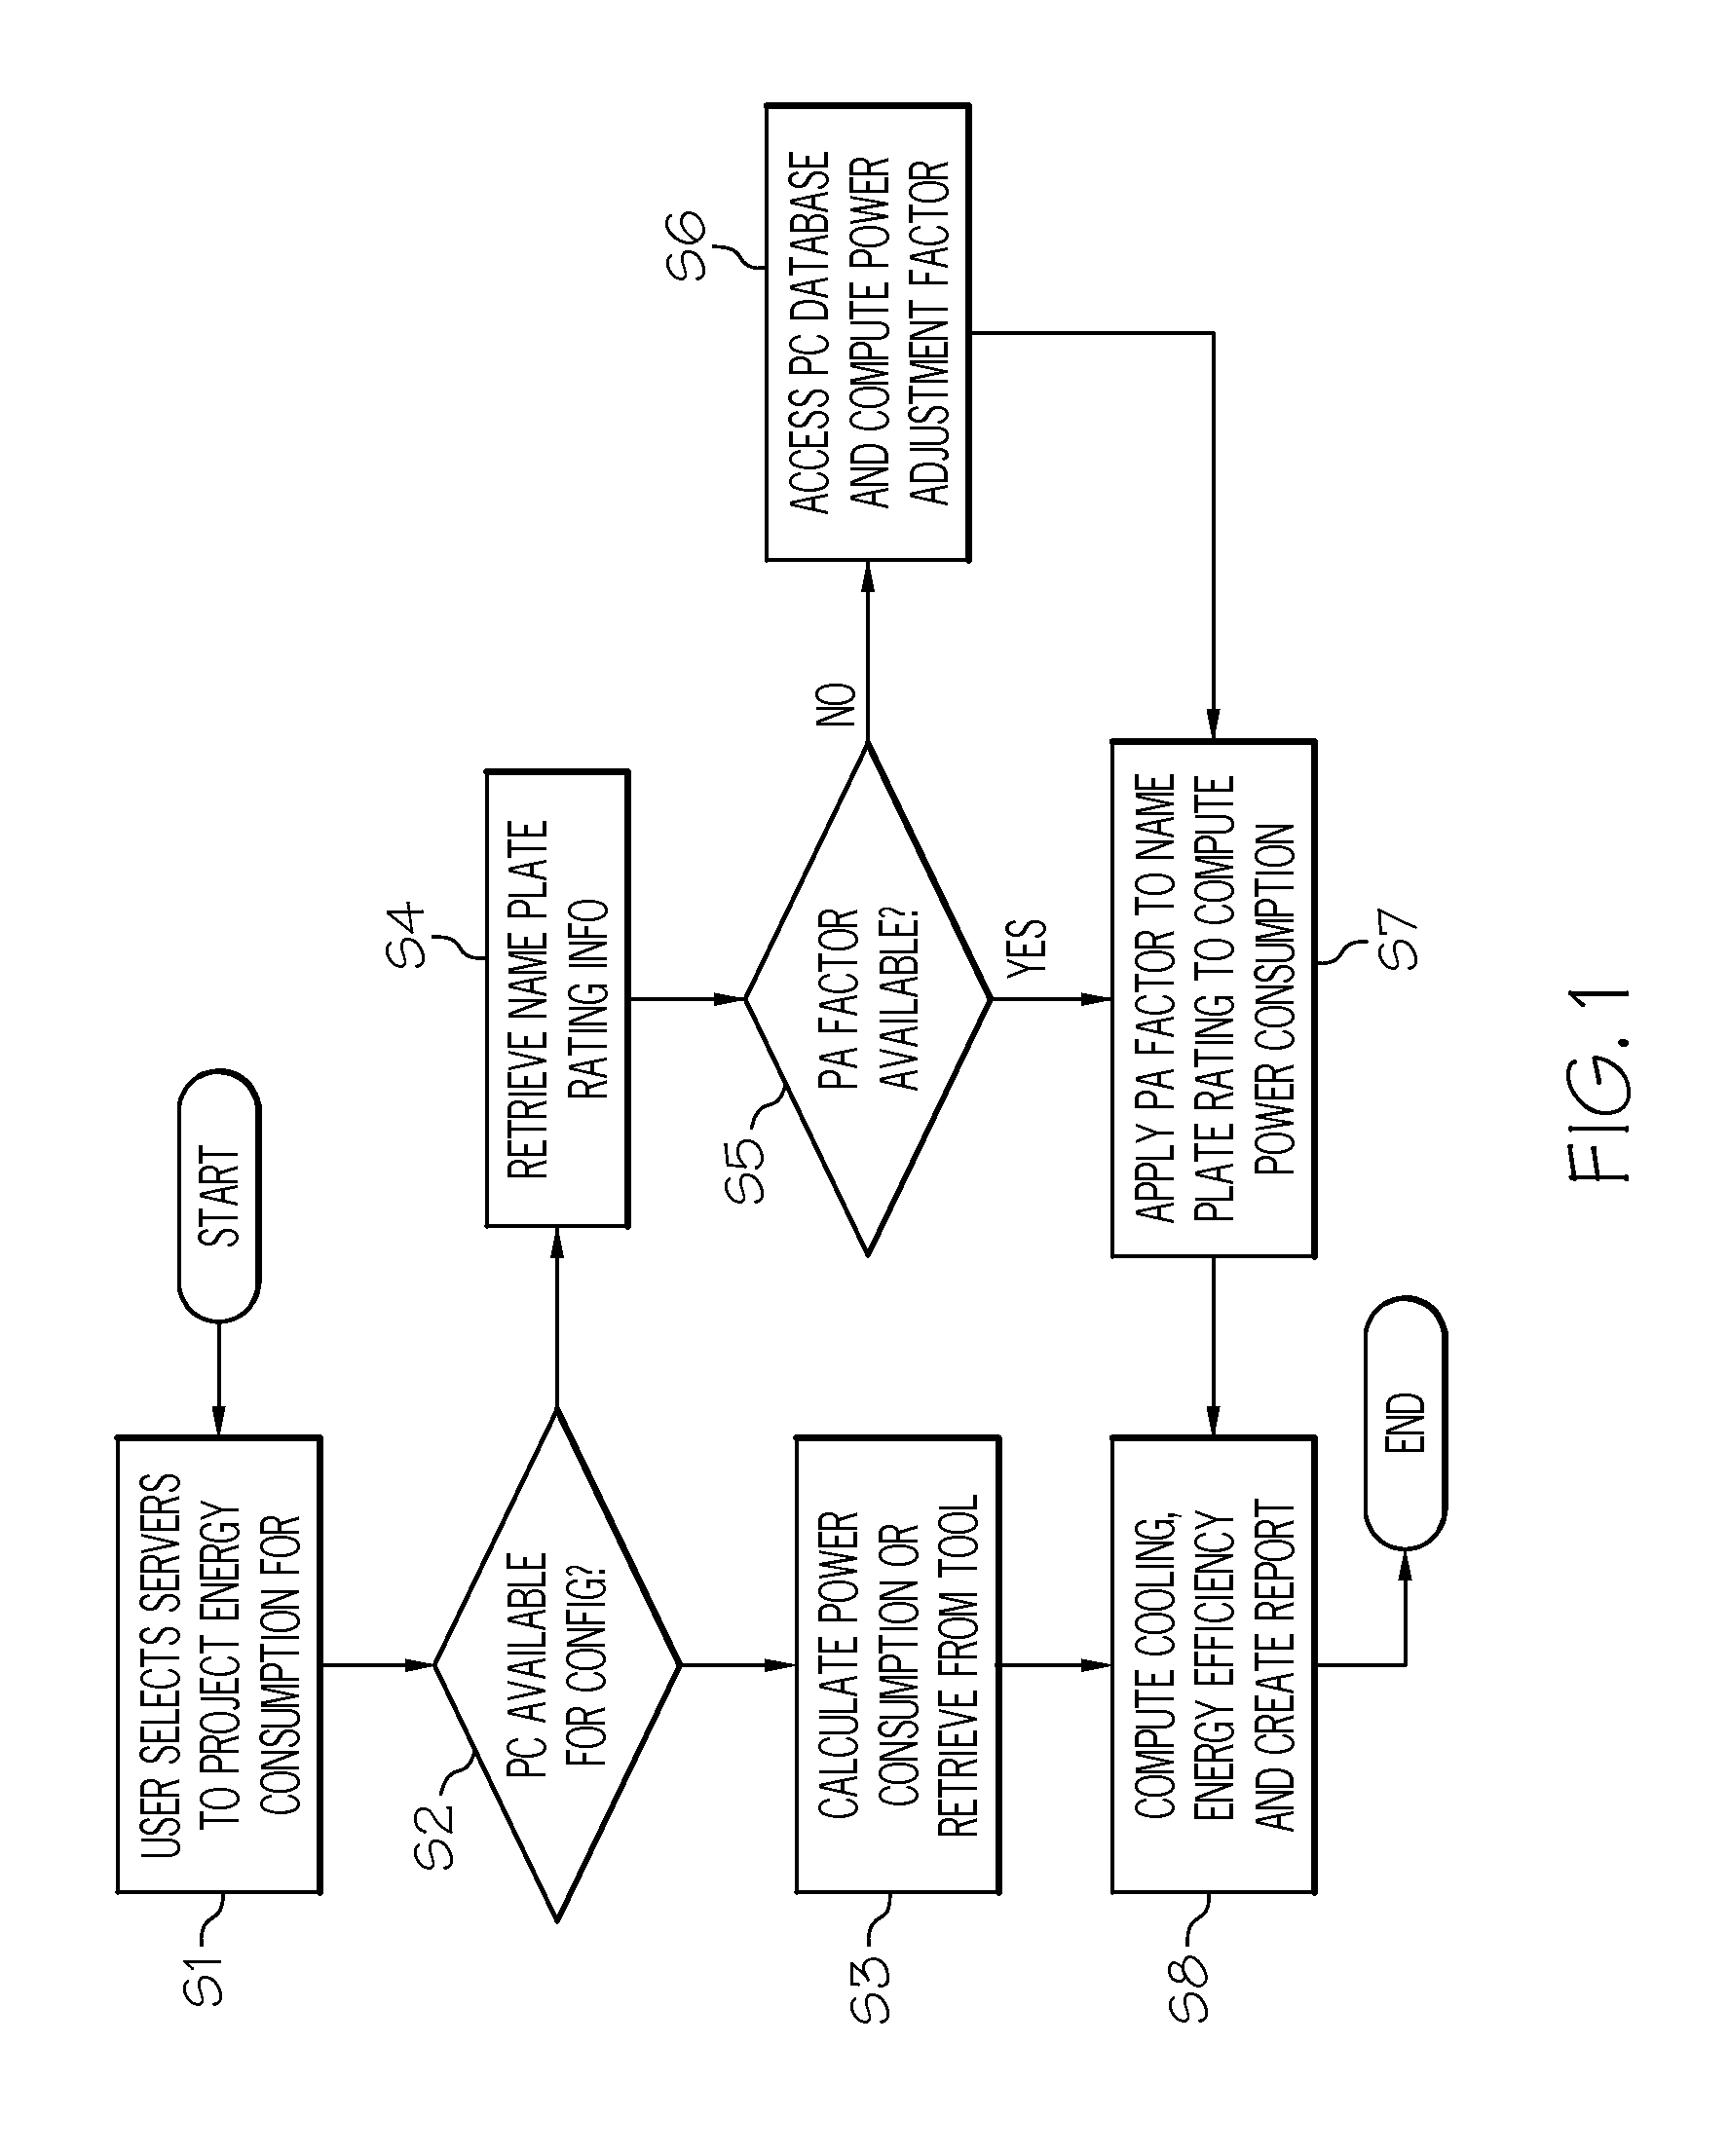
[0022]These steps will be further explained in the following illustrative examples:
[0023]Consider the case where client “Green, Inc.” has two data centers in Dallas and in Austin, Tex. Green, Inc. wants to determine the energy impact to the Austin data center of moving three of the servers from the Dallas data center, and currently the Austin data center is close to the maximum power it can draw from the grid.
[0024]Power consumption information by feature code is unavailable for the servers in question, so Green, Inc. opts to use the name plate ratings for the servers to determine the increased energy requirements of the Austin data center. The nameplate numbers are often not easily accessible and readable, and will almost always overestimate the increased energy required. Under the present invention, power consumption data is loaded quickly for the servers in question, and a power adjustment factor reflective of typical power use is applied. For example, a pow...
example 2
Illustrative Example 2
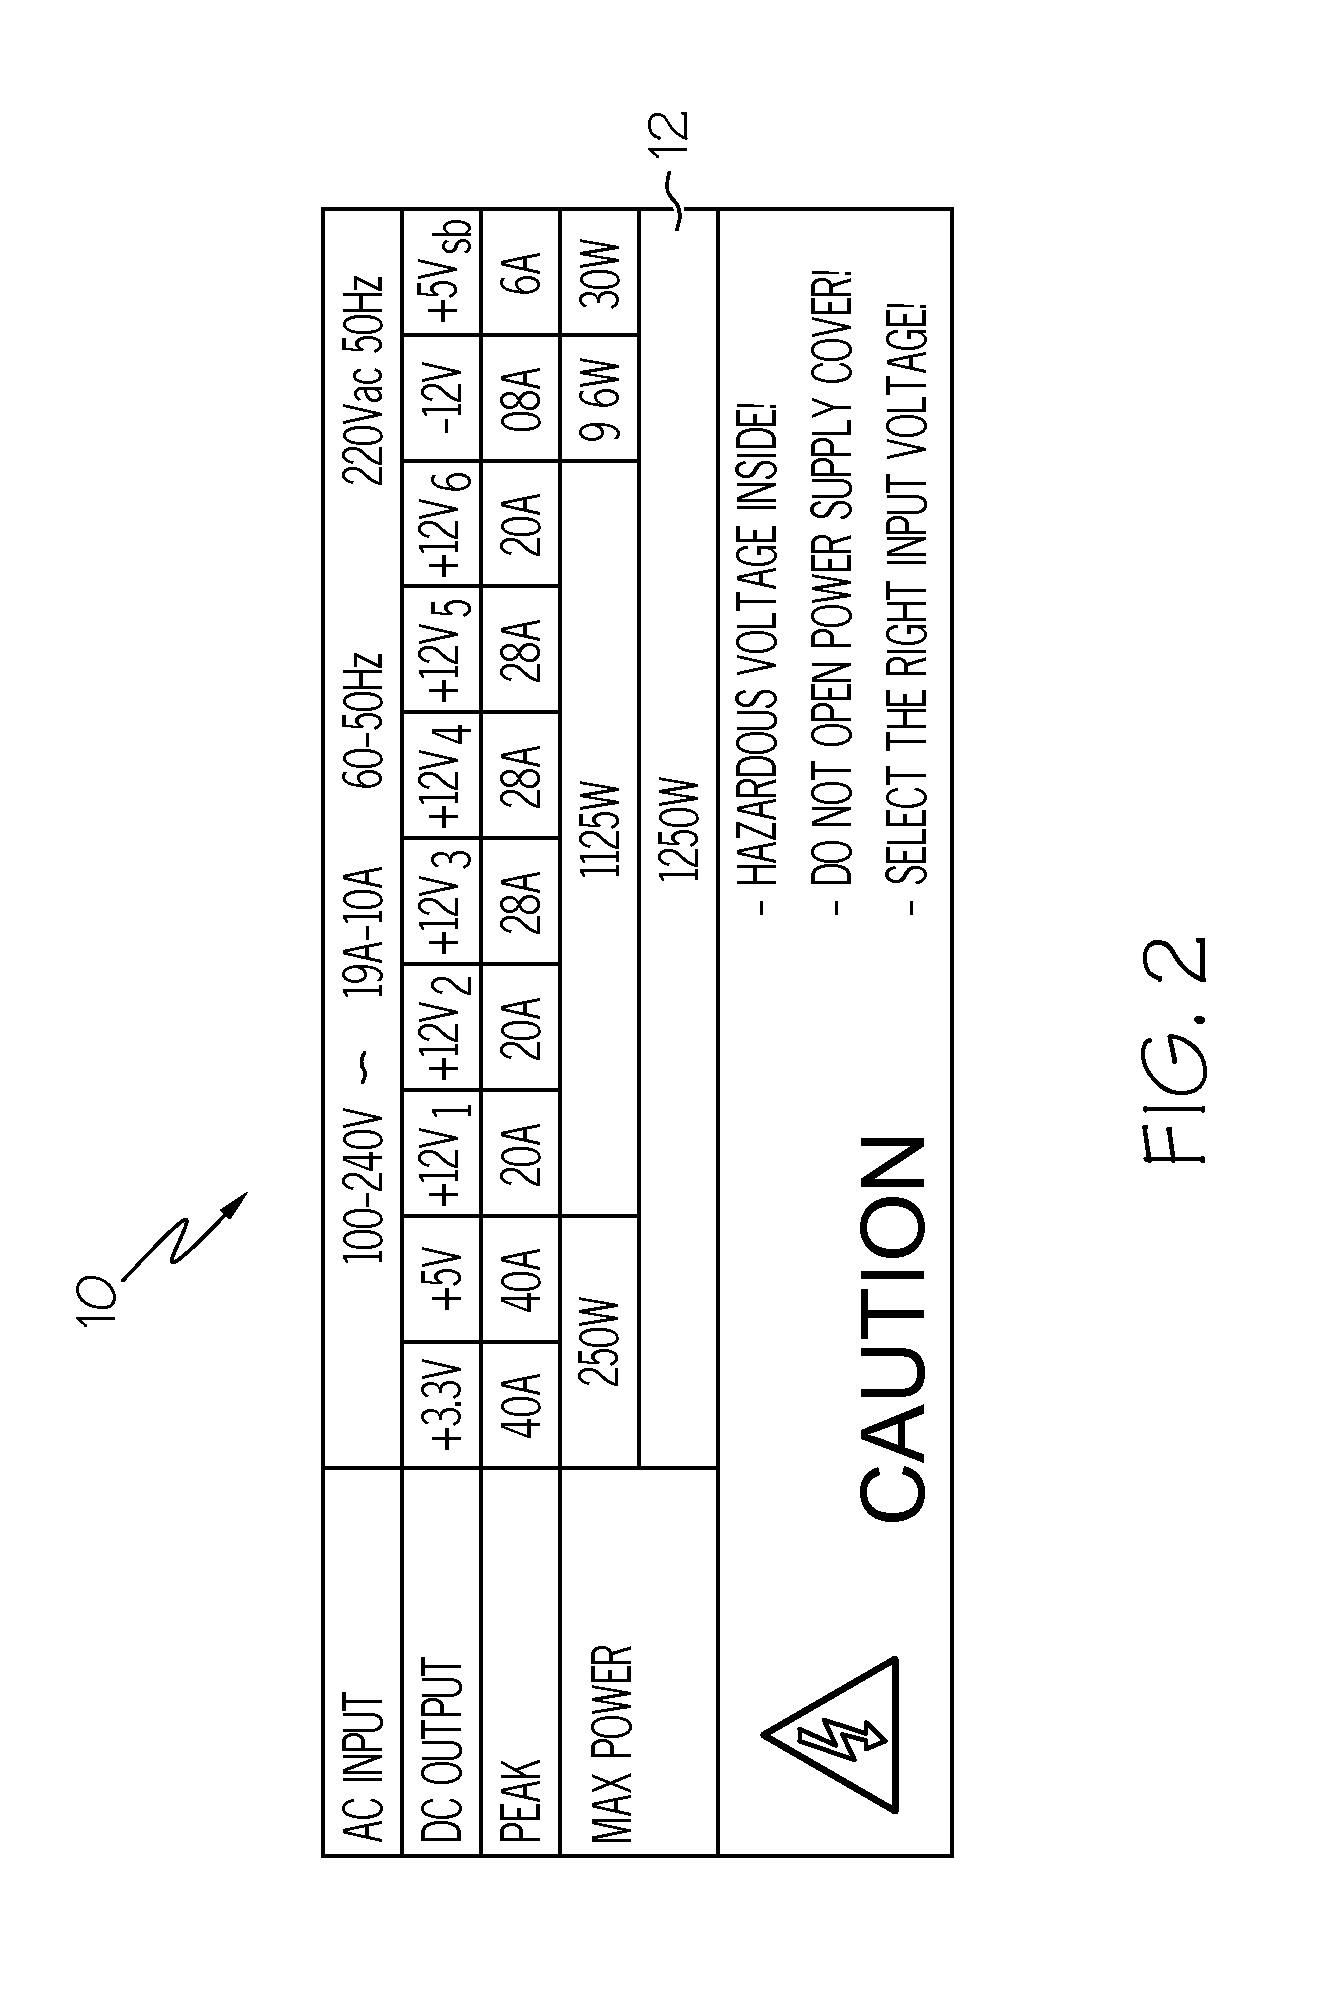
[0033]As indicated above, one resource from which information can be extracted for use under the present invention is a device name plate (as referred to in step S4 of FIG. 1). An example of a name plate 10 is shown in FIG. 2. The present invention refers to the entity “name plate” with respect to being able to physically look at a device in order to determine power ratings. As can be seen in this example, the MAX POWER rating 12 for this device is 1250 Watts. With respect to a computer server, this rating would indicated the power used under fully loaded conditions.
example 3
Illustrative Example 3
[0034]As indicated above, the present invention has the capability to consult a database of power consumption for devices (e.g., servers) to calculate the lower and upper limit to use as a power adjustment factor. This will mean that the power adjustment factor is dynamic, and as more data is populated into the source database, projections become increasingly accurate. The algorithm will then de-rate the maximum given name plate rating and use this range as the power consumption projection for the server under consideration.
[0035]In the case where there are no tools or direct methods available to measure power consumption and an extrapolation method must be used, this method becomes the preferred embodiment. In a preferred embodiment, a relational database would be used, as it provides advanced capabilities for search, sort, merge, insert data, delete data, and the like.
[0036]FIG. 3A provides a simplistic example of a database table 14 with sample row and colum...
PUM
 Abstract
Description
Claims
Application Information