Typed data graph visualization system in three dimensions

a typed data and graph visualization technology, applied in the field of typed data graph visualization system in three dimensions, can solve the problems of increasing the volume and complexity of data graphs produced world-wide, increasing the difficulty of clearly tracking each node and each relation in two dimensions, and the computer display runs out of space, so as to improve the comprehension of complex data graphs

Inactive Publication Date: 2011-07-14
IAN RANA
View PDF4 Cites 8 Cited by
  • Summary
  • Abstract
  • Description
  • Claims
  • Application Information

AI Technical Summary

Benefits of technology

[0011]This application pertains to a computer device implemented visualization system presenting a three-dimensional view of a data graph to a user on a display. The visualization system (1) improves the comprehension of complex data graphs; (2) enables large data graphs to be displayed in a compact form; (3) enables any data graph designed from a type graph to be visualized in three dimensions; and (4) enables a data graph which doesn't contain graphical information to be visualized in three dimensions. The three-dimensional visualization includes at least three-dimensional models geometrically arranged into discrete units. Each three-dimensional model presented is associated to a component of the data graph. Discrete units of three-dimensional model arrangement are determined by the local relations components of the data graph have with one another. In one embodiment, a visualization graph is created by combining a user-specified data graph with three-dimensional models and three-dimensional arrangements associated to a type graph.

Problems solved by technology

The volume and complexity of data graphs produced world-wide has rapidly increased over the past twenty years.
As the number of relations grows into the hundreds or thousands, and as the number of data nodes grows into the hundreds or thousands, it becomes increasingly difficult to clearly track each node and each relation in two dimensions.
But at a certain point computer displays run out of space.

Method used


Image

  • Typed data graph visualization system in three dimensions
  • Typed data graph visualization system in three dimensions
  • Typed data graph visualization system in three dimensions

Examples


Embodiment Construction

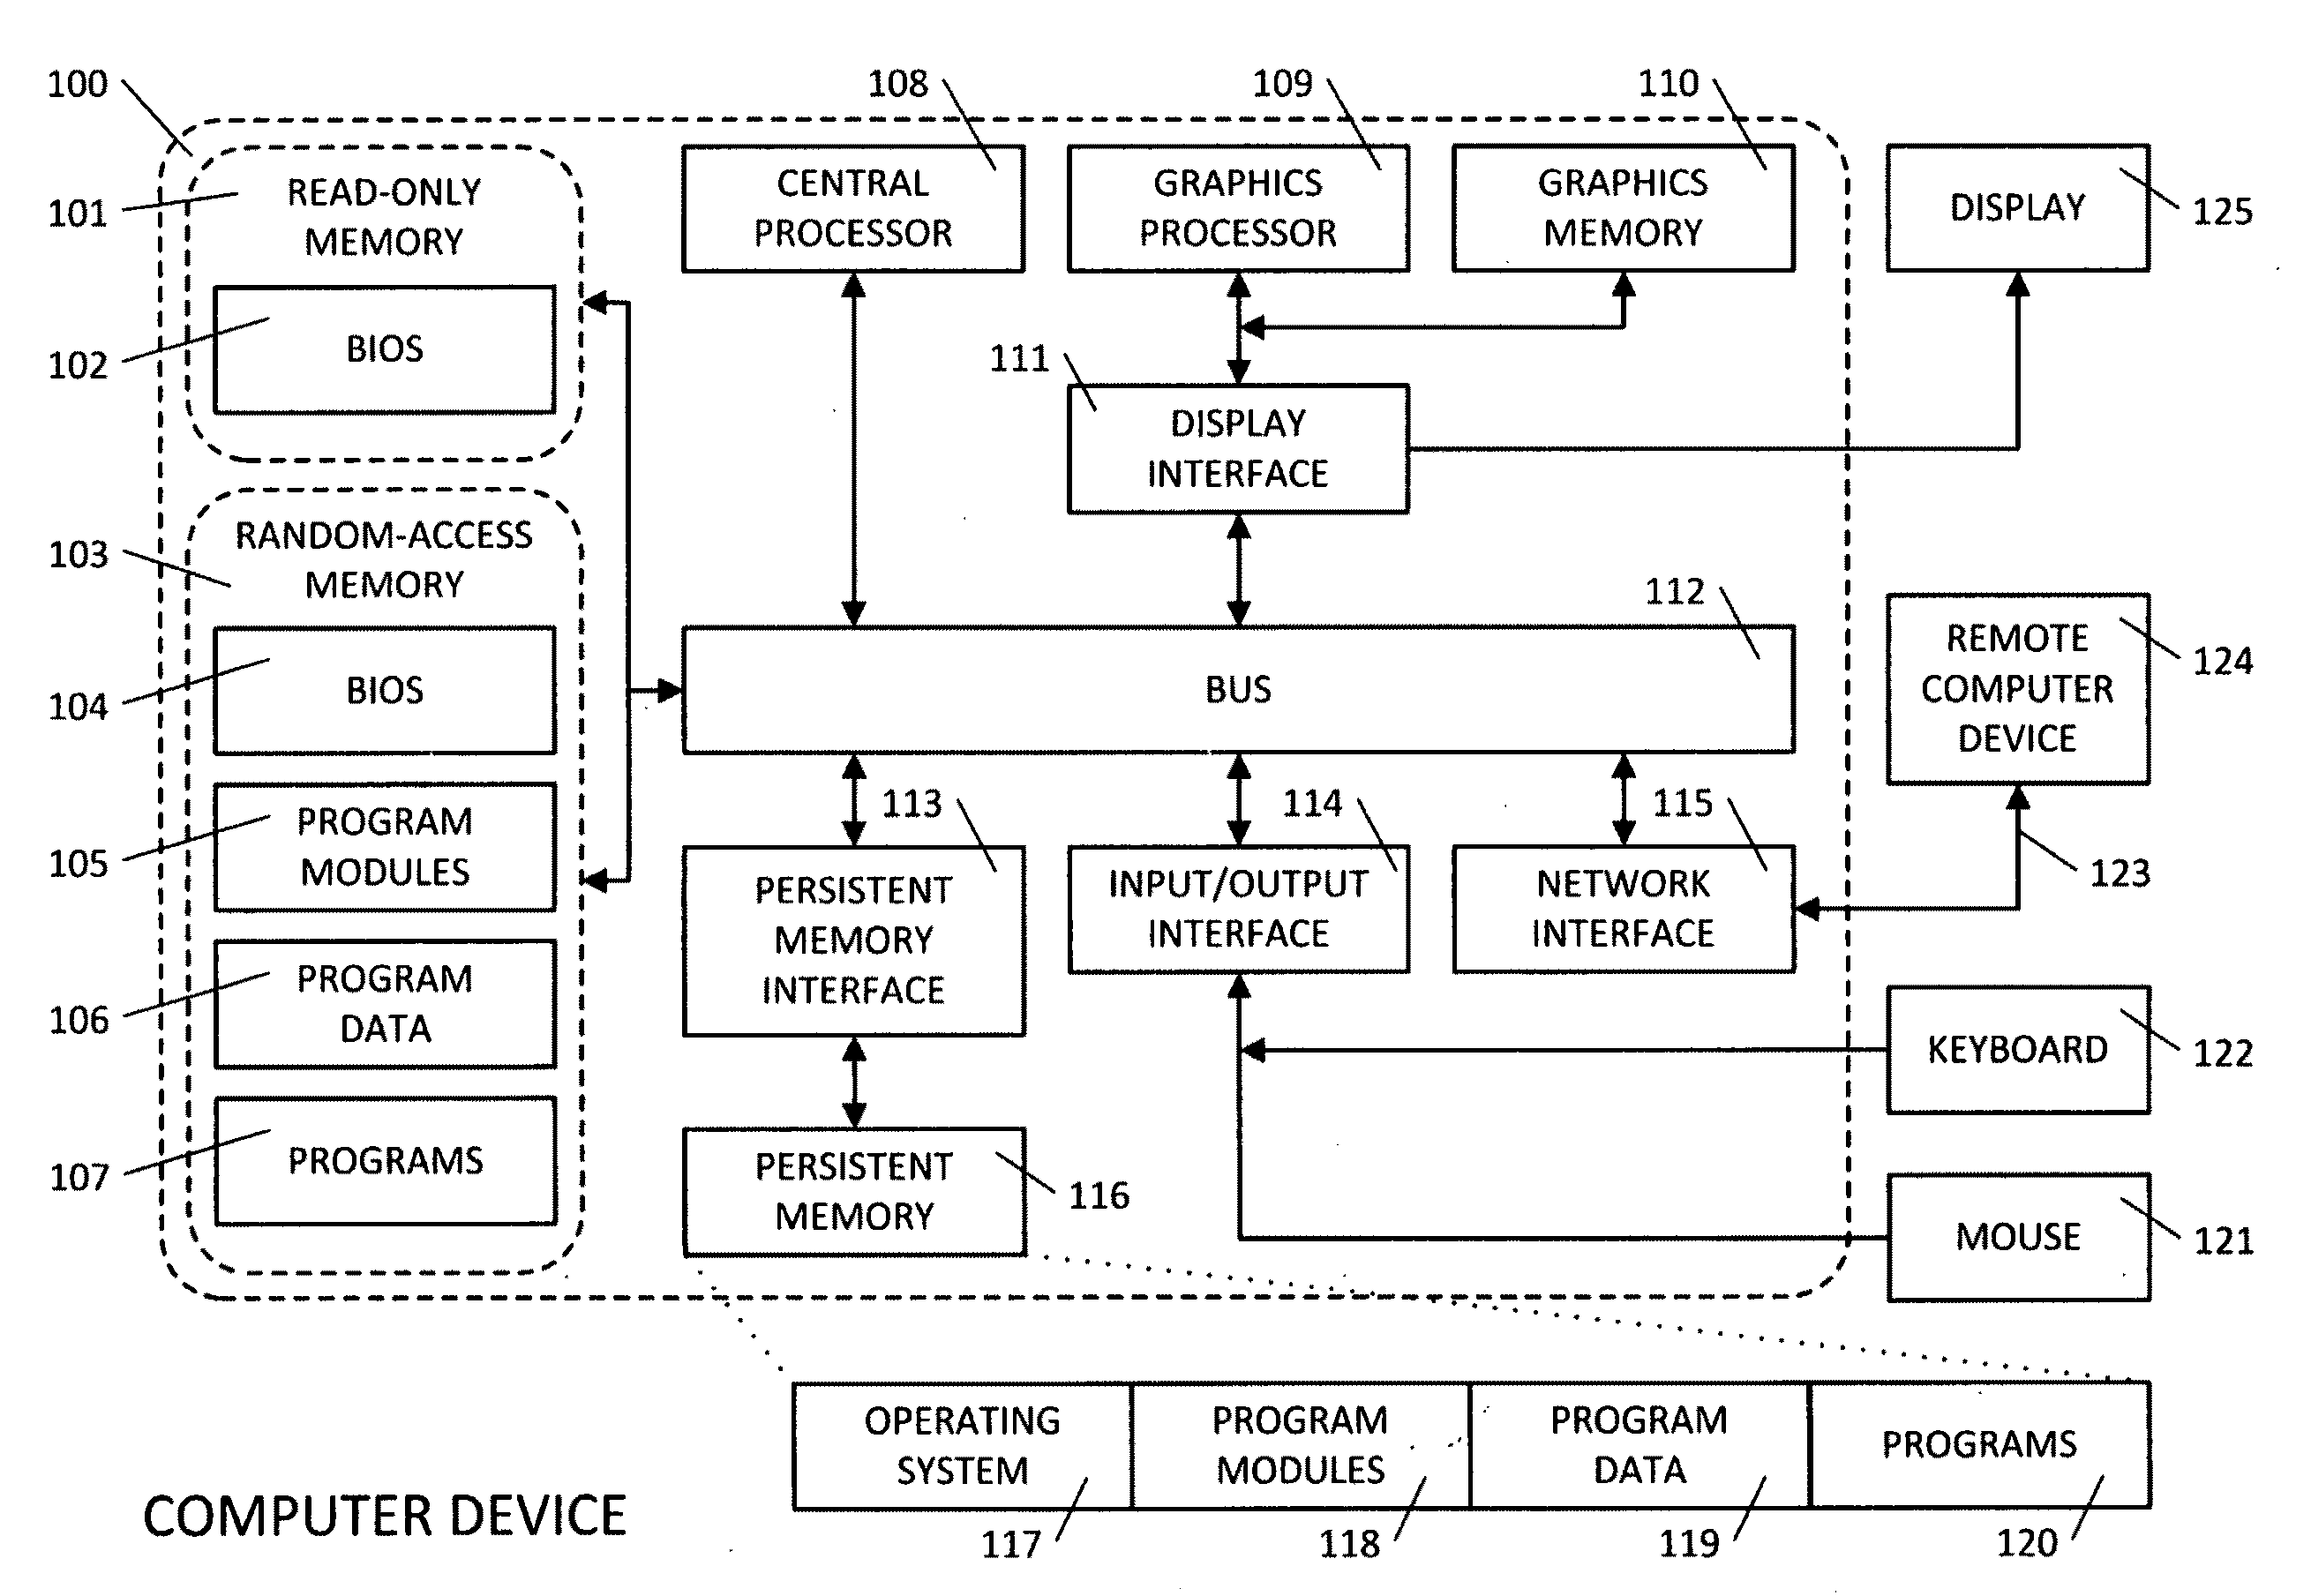
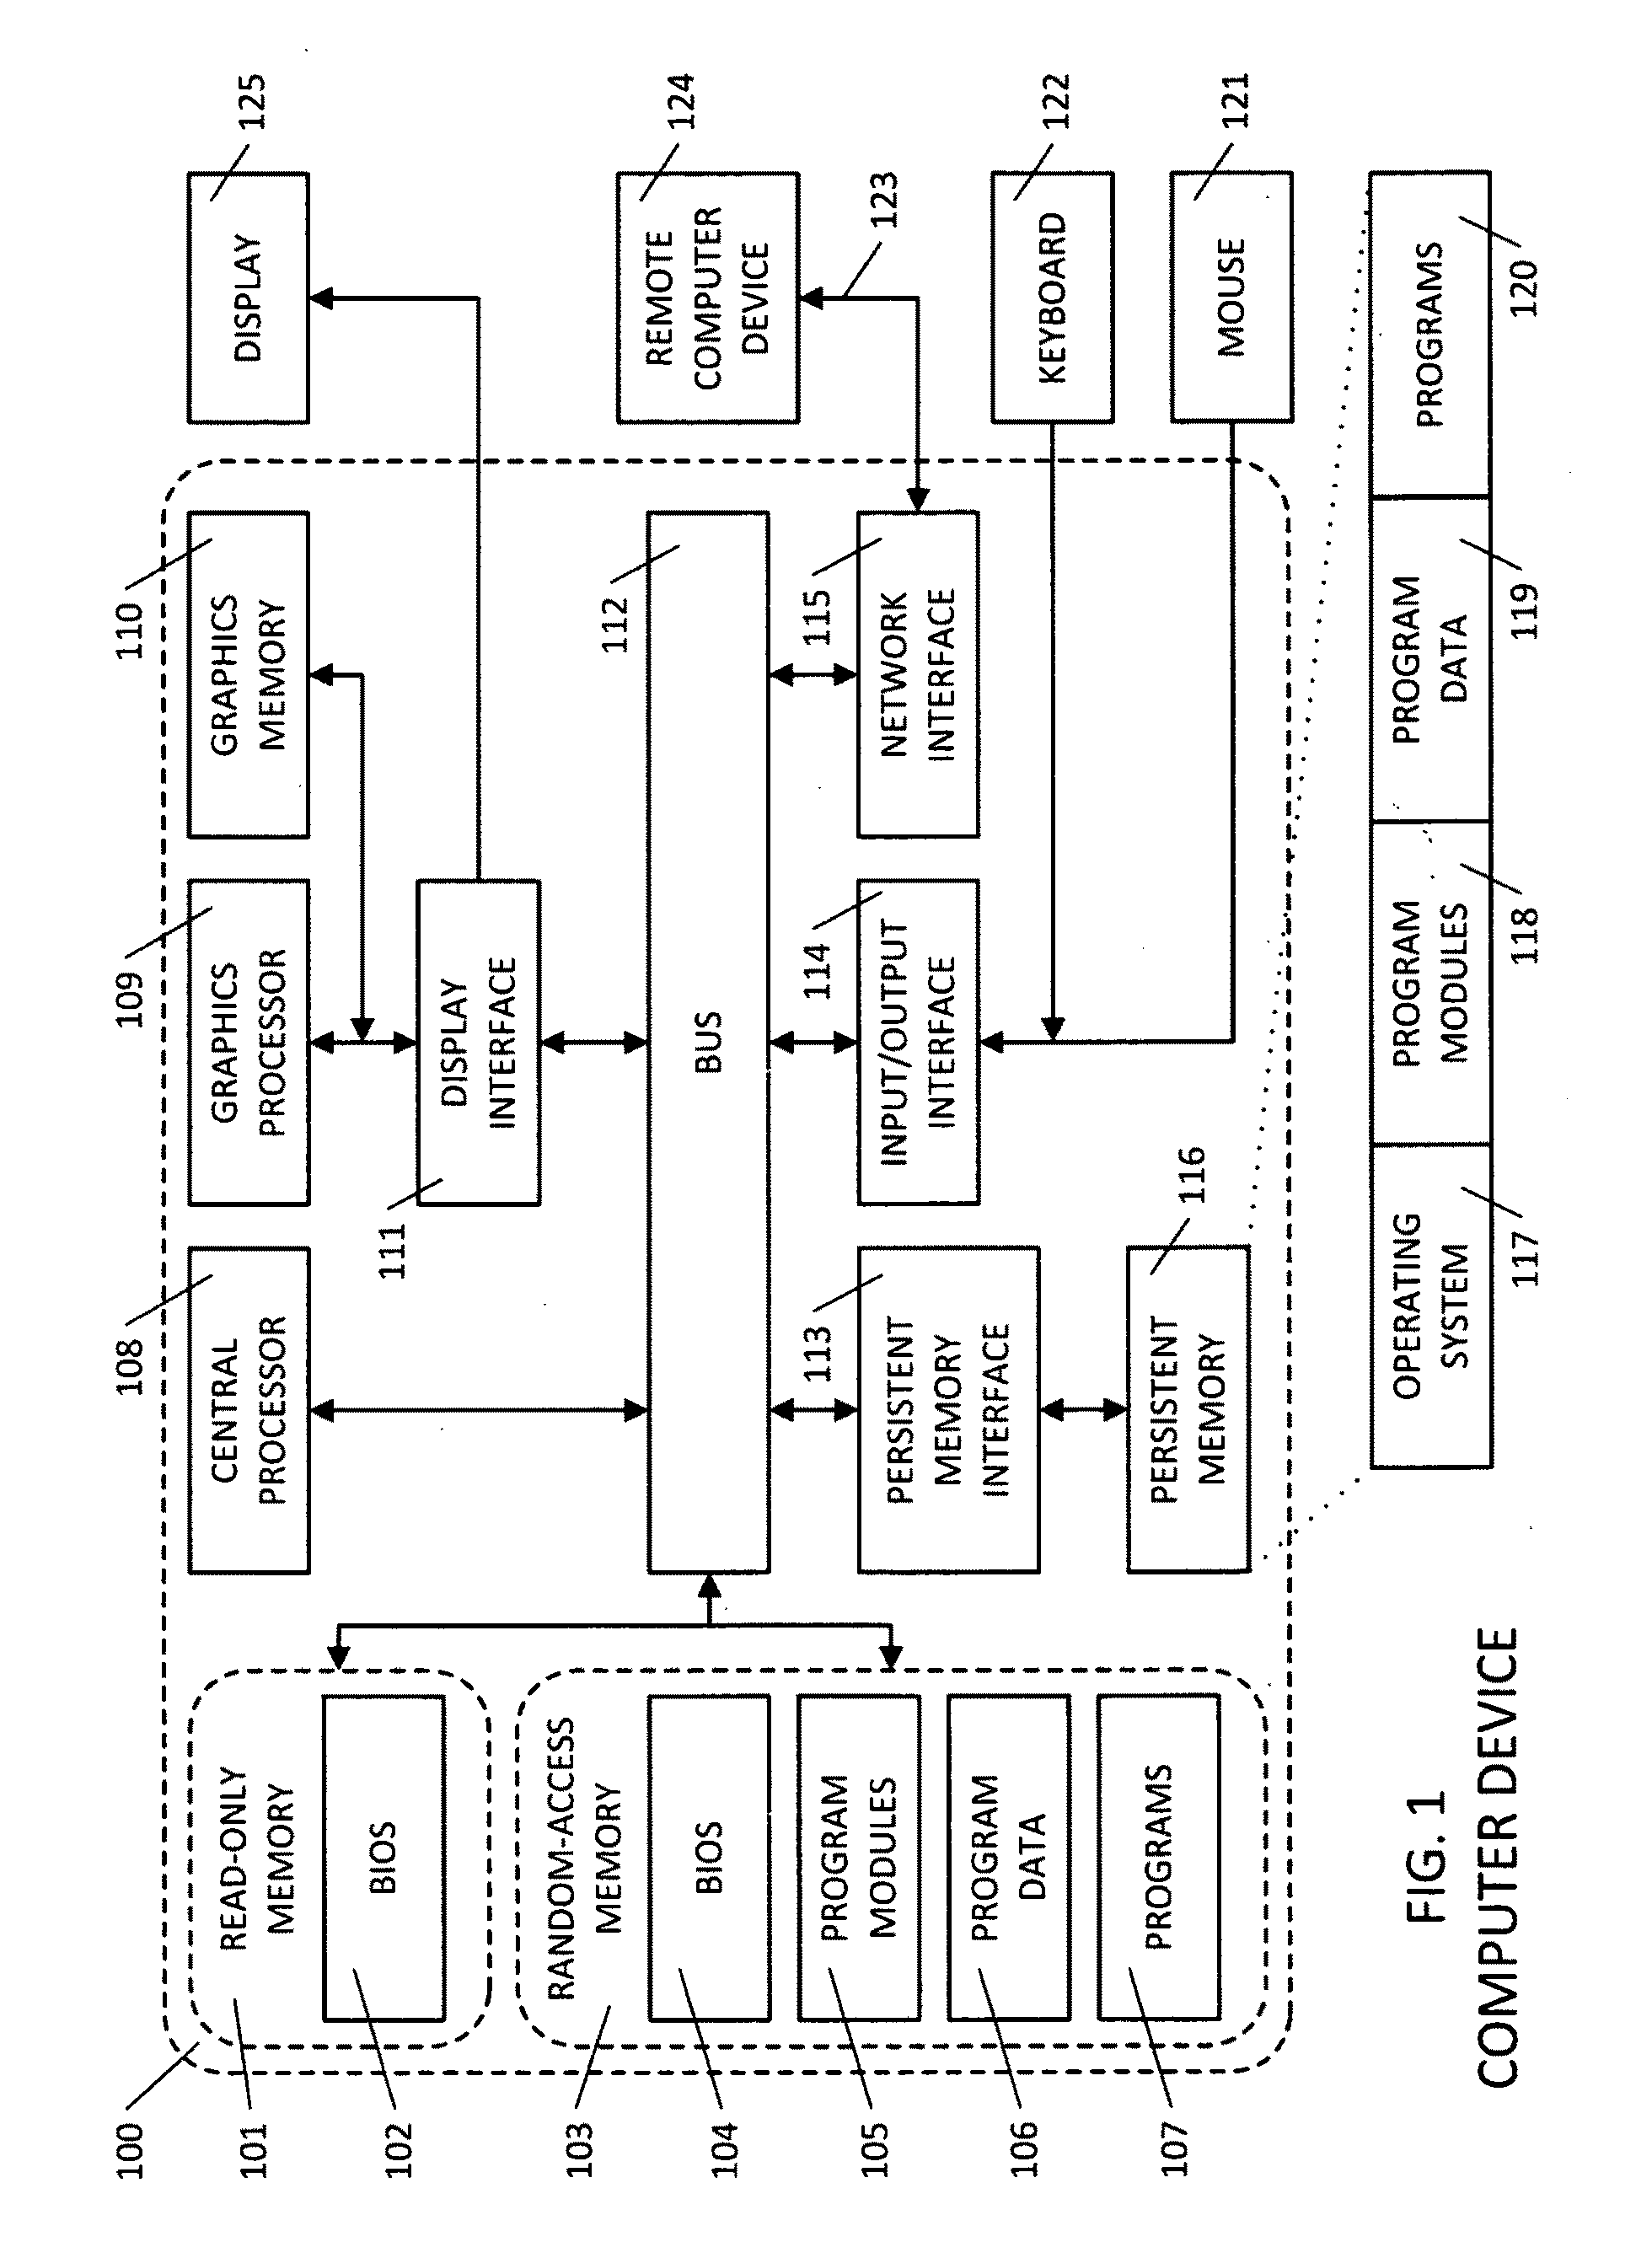
[0073]Although various embodiments of the invention may have been motivated by various deficiencies with the prior art, which may be discussed or alluded to in one or more places in the specification, the embodiments of the invention do not necessarily address any of these deficiencies. In other words, different embodiments of the invention may address different deficiencies that may be discussed in the specification. Some embodiments may only partially address some deficiencies or just one deficiency that may be discussed in the specification, and some embodiments may not address any of these deficiencies. Terms “3D” and “three-dimensional” are synonyms used interchangeably within the written specification and drawings. Drawings use the term “3D” to conserve space while the written specification uses the term “three-dimensional” for clarity and explicitness.

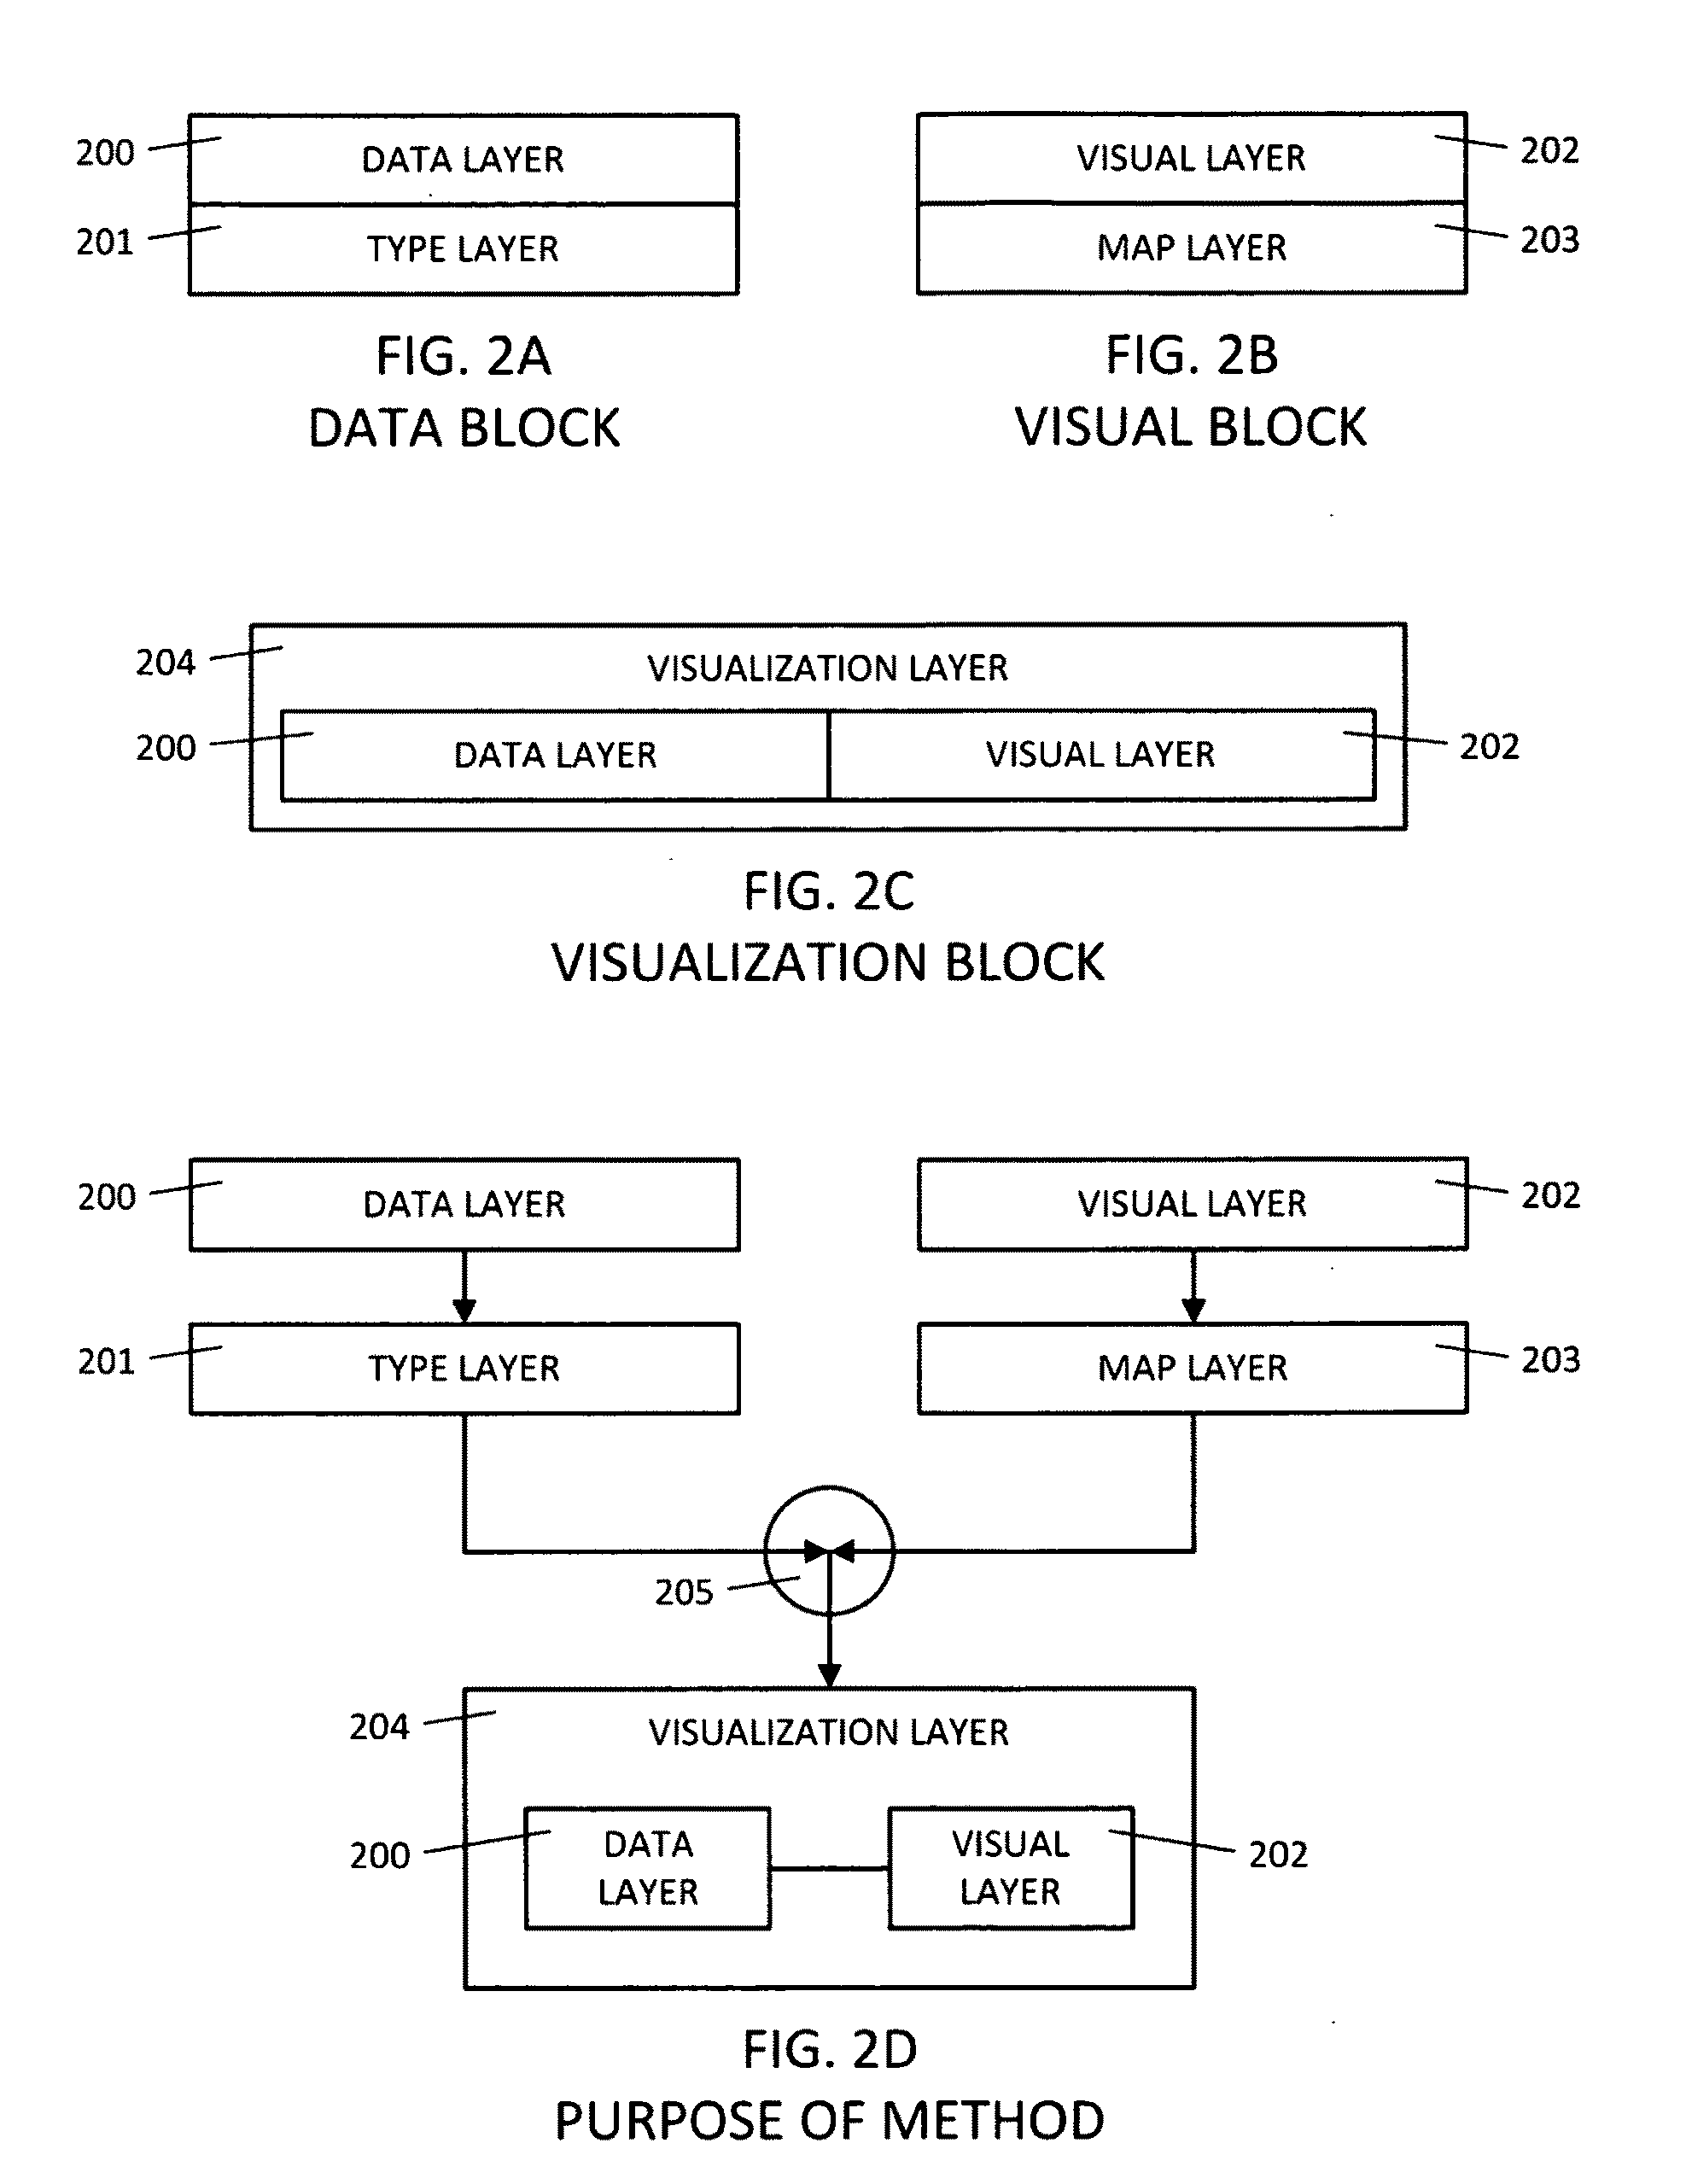
[0074]The embodiments described herein offer methods enabling a three-dimensional visualization from a data graph which may be...


PUM


Abstract

A visualization system presents inter-connected three-dimensional models representing components of a data graph to a user on a display. A visualization graph is created from the association of a user-specified data graph, which may not include graphical information, to three-dimensional models through a type graph. Arrangement of three-dimensional models into discrete units is determined from local relations between components of the data graph.

Description

CROSS-REFERENCE TO RELATED APPLICATIONS[0001]This application is a continuation of U.S. patent application Ser. No. 12 / 686,331, filed Jan. 12, 2010, by Rana Ian, entitled, “TYPED DATA GRAPH VISUALIZATION SYSTEM IN THREE DIMENSIONS,” which is incorporated herein by reference, in its entirety.STATEMENT REGARDING FEDERALLY SPONSORED RESEARCH OR DEVELOPMENT[0002]Not applicableREFERENCE TO SEQUENCE LISTING[0003]Not applicableBACKGROUND OF THE INVENTION[0004]This application pertains to visualizing data on a computer wherein an artificial workspace is created and presented to a user in such a way that it appears as a volumetric spatial region on a computer display. The subject matter discussed in the background section should not be assumed to be prior art merely as a result of its mention in the background section. Similarly, points mentioned in the background section or associated with the subject matter of the background section should not be assumed to have been previously recognized ...

Claims


Application Information

Patent Timeline
Patent Type & Authority Applications(United States)
IPC IPC(8): G06T15/00
CPCG06F3/023G06F9/44G09G2370/10G09G5/363G06T11/206
Inventor IAN, RANA
Owner IAN RANA
Why Eureka
Try Eureka