

Methods for determining risk of ventricular arrhythmia
- Summary
- Abstract
- Description
- Claims
- Application Information
AI Technical Summary
Benefits of technology
Problems solved by technology
Method used
Image

Examples
example 1
Study on SAI QRST
[0086]The study protocol was approved by the Johns Hopkins University IRB, and all patients gave written informed consent before entering the study.
[0087]Study Population
[0088]PROSE-ICD (NCT00733590) was conducted as a prospective observational multicenter cohort study of primary prevention ICD patients with both ischemic and non-ischemic cardiomyopathy. Reported study participants were recruited at the Johns Hopkins Hospital. Patients were eligible for the study if the left ventricular (LV) ejection fraction (EF) was less than or equal to 35%, myocardial infarction was at least 4 weeks old, or non-ischemic LV dysfunction was present for at least 9 months. Patients were excluded if the ICD was indicated for secondary prevention of SCD, if patient had a permanent pacemaker or a Class I indication for pacing, if the patient had NYHA (New York Heart Association) class IV, or if the patient was pregnant. Electrophysiologic testing to assess inducibility of VT was perfor...
example 2
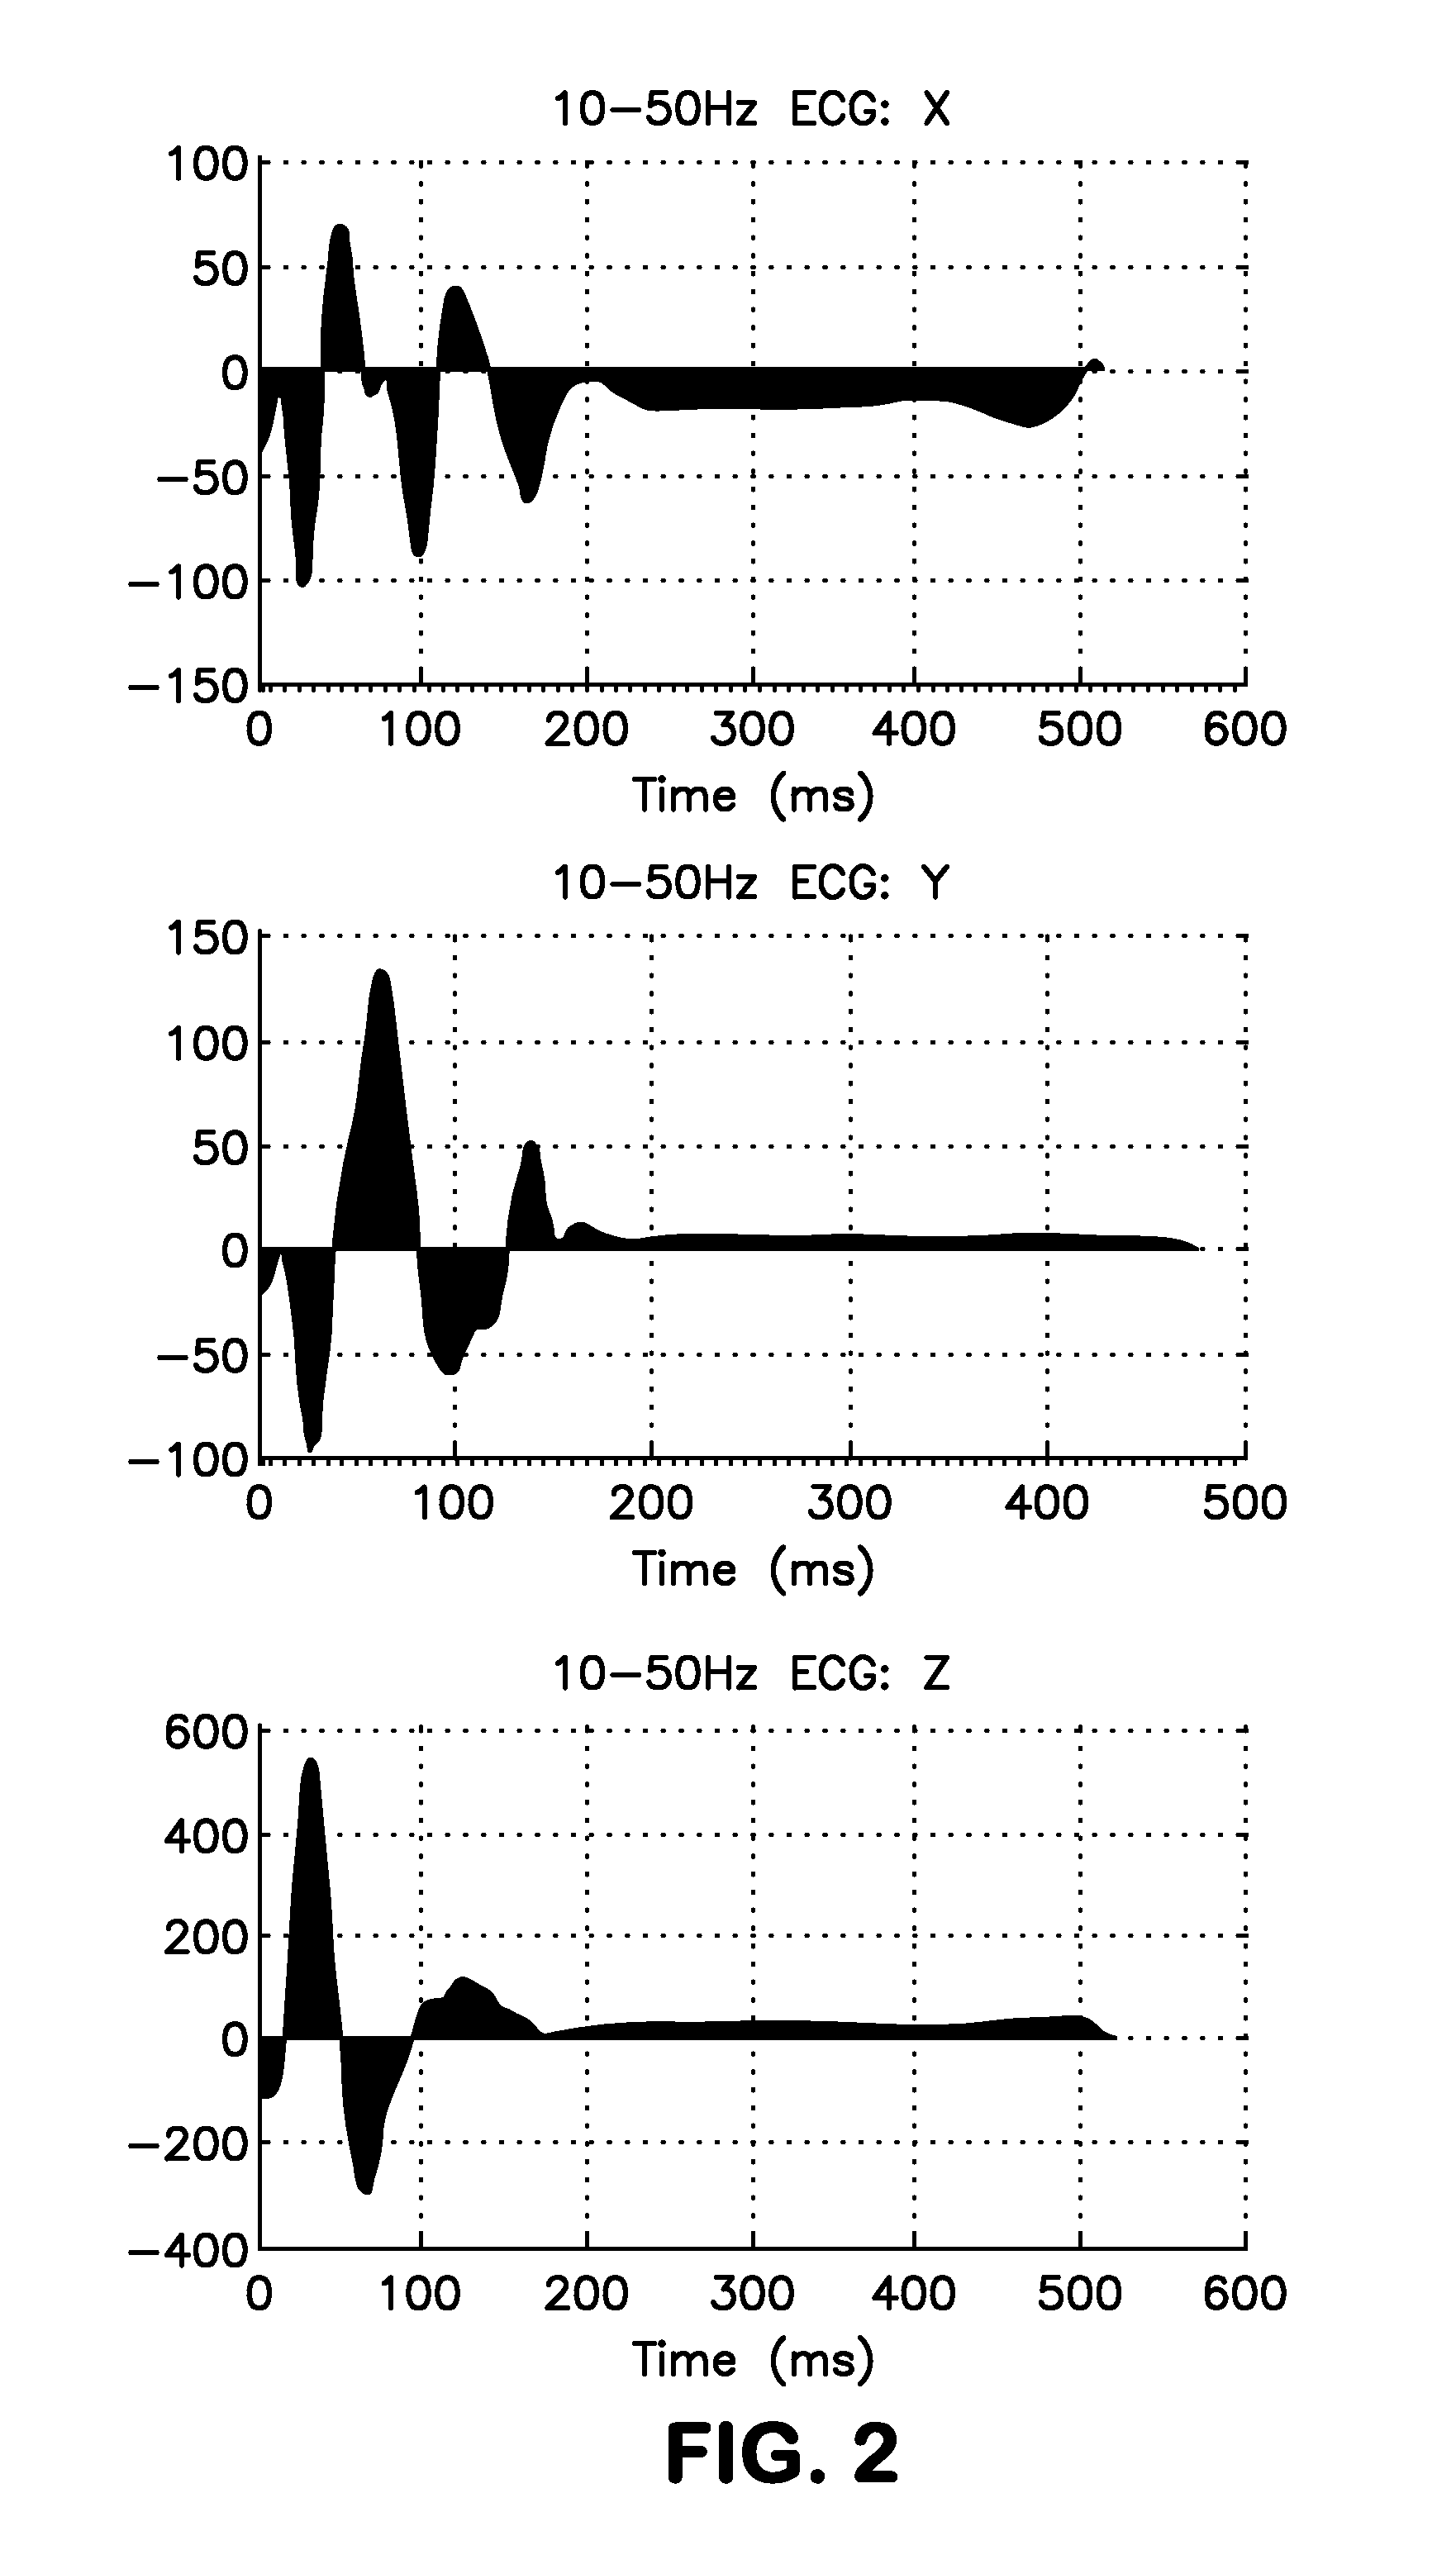
Low Frequency (10-50 Hz band) SAI QRST
SAI QRST Analysis of Systolic HF Patient Population in MADIT II Study
[0114]The MADIT II study is a known study conducted by Boston Scientific. Design and outcomes of MADIT II study are well known and results have been extensively published during the last decade (see, e.g., Moss, Eur Heart J, 24 (1): 16-18 (2003)). Briefly, 1,232 patients with documented previous myocardial infarction (MI) and EF≦30% were randomized to receive a prophylactic ICD or conventional medical therapy in a 3:2 ratio and were followed over a mean period of 20 months. Patients were excluded if they were in NYHA functional class IV at enrollment; had undergone coronary revascularization within the preceding 3 months; had MI within the past month; had advanced cerebrovascular disease; had blood urea nitrogen (BUN)>70 mg / dl or creatinine>3.0 mg / dl.
[0115]Blinded analysis of the baseline ECGs and survival analysis was performed to provide population standardized risk factors f...
example 3
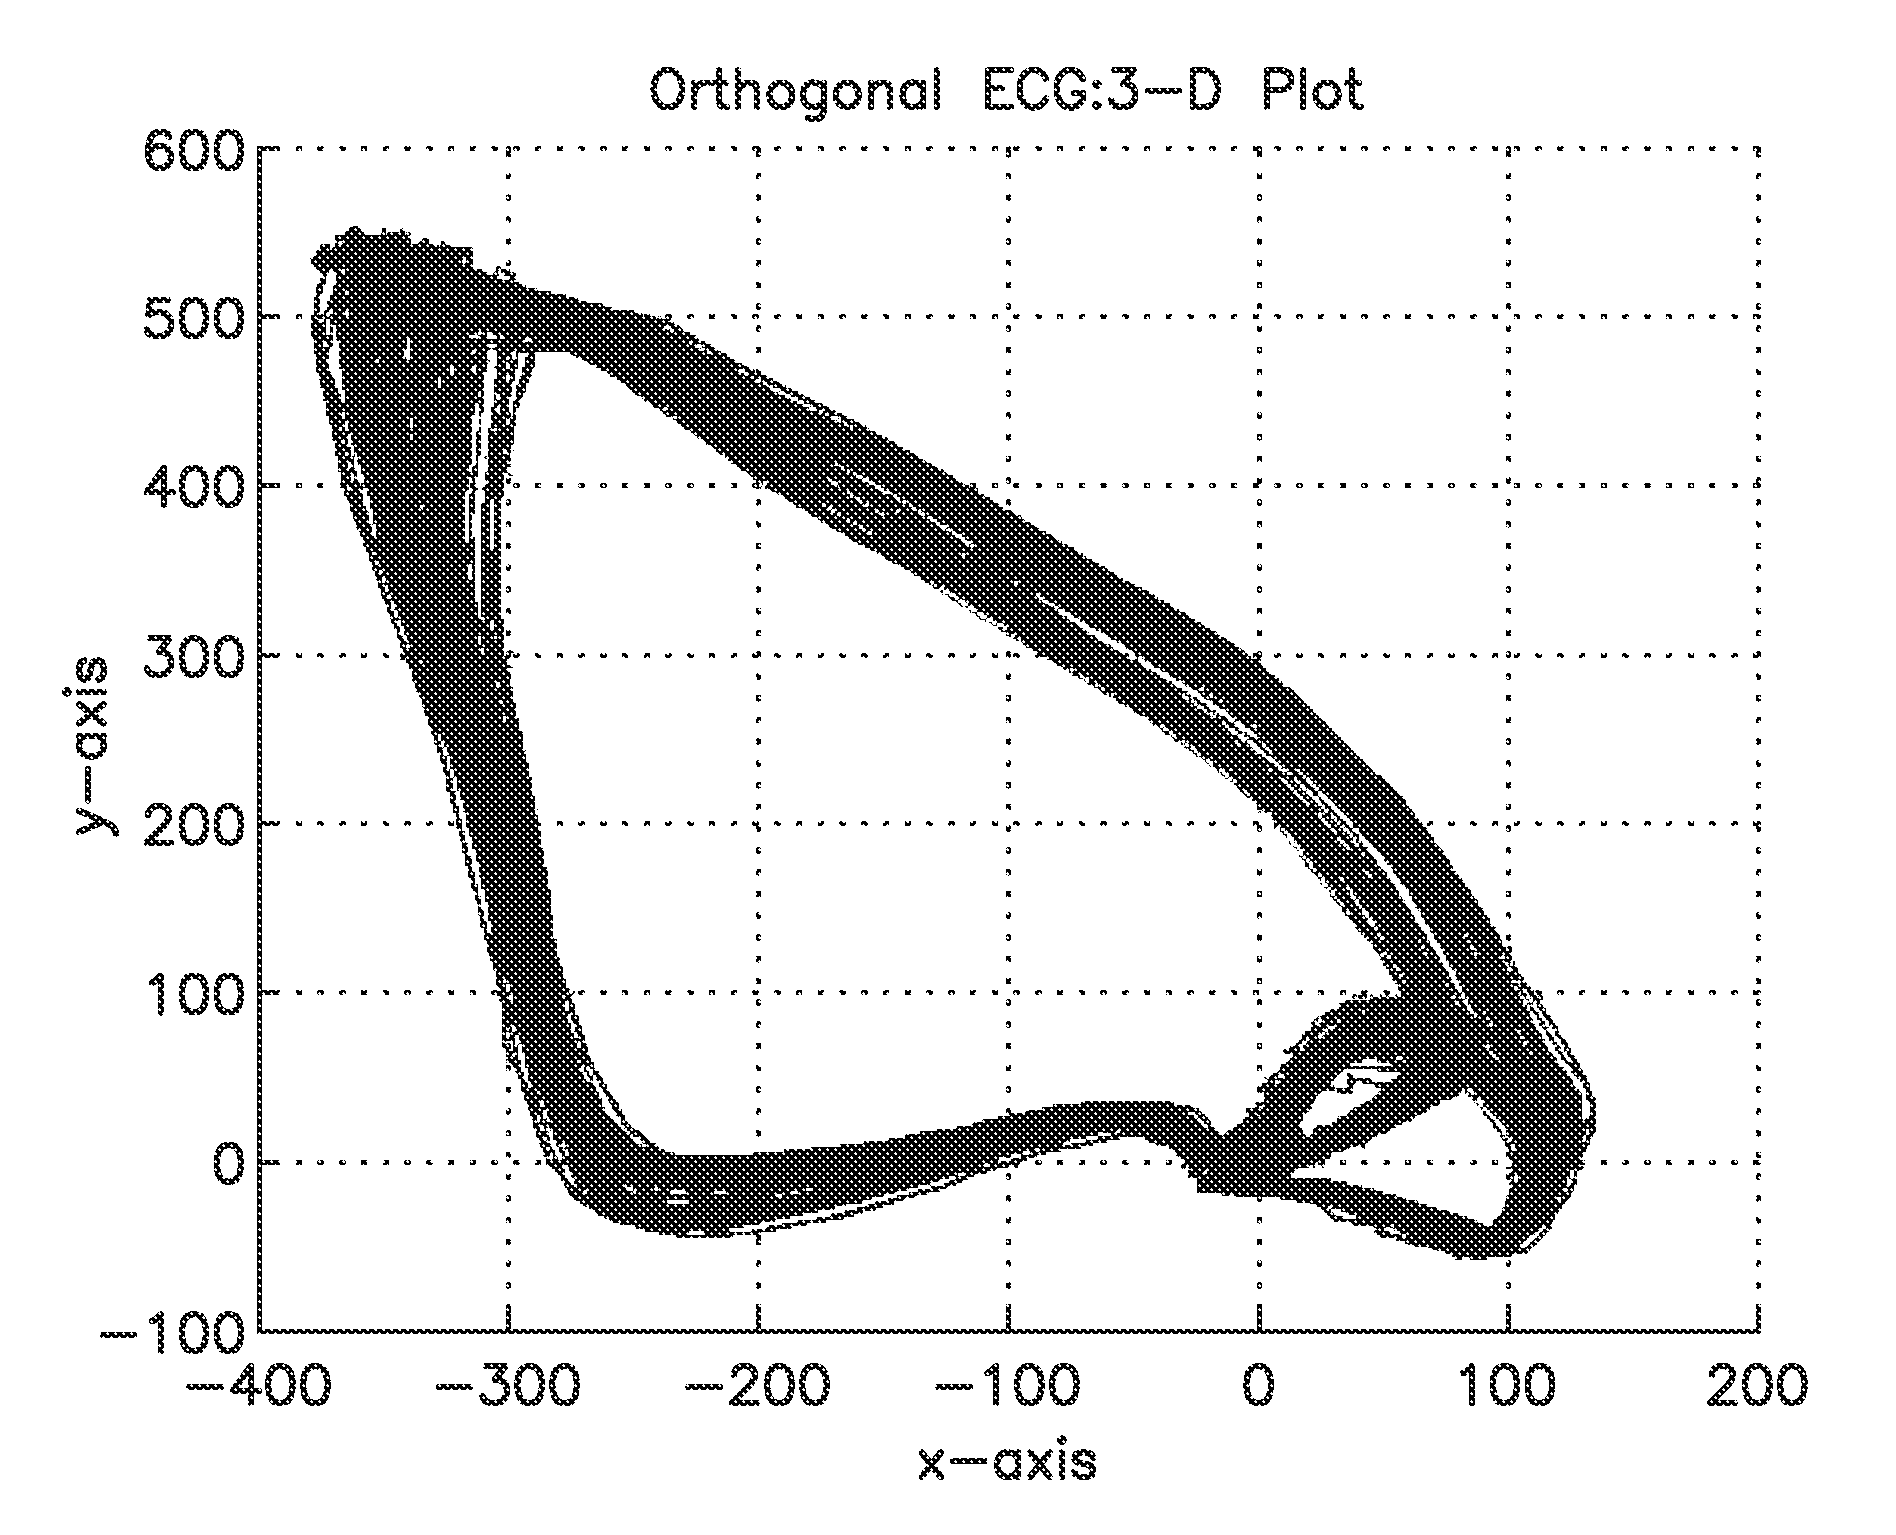
Study on Beat-to-Beat Variability of 3D ECG Cardiac Vectors
[0121]The data of 81 participants of the PROSE-ICD study (NCT00733590), discussed in Example 1 above, were analyzed. This study primarily altered the analysis of temporal variability by moving analysis from 2-dimensions to 3-dimensions. Whereas the vectorcardiography (VCG) method was proposed about a century ago, everyday use of VCG in clinical practice is limited. However, analysis in 3D can have many advantages over analysis in 2D, primarily in visualization, PVC detection, and wave detection. While peak detection is straightforward in ECGs, it can be difficult to robustly detect the beginning and end of waves, especially the T-wave. However, in 3D, it is clearer when the T-wave is leaving and when it has reached the origin point. In addition, this 3-D volume analysis can be calculated for almost all orthogonal ECGs. See, e.g., FIG. 3 for an image of waves represented as loops in 3D output from an orthogonal ECG.
[0122]Prep...
PUM
 Abstract
Description
Claims
Application Information