Customer Satisfaction Analytics System using On-Site Service Quality Evaluation

a customer satisfaction and analytics system technology, applied in the field of customer satisfaction analytics system, can solve the problems of difficult service quality improvement, difficult to understand what customers, and what dissatisfaction they have with a service experience, and achieve the effect of improving service quality

Inactive Publication Date: 2011-10-13
WILSON ROGERS ROBERT +1
View PDF31 Cites 22 Cited by
  • Summary
  • Abstract
  • Description
  • Claims
  • Application Information

AI Technical Summary

Benefits of technology

[0012]Accordingly, there is a need for a small business alternative that can collect and compile customer satisfaction data using reliable analytics, revealing possible areas for improvement of service quality.

Problems solved by technology

In practice, getting from satisfying customers to increased profitability is difficult, because service quality is variable.
A satisfying experience one day can easily go wrong on another: changing customer expectations and internal breakdowns are common everyday occurrences in many service organizations.
Trying to understand what customers expect to receive and what dissatisfies them about a service experience can be hard.
Customers are reluctant to give constructive criticism when they are dissatisfied and more likely to share a negative experience with friends.
Negative word of mouth can have disastrous consequences.
Small businesses like dentists and other professionals, spas and salons do not typically manage by fact or customer satisfaction data.
While entrepreneurs recognize the importance of listening to the voice of their customers to understand their expectations, and their proficiency in meeting them, many are reluctant to ask for feedback.
However, the response rate is low, and the surveys are not designed to identify and fix weaknesses in a service product.
Prior art e-mail or internet based surveys do not generate representative, reliable and accurate response.
Surveys that are not administered immediately following a service transaction rarely deliver a reliable statistical sample.
Furthermore, previous survey systems do not identify a particular service weakness.
Technical language and complicated scoring often result in incomplete or inaccurate data.
Answers are not always easy to translate into numbers or statistics against which comparisons can be made.
Isolating a service deficiency without knowing how different locations, services or staff members are performing is impossible.
Assessing the severity of a problem without a point of comparison is generally not possible.
In some cases, it can result in action being taken on a problem that does not exist or problems needing attention being completely overlooked.

Method used


Image

  • Customer Satisfaction Analytics System using On-Site Service Quality Evaluation
  • Customer Satisfaction Analytics System using On-Site Service Quality Evaluation
  • Customer Satisfaction Analytics System using On-Site Service Quality Evaluation

Examples


example

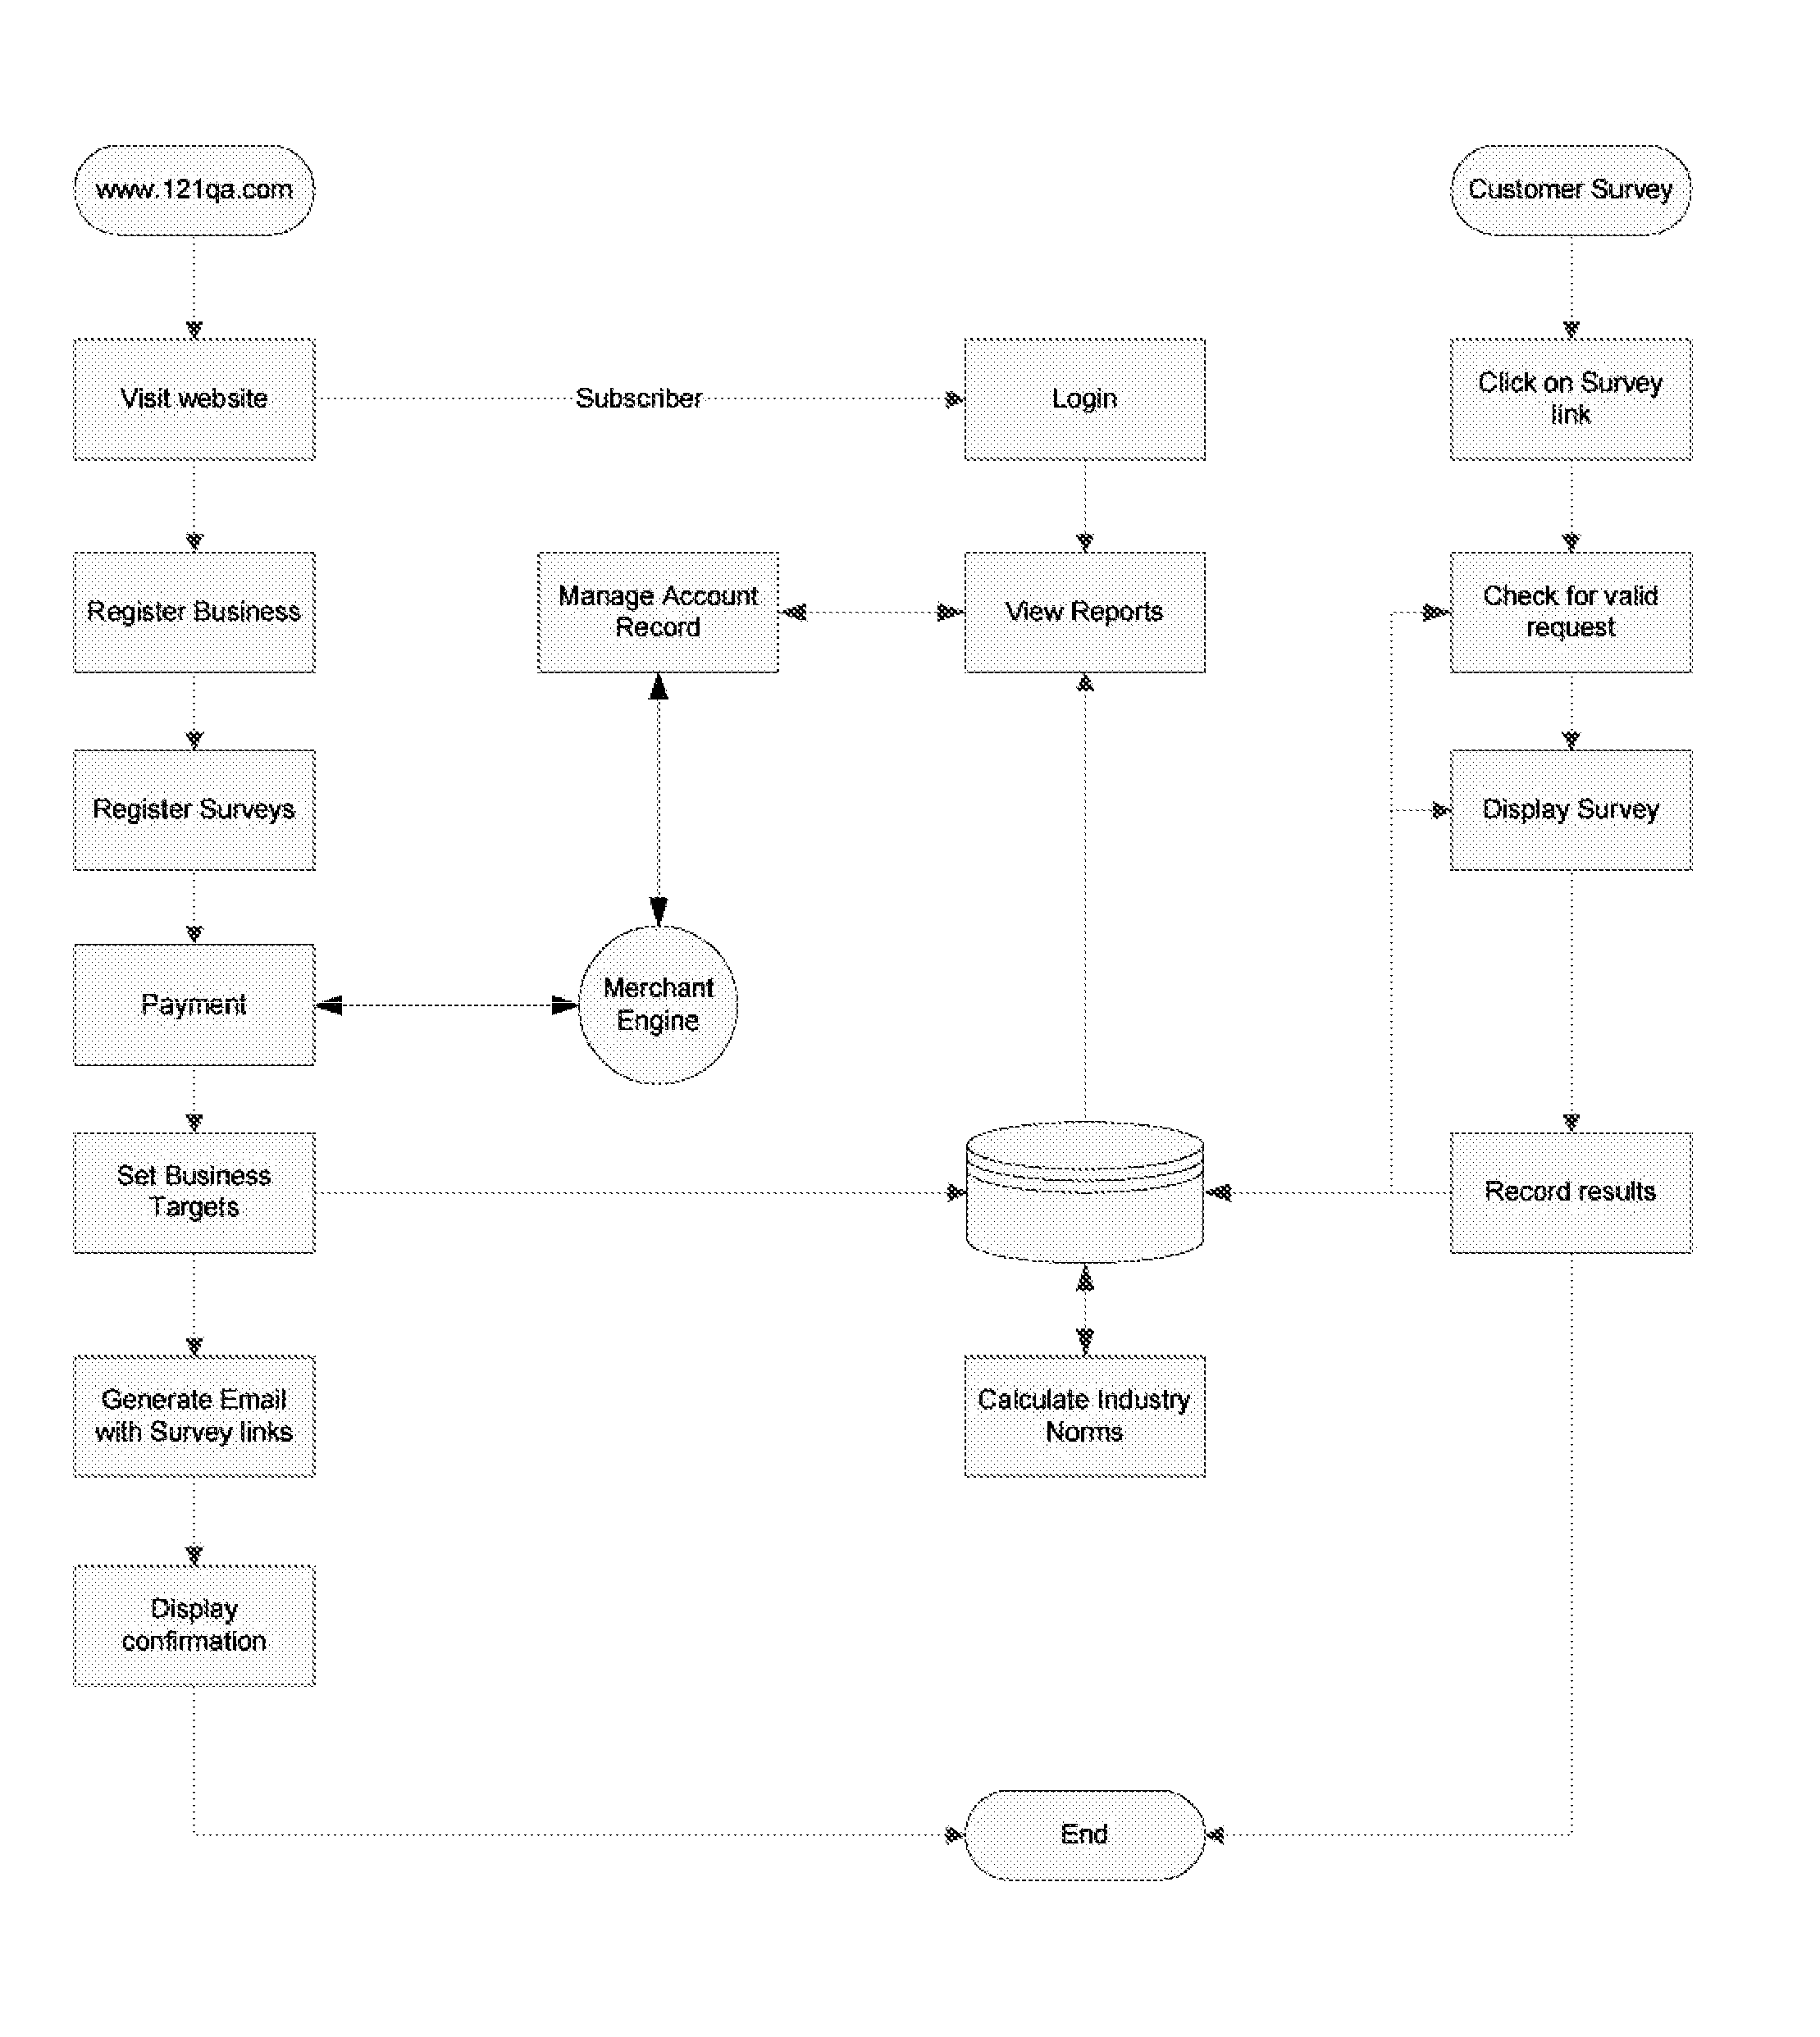
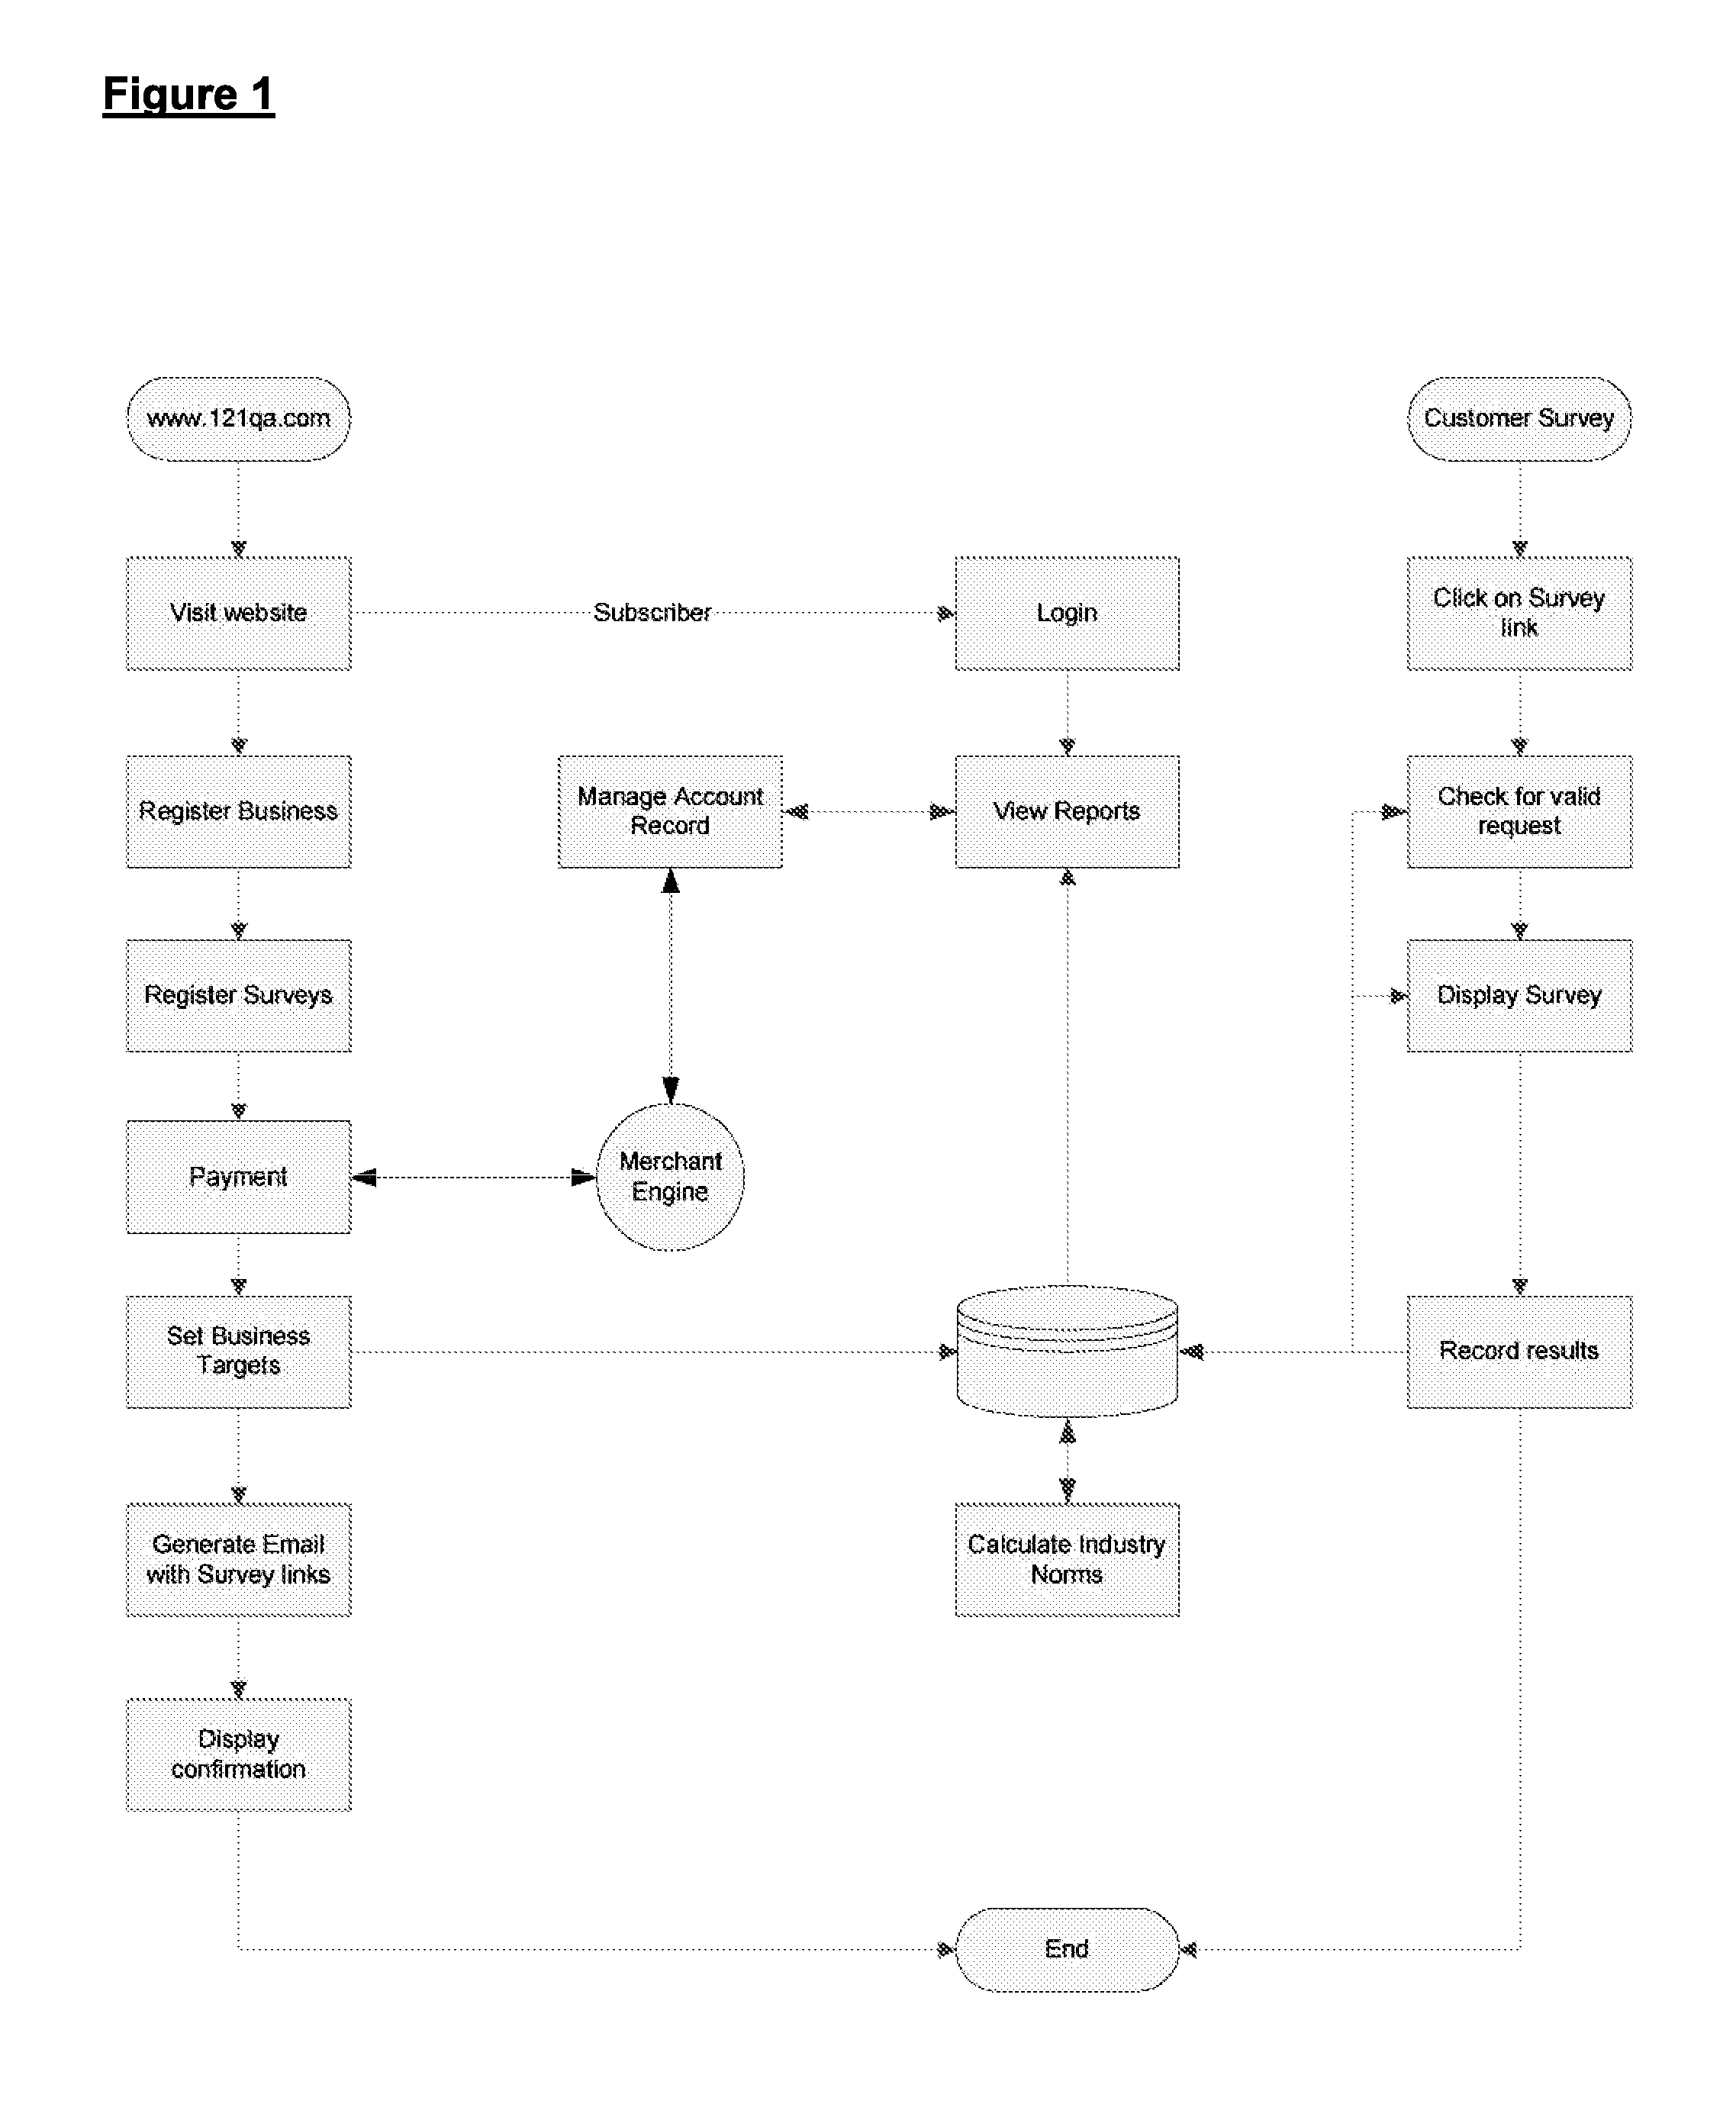
[0076]By way of illustration, a working prototype of this invention has been created, for access by user organizations under the trademark 121QA. The working prototype uses 2.0 web components and recognized standards. Organizations may subscribe to the system through the internet. Once registration is complete, the organization may access the various databases and begin surveying their customers. The quality assessment ensues from scoring the 25 metrics referred to earlier.

[0077]FIG. 1 shows the overall architecture of the 121QA™ system. User organizations gain access over the internet by way of the procedure shown on the left. The organization is registered as a user, and selects surveys it wishes to have run (the industry as a whole, industry subdivisions, different service providers, and so on). Payment is a monthly $10.00 fee for each survey currently under way, plus a single $49.95 system access fee, which sets up a survey database partition and reporting protocol (collectively...


PUM


Abstract

This invention provides a service quality monitoring and improvement system. It is designed so that a number of different organizations or service providers can use the system simultaneously to obtain satisfaction data from customers and highlight areas for improvement. Customer satisfaction data is conducted at the site where the service or product is provided, to improve the response rate and data quality. For each user organization, the apparatus provides focused questions or information to improve service quality that are selected on the basis of feedback from their own customers. By using the system and making improvements in the areas identified, each user organization may improve the quality of the service it provides—leading to a wider customer base and improved profitability.

Description

RELATED APPLICATIONS[0001]This application claims priority under Article 4 of the Paris Convention for the Protection of Industrial Property to a Canadian patent application having the same title and inventors, filed by 121QA Inc. on or about Apr. 9, 2010.TECHNICAL FIELD[0002]This invention provides devices and technology for surveying and assessing customer satisfaction data for the purpose of improving the quality of service or products provided by an organization.BACKGROUND[0003]Since 1985, there has been extensive research done on how service quality affects customer satisfaction, and how satisfaction in turn affects customer loyalty. The conclusion is that customer satisfaction develops when the quality of a service experience exceeds what customers expect to receive. Customer satisfaction leads to a greater affinity with the provider, future intent to repurchase and the predisposition to recommend the service to others. Service providers with high rates of customer satisfactio...

Claims


Application Information

Patent Timeline
Patent Type & Authority Applications(United States)
IPC IPC(8): G06Q10/00
CPCG06Q30/0201G06Q30/02
Inventor WILSON ROGERS, ROBERTSEGATORE, MILENA
Owner WILSON ROGERS ROBERT
Why Eureka
Try Eureka