Predictive modeling

a prediction model and modeling technology, applied in the field of prediction modeling, can solve the problems of noisy training set of examples, inaccurate reflection, and often not being the case, and achieve the effect of computational efficiency

Inactive Publication Date: 2012-06-21
IBM CORP
View PDF18 Cites 32 Cited by
  • Summary
  • Abstract
  • Description
  • Claims
  • Application Information

AI Technical Summary

Benefits of technology

[0013]It is an object of the invention to provide a predictive modeling method which is capable of generating an optimal distribution based on a set of training data describing the relationship between indicators and values, and also incorporates constraints imposed by a given distribution of indicators. The method should be computationally efficient and should be capable of ensuring confidentiality of the source data.

Problems solved by technology

This is, however, often not the case.
Moreover, the training set of examples may be noisy; in this case, adapting the model perfectly to the training data would lead to “over-fitting” and would yield a model that does not accurately reflect the “true” distributions P(X), P(Y|X).
If, for example, a model predicting the spread of a given disease is to be generated, the training data may be erroneous since only a small fraction of the people testing positive may have been identified while it is known that the actual percentage is much higher.
Using a single, global model in all of these situations would have severe disadvantages:For one thing, the model would probably not be optimal in the sense of structural risk, as some cases may occur much more often in reality than in the training set and therefore should be given a higher attention than others.Moreover, the model would probably be quite complex, even though in the application area only a small portion of the model may be relevant.
This approach, however, requires a severe computational effort and, in the majority of cases, involves prohibitively long response times which renders the task non-interactive and does not allow the user to interactively try out different assumptions about the “true” distribution P(X).
Also, it poses a security risk organizationally, since everybody who employs the model and adapts it to a new application would need to obtain access to the actual source data.

Method used


Image

  • Predictive modeling
  • Predictive modeling
  • Predictive modeling

Examples


Embodiment Construction

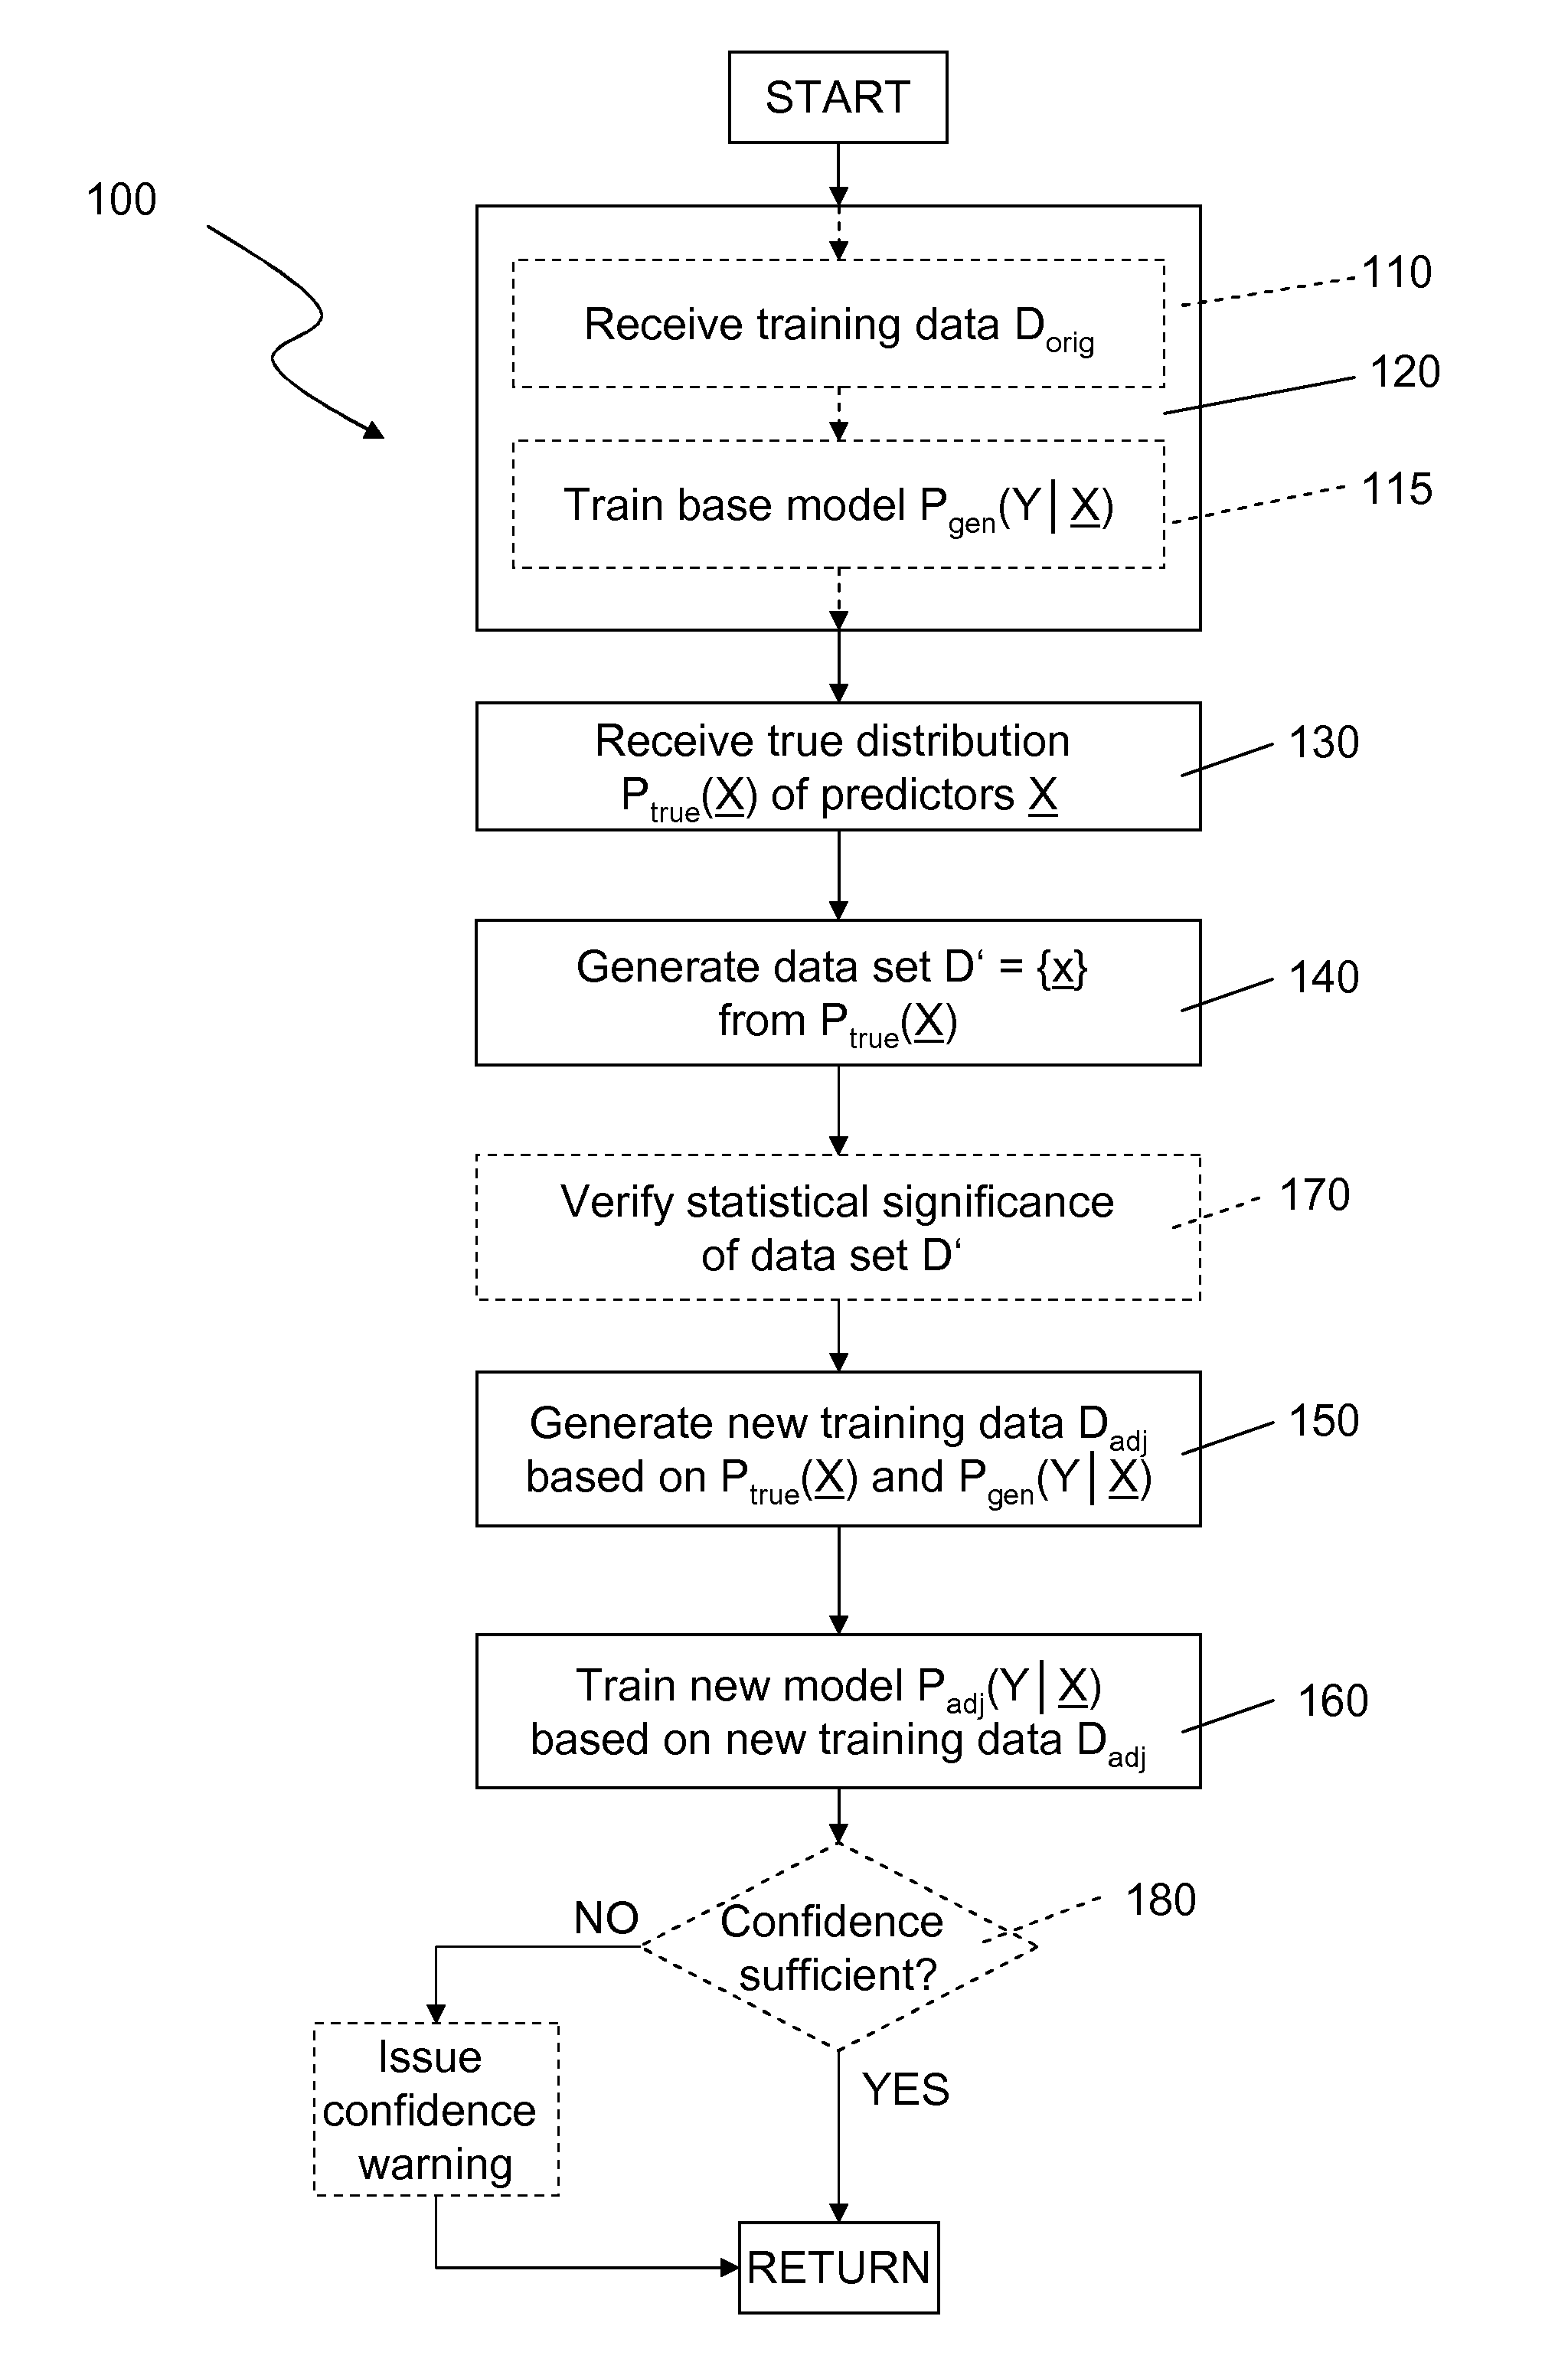
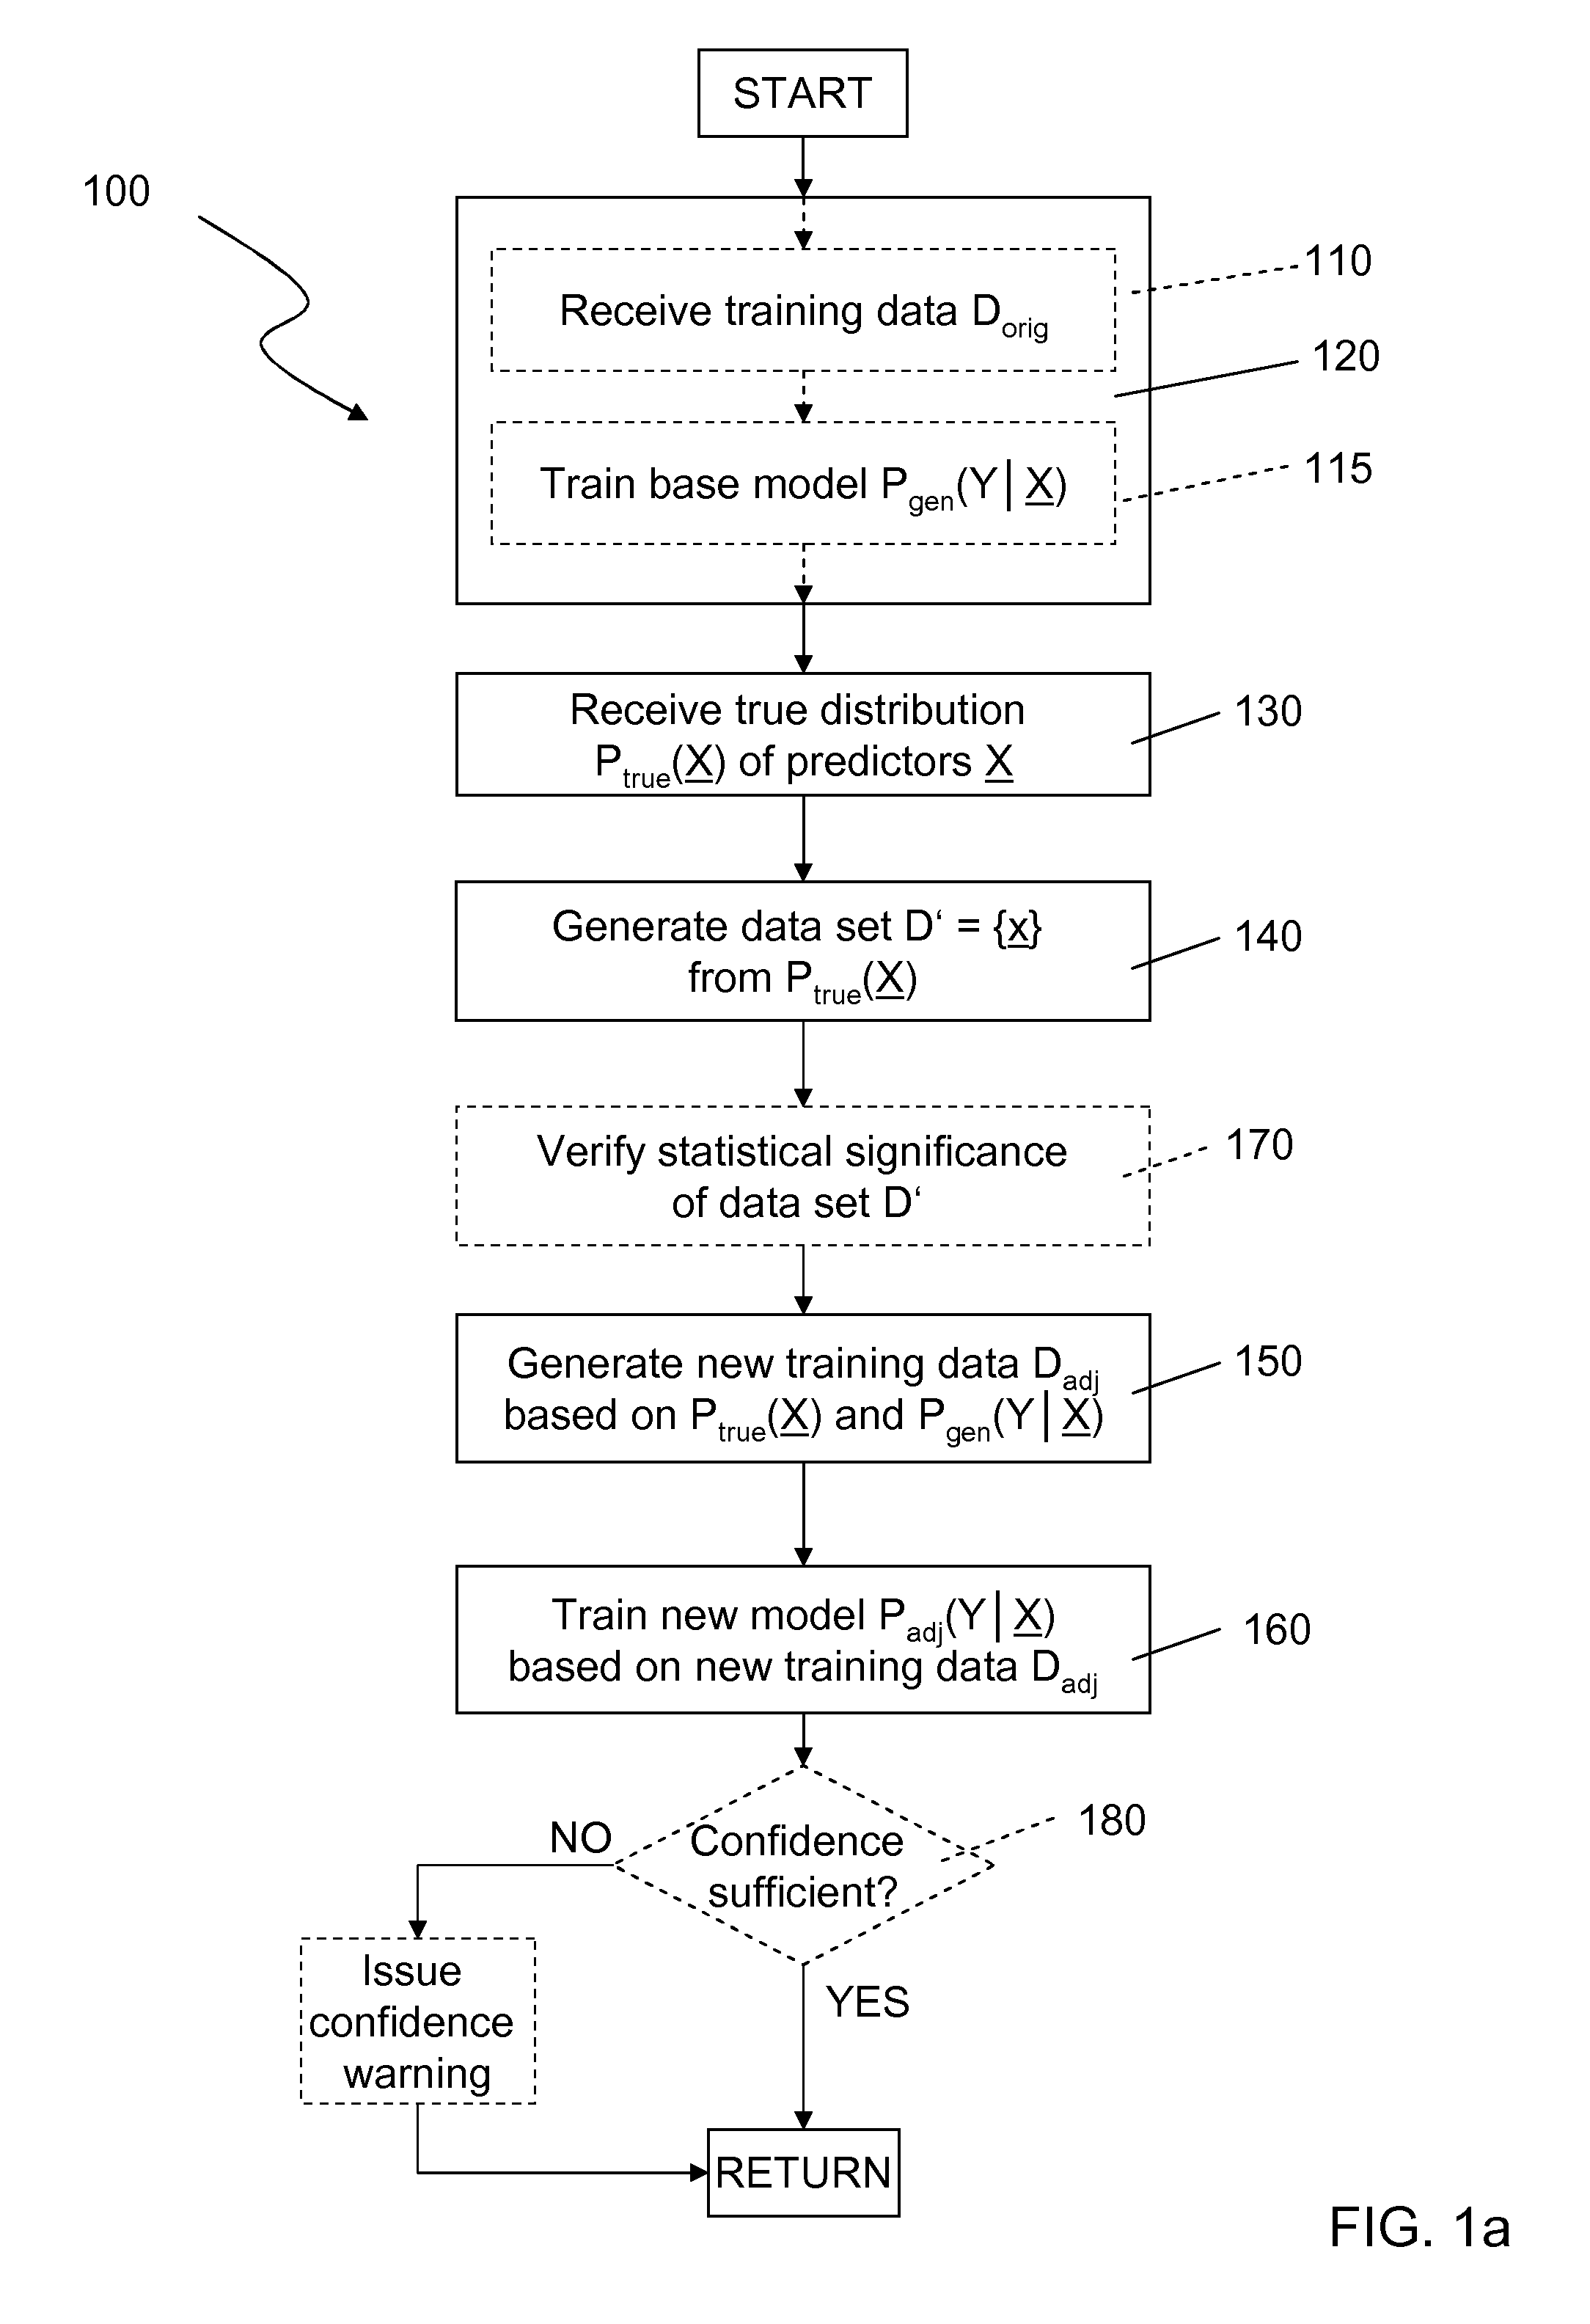
[0025]FIG. 1a depicts a schematic flow diagram of a method 100 for determining a probability distribution P(Y|X) which predicts the probability of a specific outcome Y given a predefined set of features X. Here, X denotes a vector of variables (indicators) that describe influence factors and a single variable Y (value) that describes the prediction. Note that in the following, the variable X will be referred to by the terms “feature”, “predictor” and “indicator” interchangeably, and the variable Y will be referred to by the terms “value”, “label” or “prediction”. All variables can be numeric or categorical. If the value variable Y is categorical, the method solves a classification problem, if it is numerical, it solves a regression problem. Both cases can be treated in a similar fashion.

[0026]The modeling process is based on an original set Dorig of training data; Dorig contains tuples of the form (x,y) where xεX (i.e. x is an element of the set of indicators) and yεY (i.e. y is an ...


PUM


Abstract

A predictive analysis generates a predictive model (Padj(Y|X)) based on two separate pieces of information,
    • a set of original training data (Dorig), and
    • a “true” distribution of indicators (Ptrue(X)).
The predictive analysis begins by generating a base model distribution (Pgen(Y|X)) from the original training data set (Dorig) containing tuples (x,y) of indicators (x) and corresponding labels (y). Using the “true” distribution (Ptrue(X)) of indicators, a random data set (D′) of indicator records (x) is generated reflecting this “true” distribution (Ptrue(X)). Subsequently, the base model (Pgen(Y|X)) is applied to said random data set (D′), thus assigning a label (y) or a distribution of labels to each indicator record (x) in said random data set (D′) and generating an adjusted training set (Dadj). Finally, an adjusted predictive model (Padj(Y|X)) is trained based on said adjusted training set (Dadj).

Description

CROSS-REFERENCE TO RELATED FOREIGN APPLICATION[0001]This application is a non-provisional application that claims priority benefits under Title 35, Unites States Code, Section 119(a)-(d) or Section 365(b) of European (EP) Patent Application No. 10196088.8, filed on Dec. 21, 2010, by Christoph Lingenfelder, Pascal Pompey, and Michael Wurst, which application is incorporated herein by reference in its entirety.FIELD OF THE INVENTION[0002]The invention relates generally to predictive modeling. Specifically, the invention relates to adapting an existing predictive model generated from a set of training data to additional information such as a given probability distribution of features.BACKGROUND OF THE INVENTION[0003]Predictive modeling is the process by which a model is created or chosen to try to best predict the probability of an outcome. Generally, the model is chosen on the basis of detection theory to try to guess the probability of an outcome given a set amount of input data (for...

Claims


Application Information

Patent Timeline
Patent Type & Authority Applications(United States)
IPC IPC(8): G06N5/00
CPCG06F17/18G06N7/005G06K9/6277G06K9/6256G06N7/01G06F18/2415G06F18/214
Inventor LINGENFELDER, CHRISTOPHPOMPEY, PASCALWURST, MICHAEL
Owner IBM CORP
Why Eureka
Try Eureka