
Ethernet traffic statistics and analysis method and system

Inactive Publication Date: 2012-10-18
ZTE CORP
View PDF20 Cites 14 Cited by
  • Summary
  • Abstract
  • Description
  • Claims
  • Application Information

AI Technical Summary

Benefits of technology

[0006]In view of the above, the present invention provides an Ethernet traffic statistics and analysis method and system so that a current state of a link can be reflected accurately and a fault position can be located quickly.
[0020]In accordance with the Ethernet traffic statistics and analysis method and system provided by the present invention, according to two pieces of port traffic information reported continuously by each of two traffic analyzed nodes which are connected to any one link and a reporting time interval, a traffic analyzing node counts traffic of packets passing through the link, traffic of lost packets and corresponding rates, and constructs an analytic diagram according to the rate of the traffic of the lost packets counted every time. In this way, statistics and analysis can be performed for the traffic on the link in the Ethernet. The current state of the link, i.e. information such as sent and received packets and lost packets etc. on the link, can be reflected accurately to better learn the traffic distribution of the Ethernet. In addition, when a fault occurs or a packet is lost on the link, the fault position can be quickly located and the fault impact can be accurately evaluated, which is in favor of improving the management and maintenance efficiencies.

Problems solved by technology

However, the Ethernet traffic statistics and analysis methods in the existing technology can only analyze the traffic information of a node port and fail to analyze the corresponding data of a link, thus the actual traffic of the network cannot be reflected accurately.
However, the decrease in the traffic rate may be caused by normally decreased transmitting and receiving flows of users.
Network abnormality cannot be observed in FIG. 4, however a fault has already occurred in the communication between Node S1 and Node S2.

Method used


Image

  • Ethernet traffic statistics and analysis method and system
  • Ethernet traffic statistics and analysis method and system
  • Ethernet traffic statistics and analysis method and system

Examples


embodiment 1

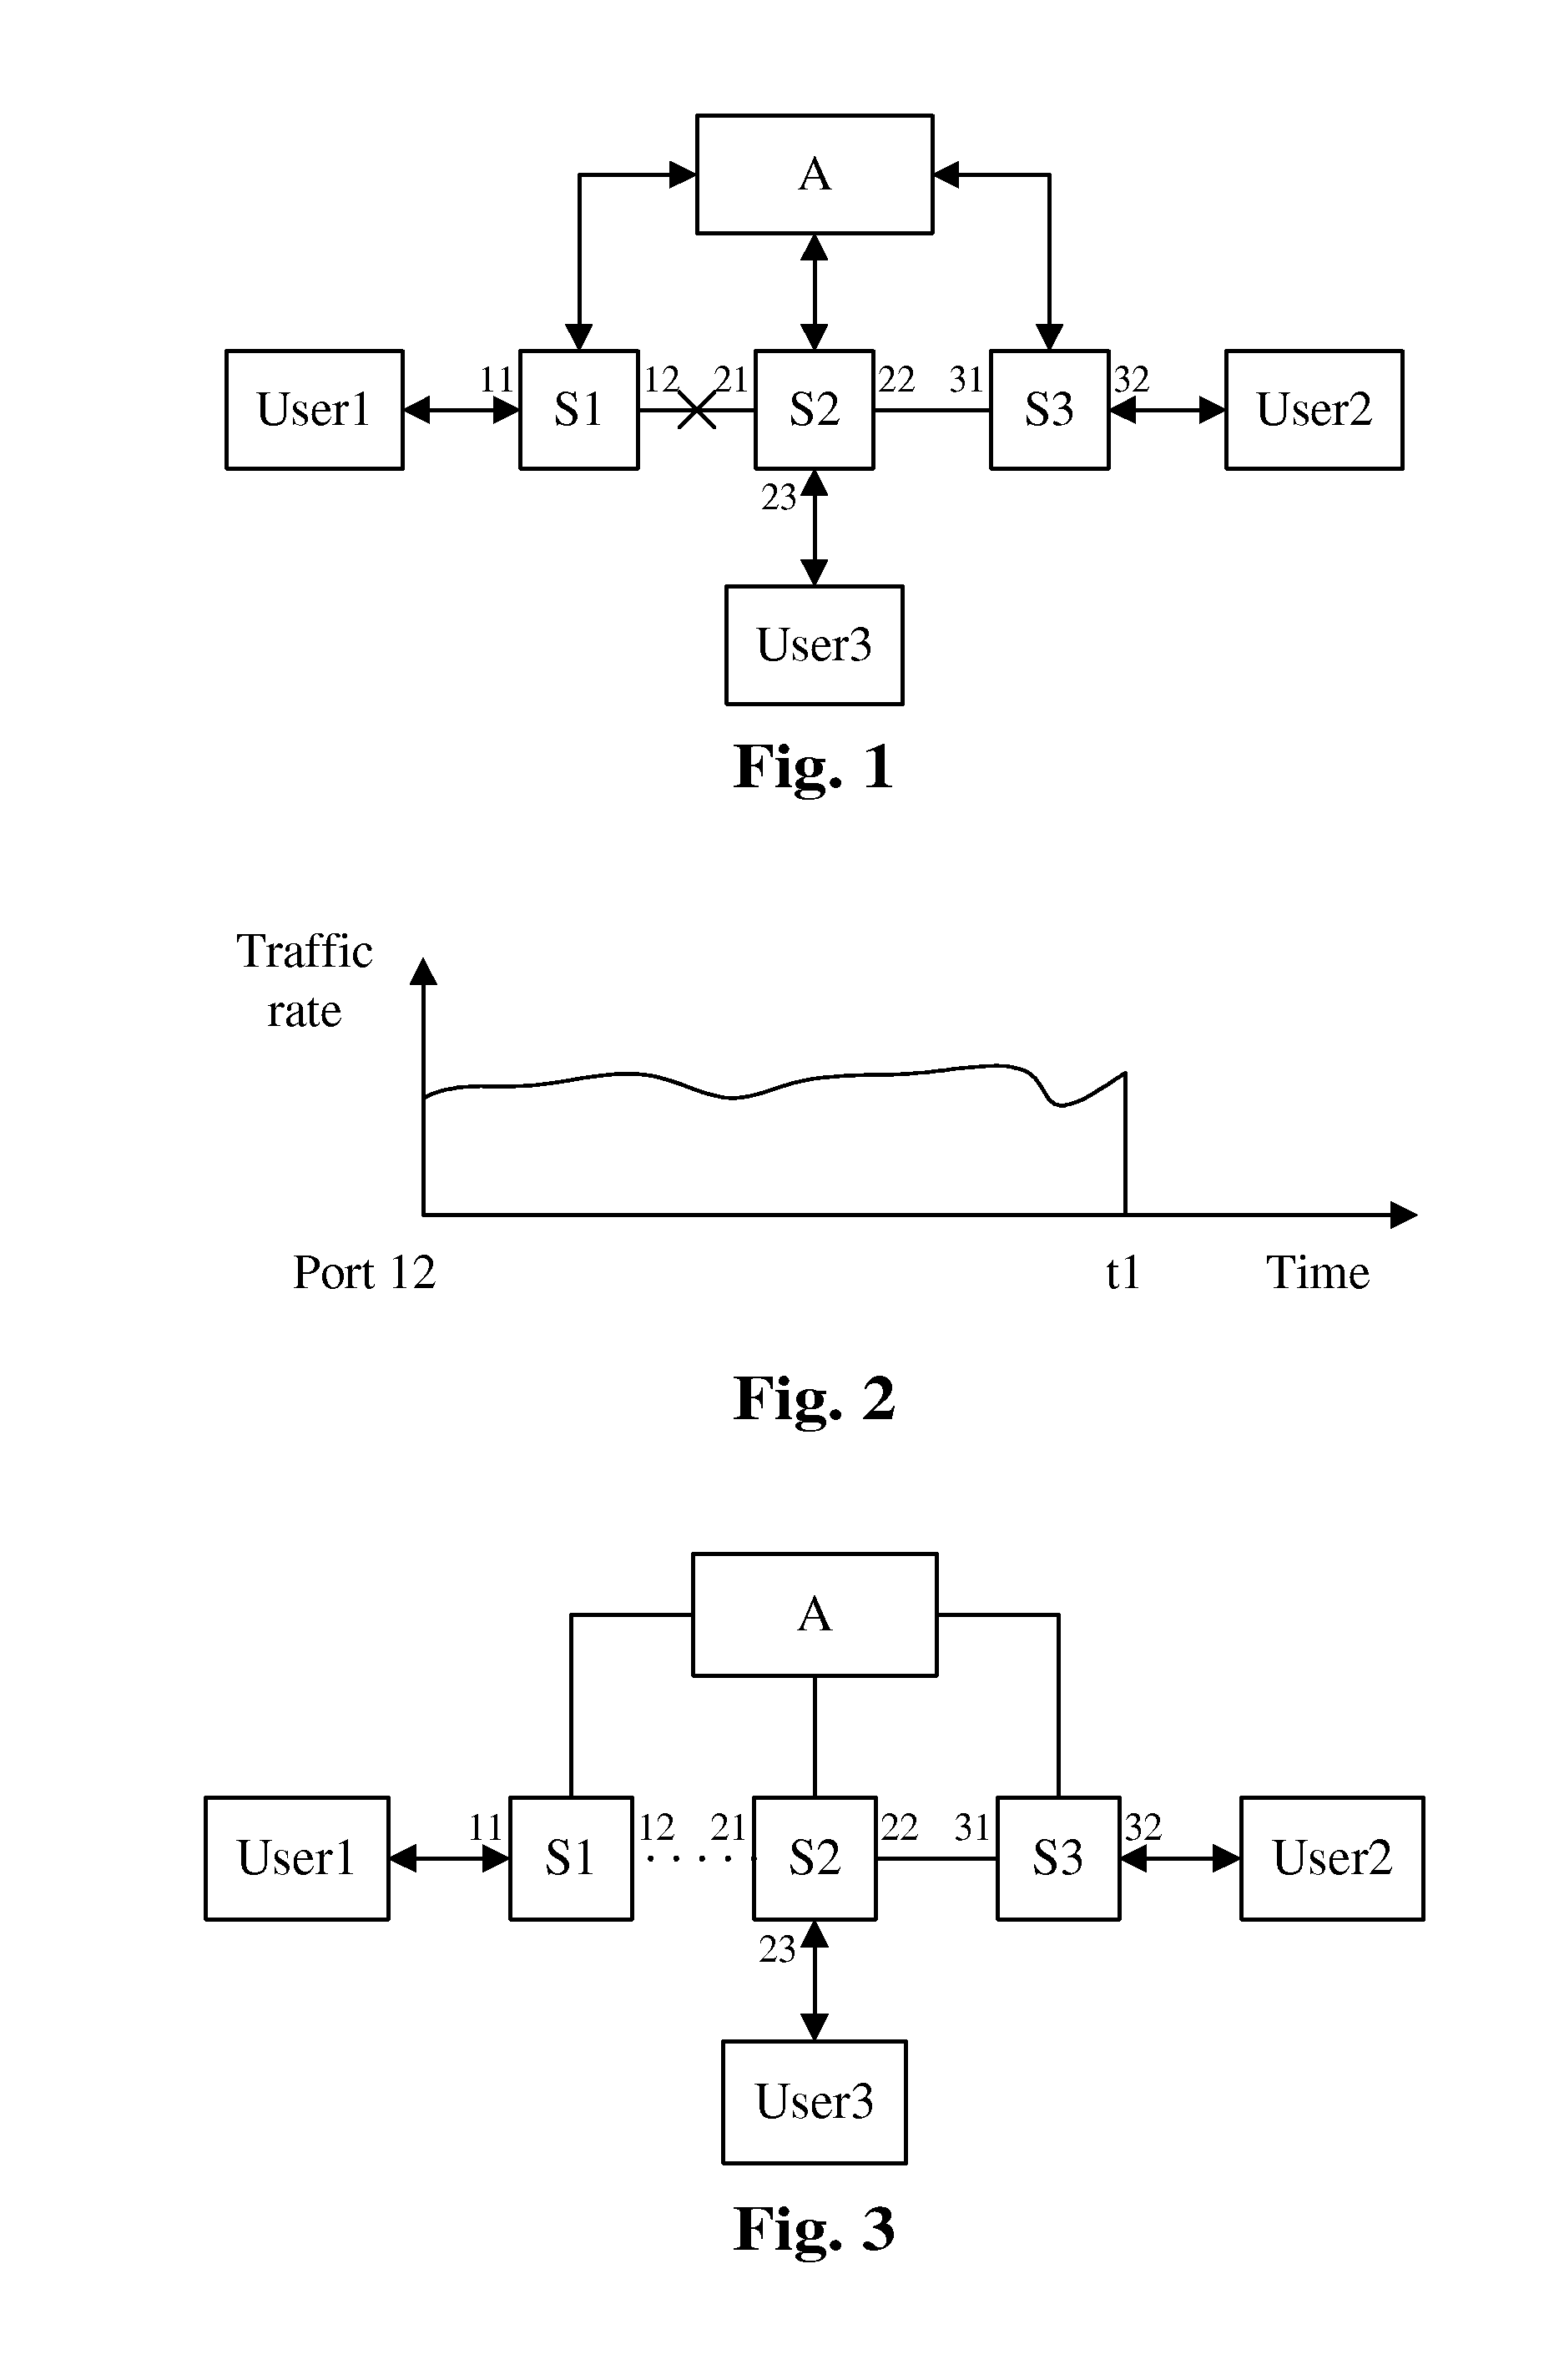
[0055]As shown in FIG. 3, a traffic analyzing node deployed in the Ethernet is Node A, and the traffic analyzed nodes are Node S1, Node S2 and Node S3. The method for realizing Ethernet traffic statistics and analysis in this embodiment is as shown in FIG. 7 and comprises the following steps.

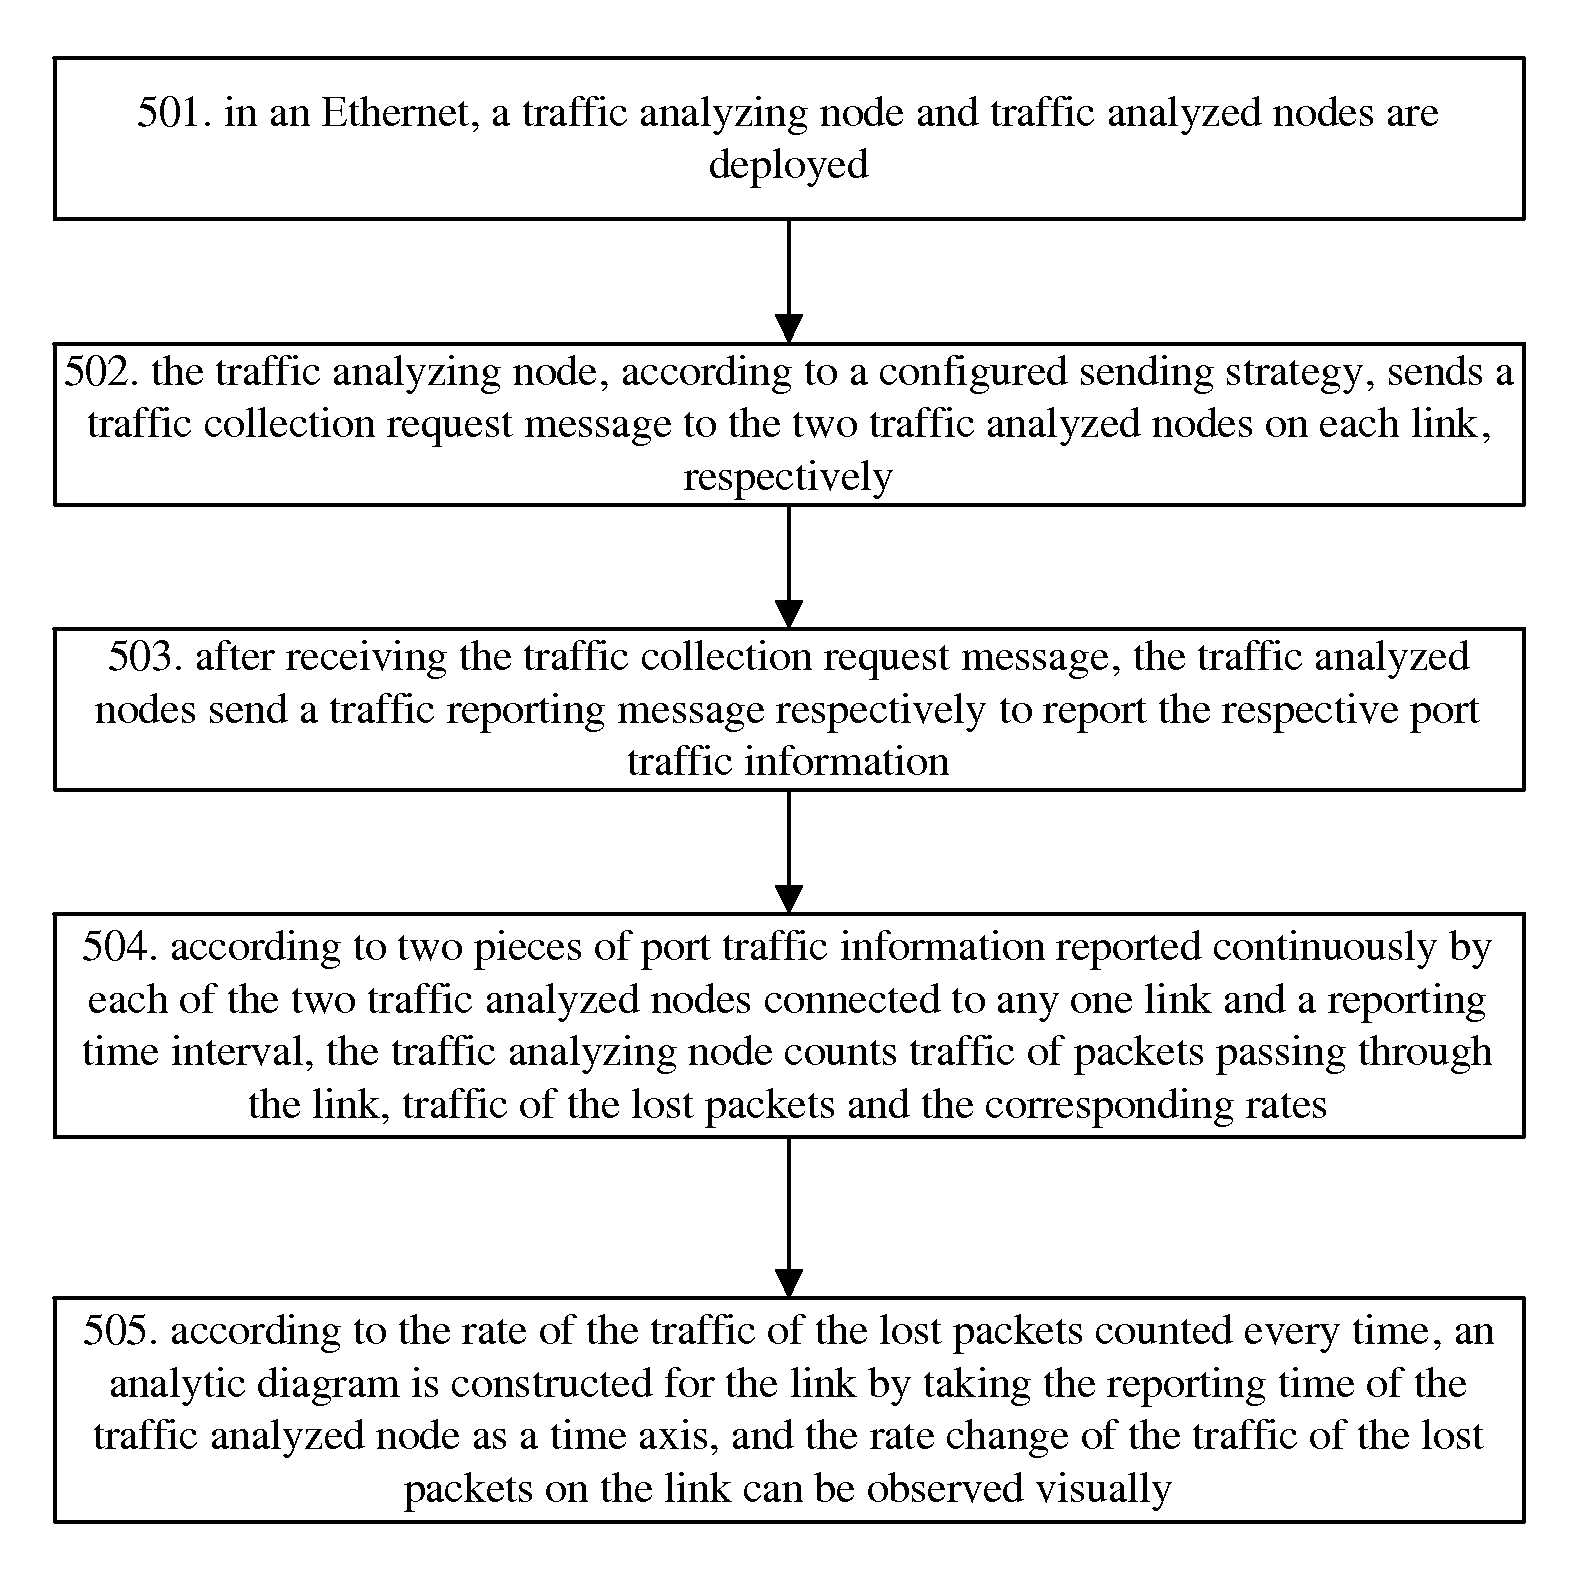
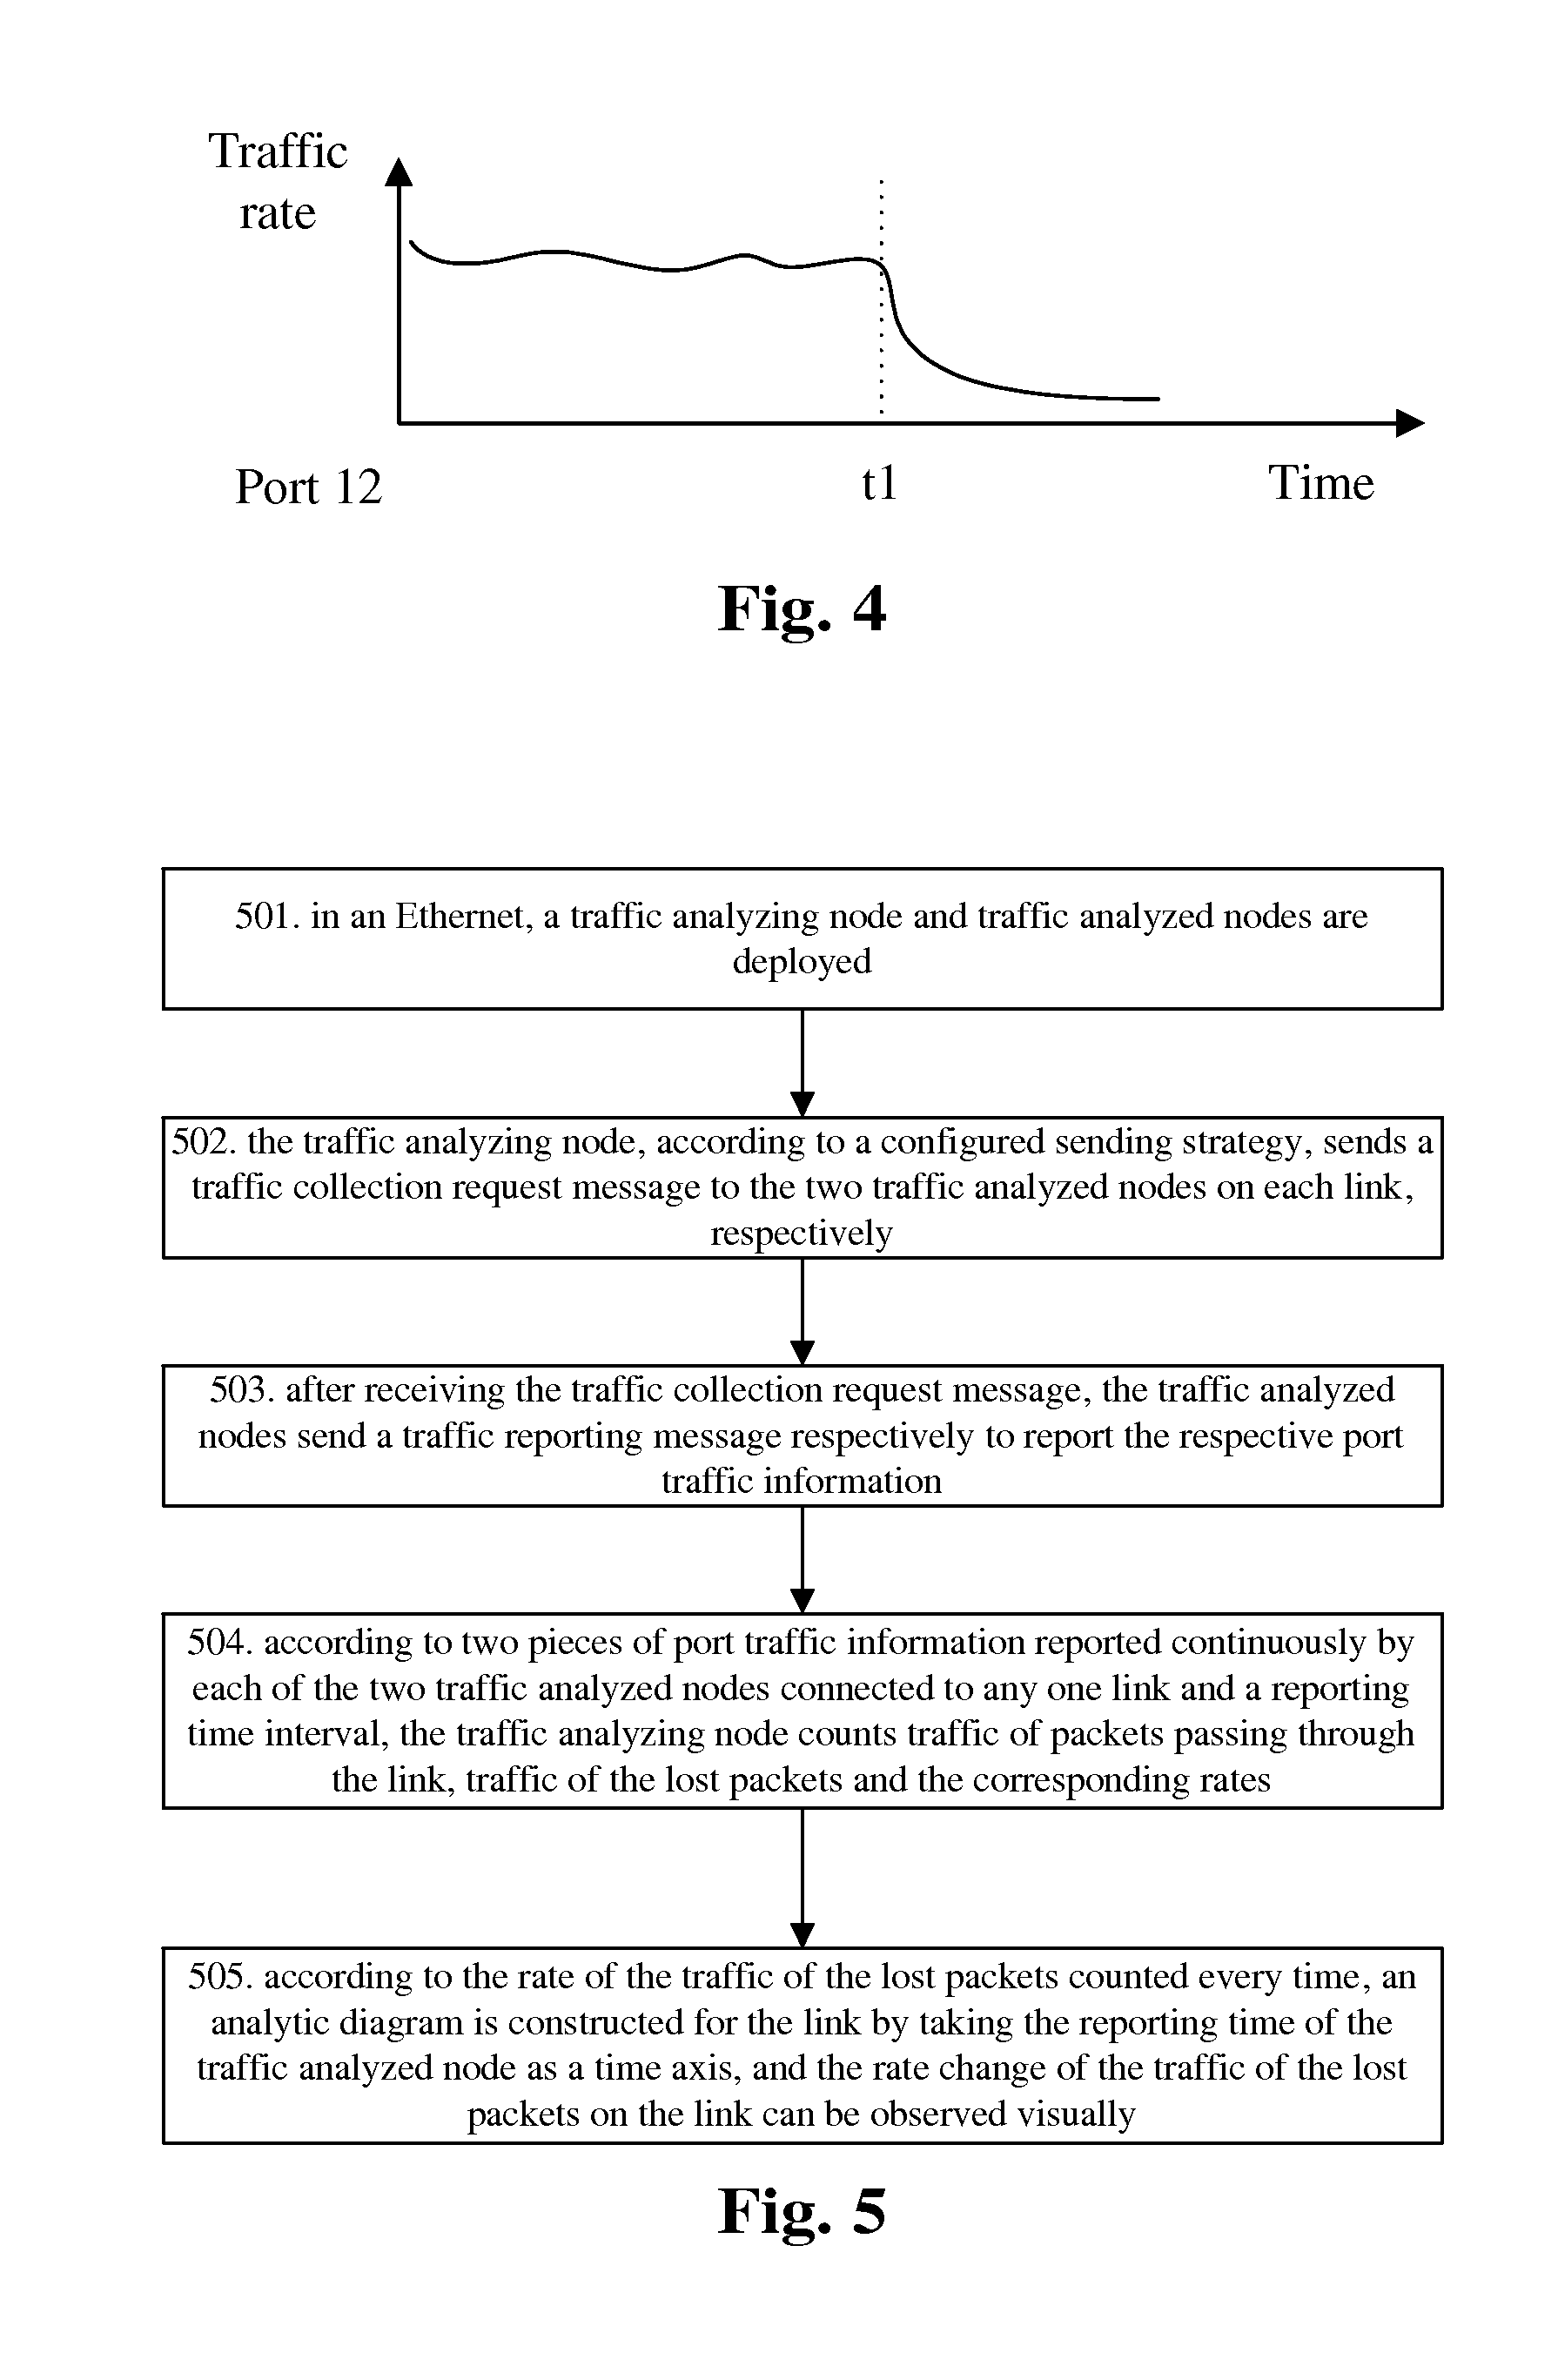
[0056]Step 701: Node A respectively sends a traffic collection request message to Node S1, Node S2 and Node S3 on the links S1⇄S2 and S2⇄S3 according to a configured period T.

[0057]Step 702: after receiving the traffic collection request message, Node S1, Node S2 and Node S3 send a traffic reporting message respectively to report the respective port traffic information.

[0058]The port traffic information of Node S1 comprises counting information of the sent and received packets of Port 11 and Port 12 of Node S1. The port traffic information of Node S2 comprises counting information of the sent and received packets of Port 21 and Port 22 of Node S2. The port traffic information of Node S3 comprise...

embodiment 2

[0064]Taking FIG. 9 as an example, FIG. 9 shows an Ethernet ring network. The Ethernet ring network, which is an Ethernet protection technology, is a network of ring topology connected by several nodes. When all links on the ring are well-conditioned, a port on the ring of a node on the ring is blocked to prevent the ring from being closed, and the traffic has only one transmission channel on the network, for example, Port 11 is blocked by Node S1 and the traffic transmission path is S2⇄S3. When a fault occurs on a link on the ring, after the fault is detected by the adjacent nodes of the fault link, the port connected with the fault link is blocked and other nodes are notified to perform switching. The blocked port is opened when the link recovers. As shown in FIG. 10, a fault occurs between Node S2 and Node S3, Port 22 is blocked by Node S2, Port 31 is blocked by Node S3, other nodes are notified to perform switching and Port 11 is opened by Node S1.

[0065]In this network, Node A i...


PUM


Abstract

An Ethernet traffic statistics and analysis method comprises: according to two pieces of port traffic information reported continuously by each of two traffic analyzed nodes which are connected to any one link and a reporting time interval, a traffic analyzing node counting traffic of packets passing through the link, traffic of lost packets and corresponding rates, and constructing an analytic diagram according to the rate of the traffic of the lost packets counted every time. An Ethernet traffic statistics and analysis system is also provided. The solution performs statistics and analysis on the traffic on the link in the Ethernet, and reflects the current state of the link accurately and visually. When a fault occurs or a packet is lost on the link, the fault position can be quickly located, and the efficiency of management and maintenance can be increased.

Description

FIELD OF THE INVENTION[0001]The present invention relates to a traffic statistical technology in data communication, and more particularly, to an Ethernet traffic statistics and analysis method and system.BACKGROUND OF THE INVENTION[0002]Since the Ethernet is developing into a carrier grade network which carries multiple services, and especially since some services have higher requirements on network reliability and real-time performance, it is more important to monitor and manage the Ethernet traffic. The traffic distribution of the Ethernet can be learned through analyzing the Ethernet traffic to achieve better network performance and services. When a packet is lost in the Ethernet, the fault point can be found quickly and the fault process can be analyzed efficiently to locate the fault and evaluate the impact on the services quickly.[0003]Generally, in the existing technology, a node counts such information as the number of sent and received packets, the number of lost packets a...

Claims


Application Information

Patent Timeline
IPC IPC(8): H04L12/26
CPCH04L41/26H04L41/142
Inventor WU, SHAOYONG
Owner ZTE CORP
Features
  • Generate Ideas
  • Intellectual Property
  • Life Sciences
  • Materials
  • Tech Scout
  • Unparalleled Data Quality
  • Higher Quality Content
  • 60% Fewer Hallucinations
Learn More