Supercharge Your Innovation With Domain-Expert AI Agents!

Systems and Methods for Portfolio Analysis

a portfolio and portfolio technology, applied in the field of portfolio tail risk measurement, can solve the problems of large losses, poor market return description of distribution, and inability to accurately predict the return of the market,

Inactive Publication Date: 2014-04-24
BLOOMBER FINANCE LP
View PDF3 Cites 2 Cited by
  • Summary
  • Abstract
  • Description
  • Claims
  • Application Information

AI Technical Summary

Benefits of technology

This approach enables more accurate measurement of extreme losses and tail risk, providing a robust and adaptive framework that aligns with regulatory guidelines, improving the ability of portfolio managers to assess and manage tail risk effectively.

Problems solved by technology

Portfolio managers have long known that the forces driving their world are not always smooth or symmetrical.
While the familiar symmetrical, bell-shaped normal distribution may describe some natural phenomena, portfolio managers know that this distribution does a poor job of describing market returns.
In addition, large losses are particularly damaging to a manager's reputation and business.
In turn, clients are increasingly demanding tail risk measures from their managers.
Unfortunately, the traditional portfolio risk measure, the standard deviation, gives similar weight to a loss as to a gain.
In addition, the standard deviation does not adequately measure the likelihood of tail events, so using the standard deviation to measure a portfolio's risk fails to adequately measure portfolio risk for managers and their clients.
Once again, the standard deviation falls short of being an adequate measure of portfolio tail risk.
However, to correctly measure these statistics a way must be found to fully represent a portfolio's (and its benchmark's) expected return performance—that is, the expected distribution of a portfolio's returns and tracking errors over the next month.
However, portfolio returns can significantly deviate from normality; credit asset returns provide a good example.
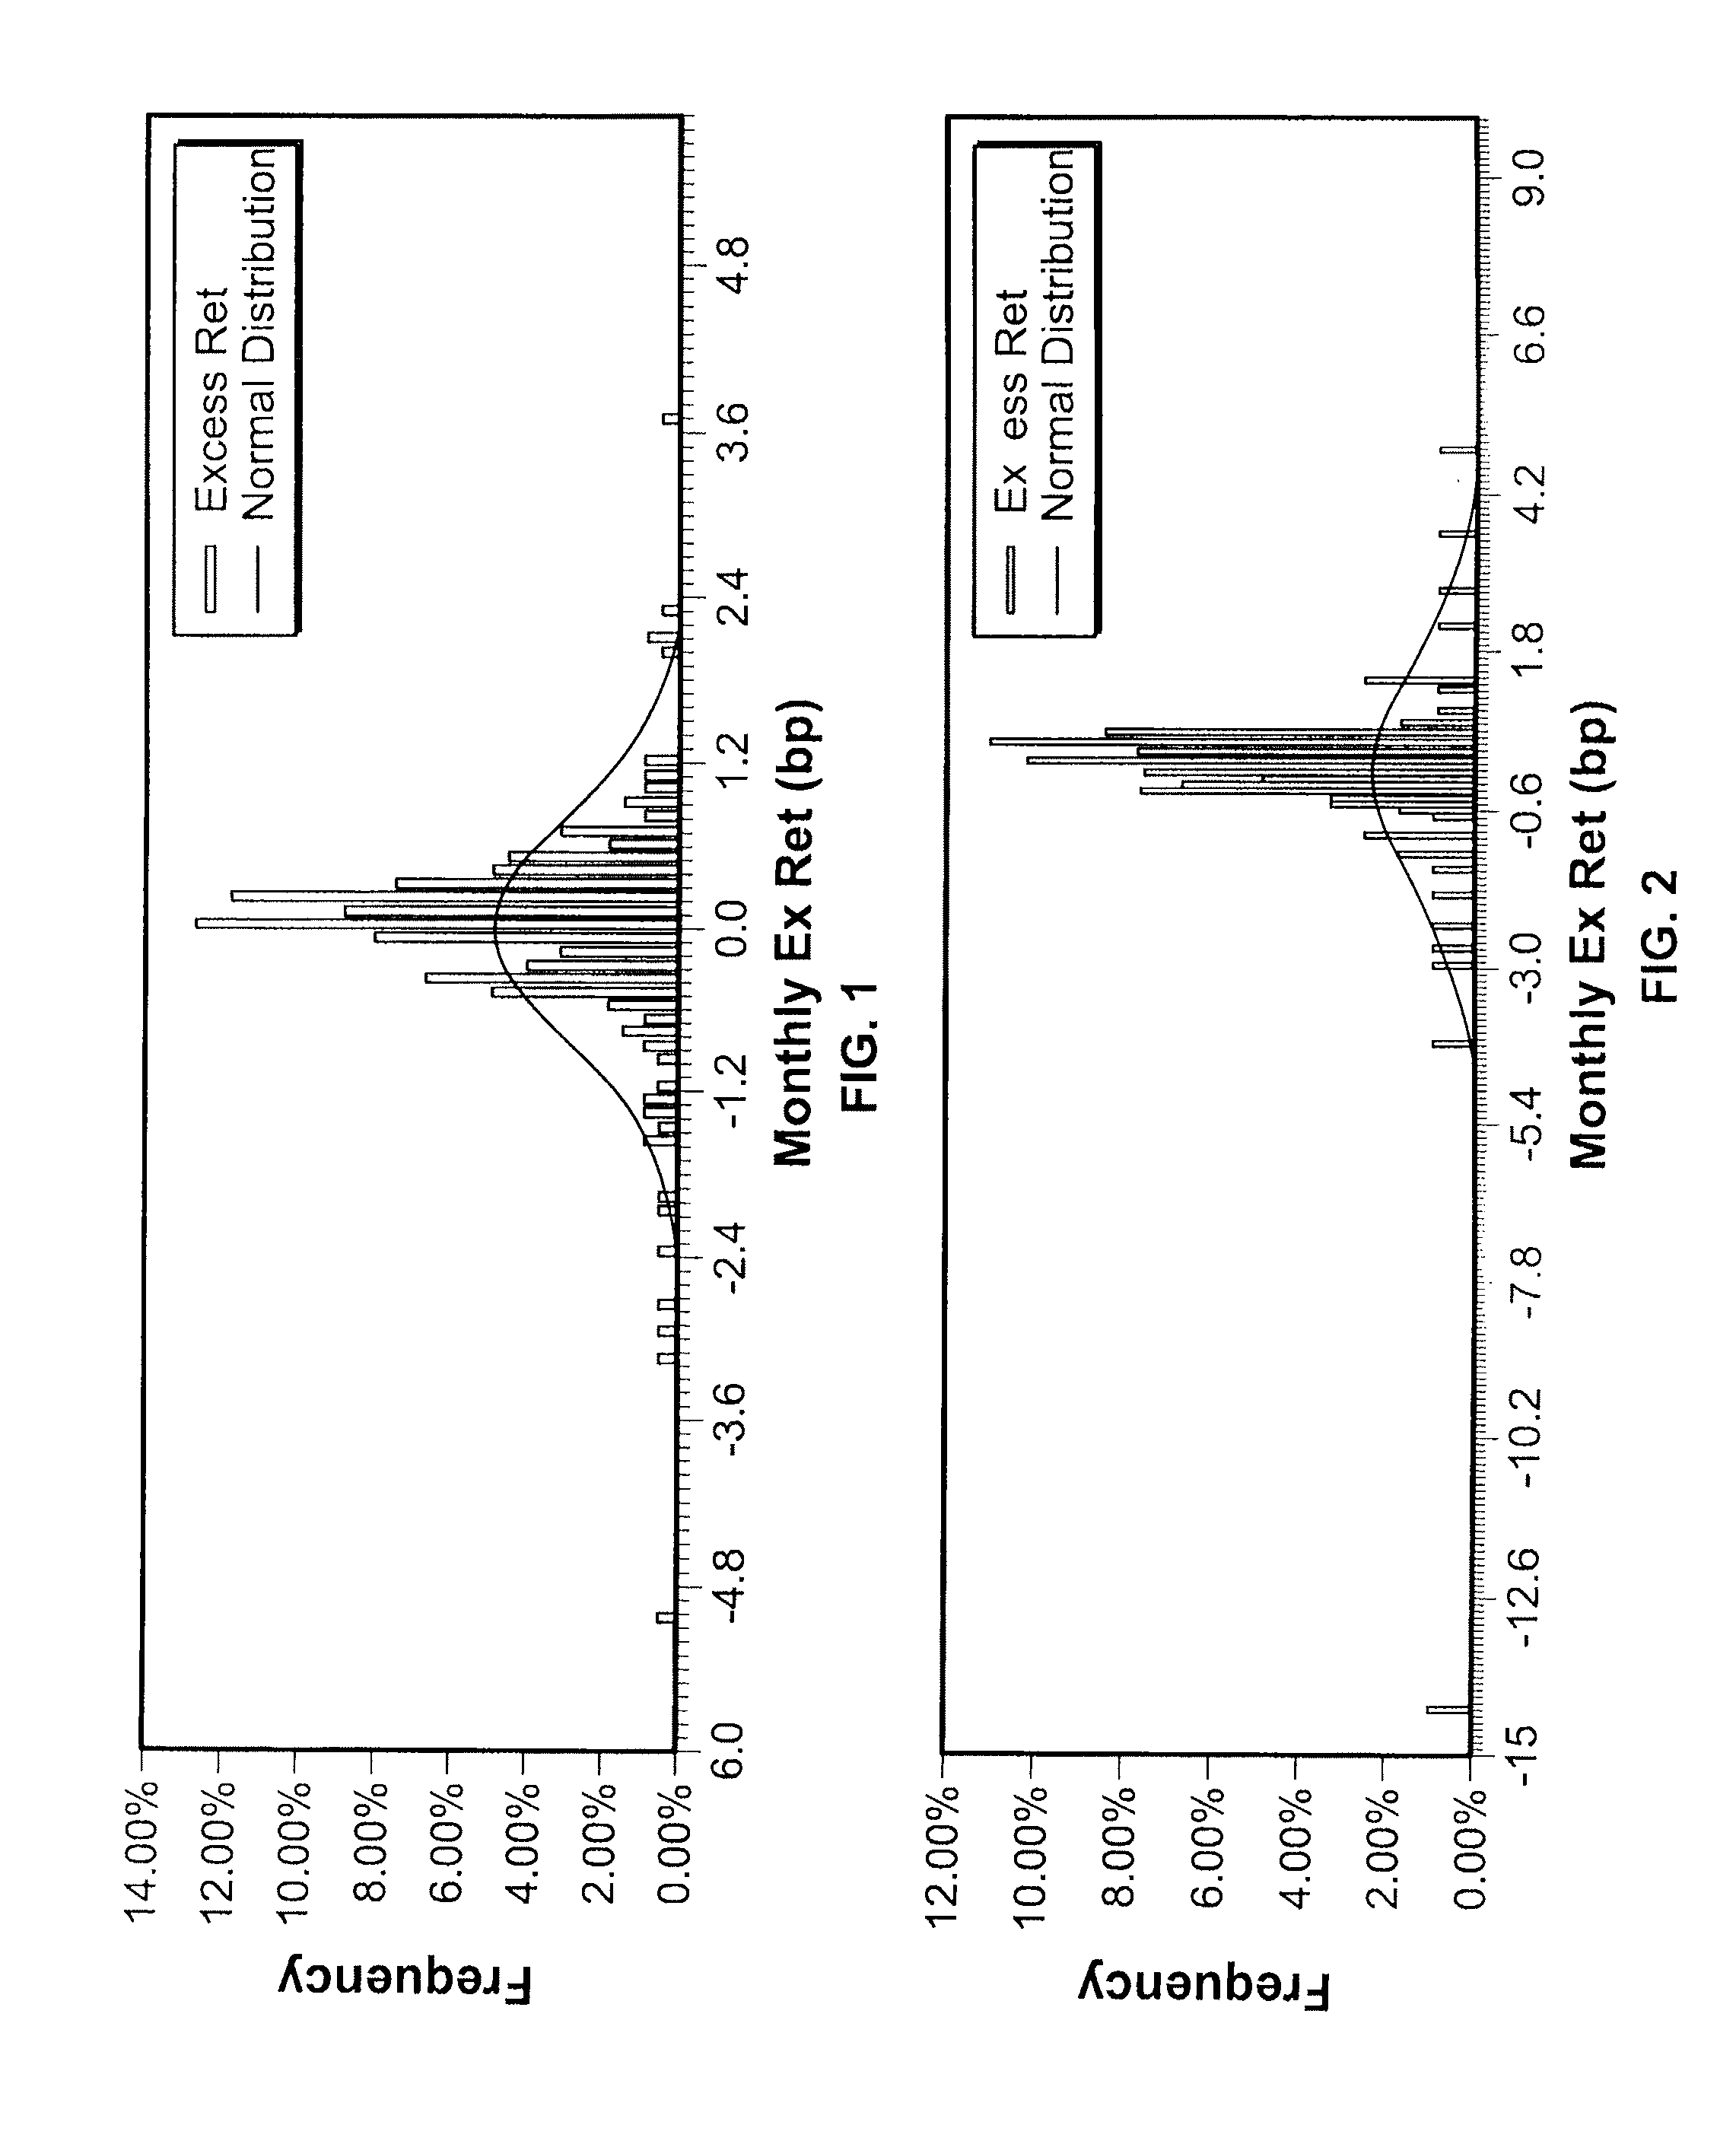
However, occasionally there is an event which can produce substantial portfolio losses. FIG. 1 presents the distribution of monthly excess returns for the U.S. Corporate Baa Index from August 1988 through July 2007.
The distribution of Baa excess returns displays fat negative tails, despite the fact that the portfolio is very well diversified and the returns are over a very long period of time.
Besides credit and other market factors, another significant source of tail risk in a portfolio is derivative instruments such as options.
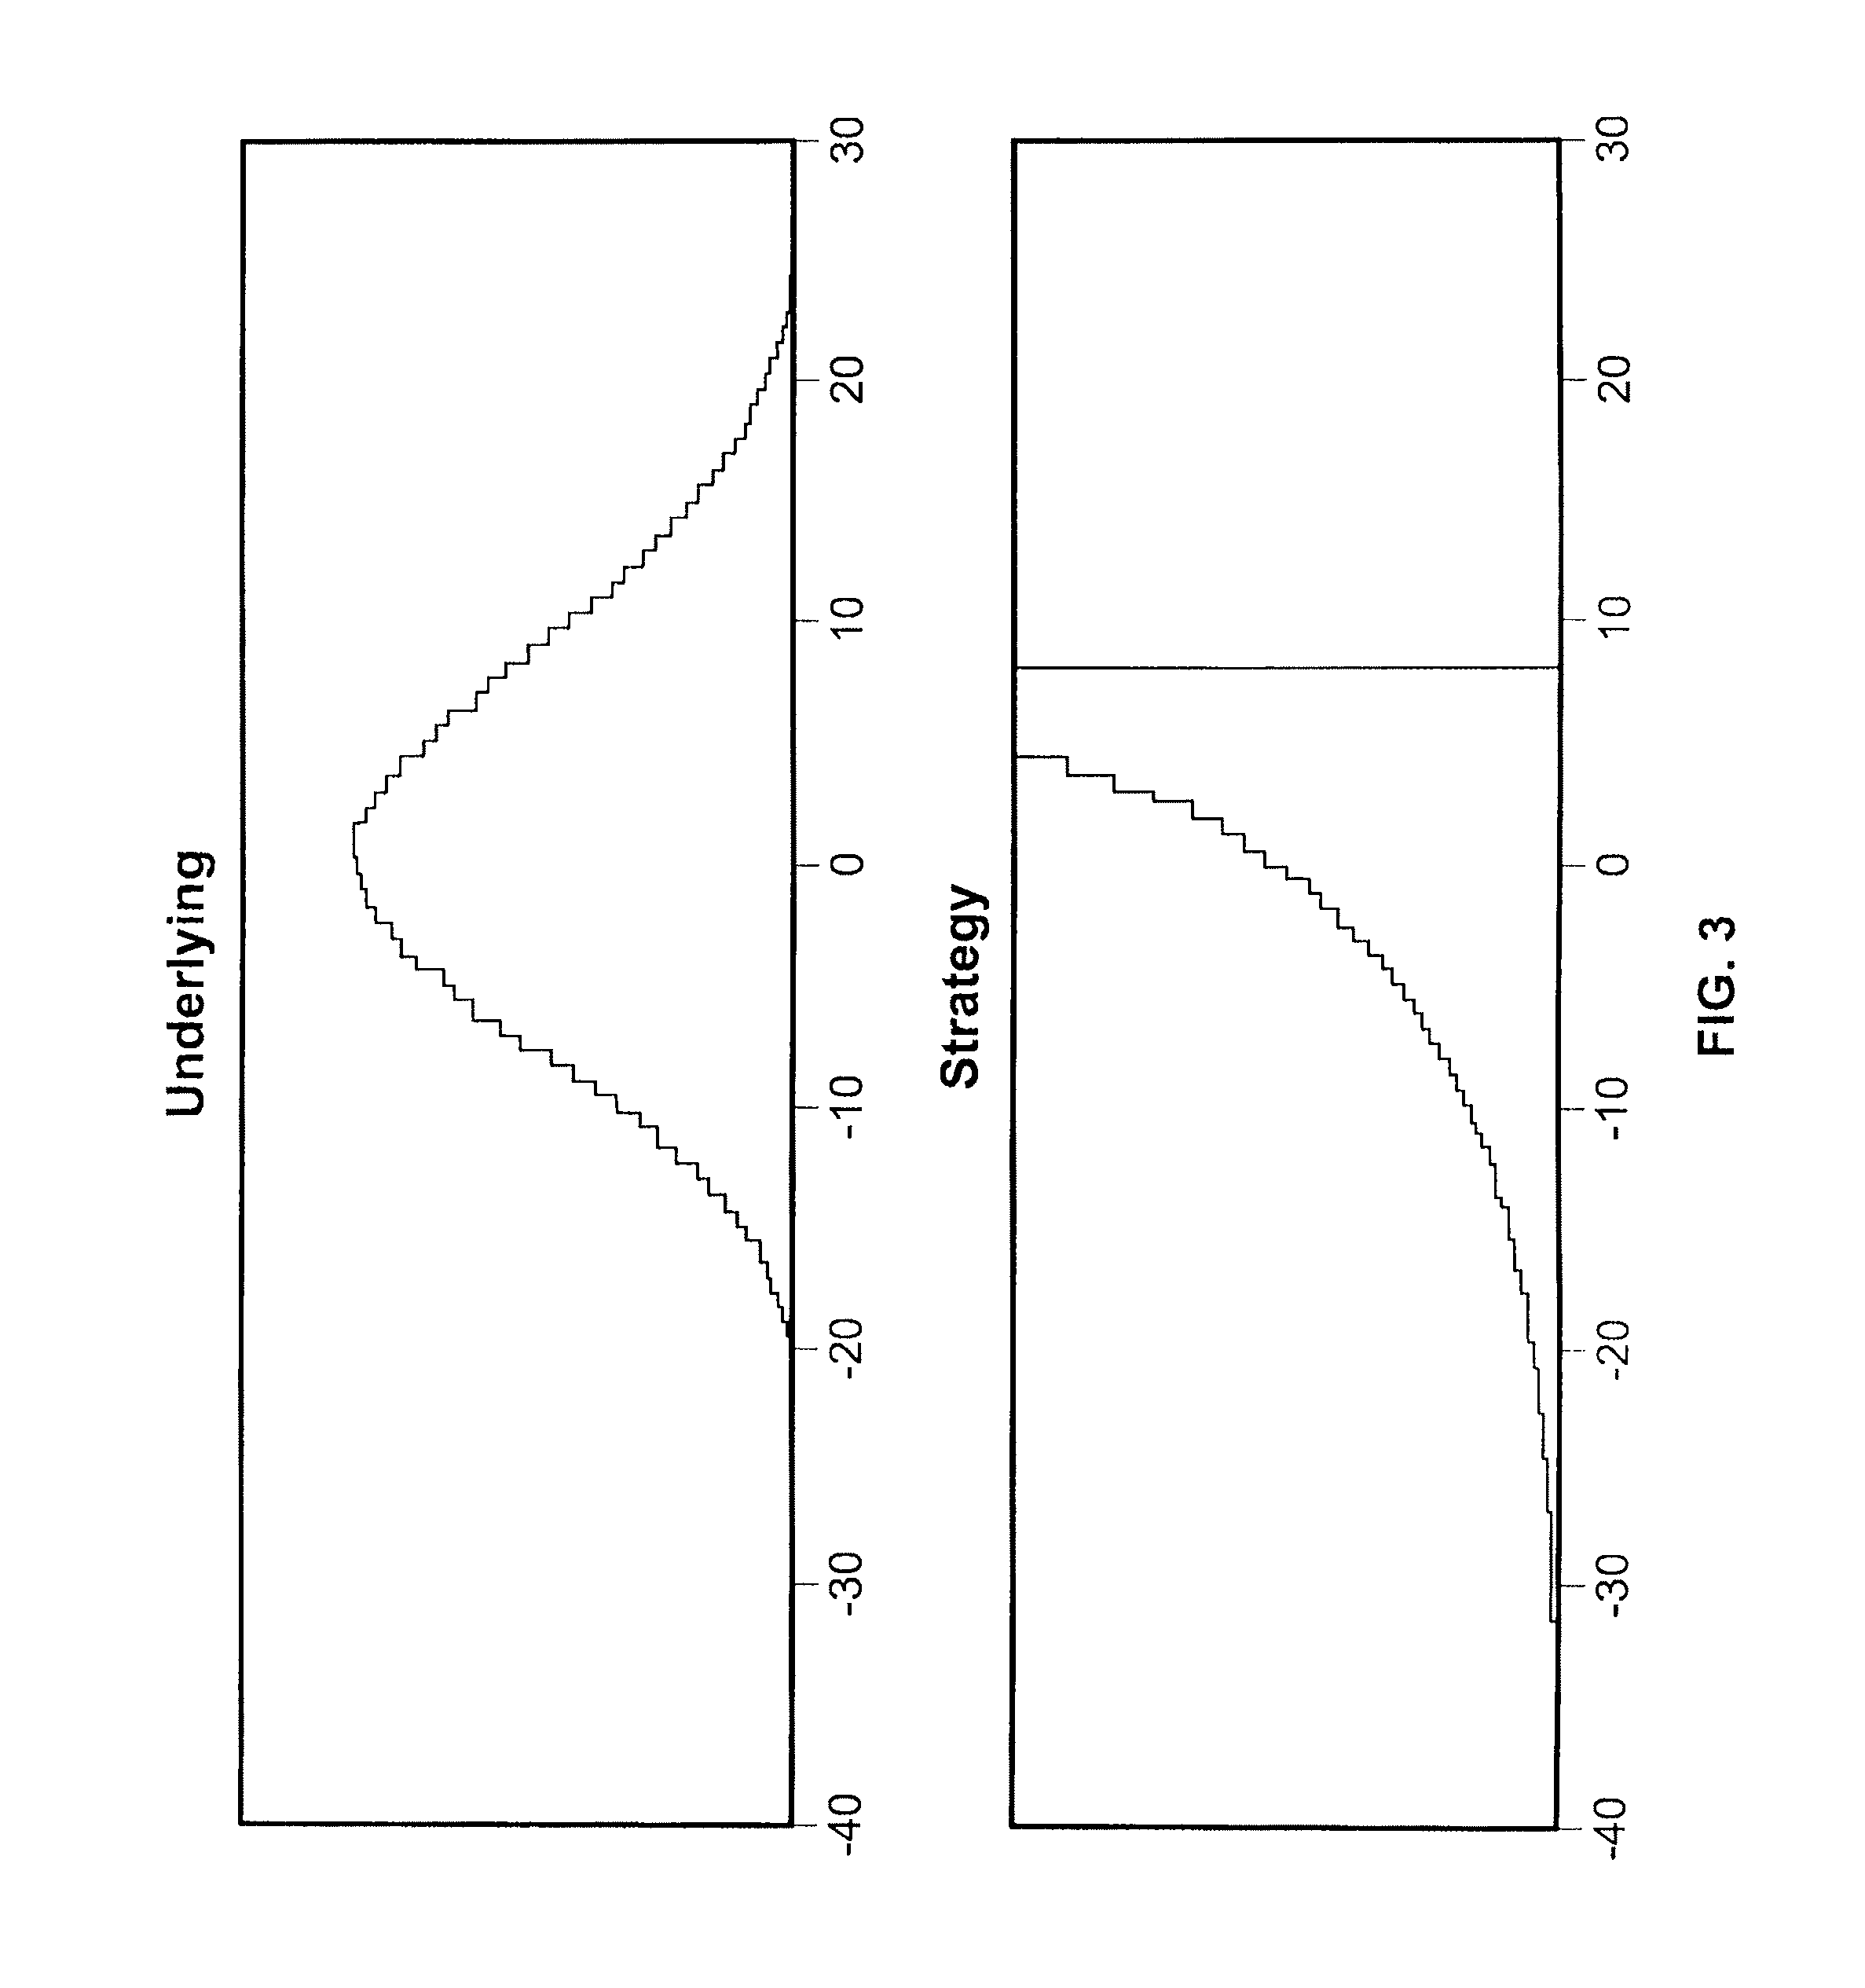
If these were the only quantities used to describe the P&L distribution, we would consider these two strategies as equally risky.
Some portfolio managers feel that VaR is an inadequate measure of tail risk because it is only a threshold value and does not provide information about the extent of the losses beyond the threshold value.
Thus, even though both strategies have the same expected return and standard deviation, they have very different tail risk.
(c) However, estimating tail risk with simple risk measures based on the relatively short full history of this index would overestimate the true exposure to extreme losses, since almost half of the historical observations come from the extraordinarily volatile period of 2000-2003.
In addition, our default risk model accounts for the possibility of default events that further drive extreme losses without a commensurate effect on regular, i.e. normal market, volatility.
For example, we know that the risk of credit securities increases with the level of spreads.

Method used


Image

  • Systems and Methods for Portfolio Analysis
  • Systems and Methods for Portfolio Analysis
  • Systems and Methods for Portfolio Analysis

Examples


Embodiment Construction

[0073]As mentioned above, Part 1 of this description illustrates the Tail risk Model's reports for several portfolios, first for a portfolio benchmarked against the Lehman Brothers Global Aggregate Index. We then discuss the tail risk report for the U.S. High Yield Index against a cash benchmark. Our final example is a highly skewed, highly non-normal negatively convex portfolio, which allows us to highlight the flexibility of our Tail Risk Model.

[0074]Part II discusses embodiments based on our tail risk models. In order to obtain the distribution of a portfolio's return (or P&L), four steps are preferably performed: identification of risk factors; pricing the securities at the investment horizon; producing a portfolio return distribution by aggregating the securities' distribution; and summarizing the wealth of information contained in the return (or P&L) distribution by means of a few significant statistics. We describe each step in detail.

[0075]Part I: Portfolio Applications

[0076...


PUM


Abstract

In one aspect, the invention comprises a computer-implemented method comprising: (i) electronically receiving data describing one or more risk factors driving volatility of each of a plurality of securities comprised in a specified portfolio; (ii) for each of the plurality of securities, categorizing each of the risk factors as a random variable and identifying a distribution that best fits each risk factor's historical behavior; and generating a return distribution for the security, based on the best fit distributions; and (iii) aggregating the security return distributions to generate a return distribution for in the specified portfolio. Other aspects and embodiments comprise analogous software and computer systems.

Description

CROSS REFERENCE TO RELATED APPLICATIONS[0001]This application claims priority to U.S. Provisional Patent Application No. 61 / 000,347, filed Oct. 24, 2007. The entire contents of that provisional application are incorporated herein by reference.INTRODUCTION[0002]Embodiments of the present invention relate to portfolio tail risk measurement. At least one or more of those embodiments comprise methods, systems, and software based on a Tail Risk Model. Such embodiments deliver to portfolio managers and traders the complete probability distribution of their portfolio's return (or P&L) and tracking errors which are then summarized by three risk measures: volatility, value at risk, and expected shortfall.[0003]The Tail Risk Model embodiments preferably provide detailed tail risk reports that permit the portfolio manager to examine particular sources of portfolio tail risk. In an embodiment, the Tail Risk Model is implemented within, and is fully consistent with, the Lehman Global Risk Model....

Claims


Application Information

Patent Timeline
Patent Type & Authority Applications(United States)
IPC IPC(8): G06Q40/06
CPCG06Q40/06G06Q40/00
Inventor MEUCCI, ATTILIO
Owner BLOOMBER FINANCE LP
Features
  • R&D
  • Intellectual Property
  • Life Sciences
  • Materials
  • Tech Scout
  • Unparalleled Data Quality
  • Higher Quality Content
  • 60% Fewer Hallucinations
Learn More