

Benchmarks for normal cell identification
a technology of normal cells and benchmarks, applied in the field of benchmarks for normal cell identification, can solve the problems of inability to accurately identify normal cells, complicated biomarker identification,
- Summary
- Abstract
- Description
- Claims
- Application Information
AI Technical Summary
Benefits of technology
Problems solved by technology
Method used
Image

Examples
example 1
Normal Cell Response to Erythropoietin (EPO) and Granulocyte Colony Stimulating Factor (G-CSF)
[0270]Normal cell signaling responses to EPO and G-CSF were characterized through comparison to signaling responses observed in samples from a subclass of patients with myelodysplatic syndrome (MDS) referred to herein as “low risk” patients. Fifteen samples of healthy BMMCs (from patients with no known diagnosis of disease) and 14 samples of BMMCs from patients who belonged to a subclass of patients with myelodysplastic syndrome were used to characterize normal cell responses to EPO and G-CSF. The 14 samples of low risk patients were obtained from MD Anderson Cancer Center in Texas. The low risk patients were diagnosed as per standard of care at MD Anderson Cancer Center. The 15 samples of healthy BMMCs were obtained through Williamson Medical Center and from a commercial source (AllCells, Emeryville, Calif.). The samples obtained through Williamson Medical Center were collected with inform...
example 2
Normal Cell Response to PMA and IFNa
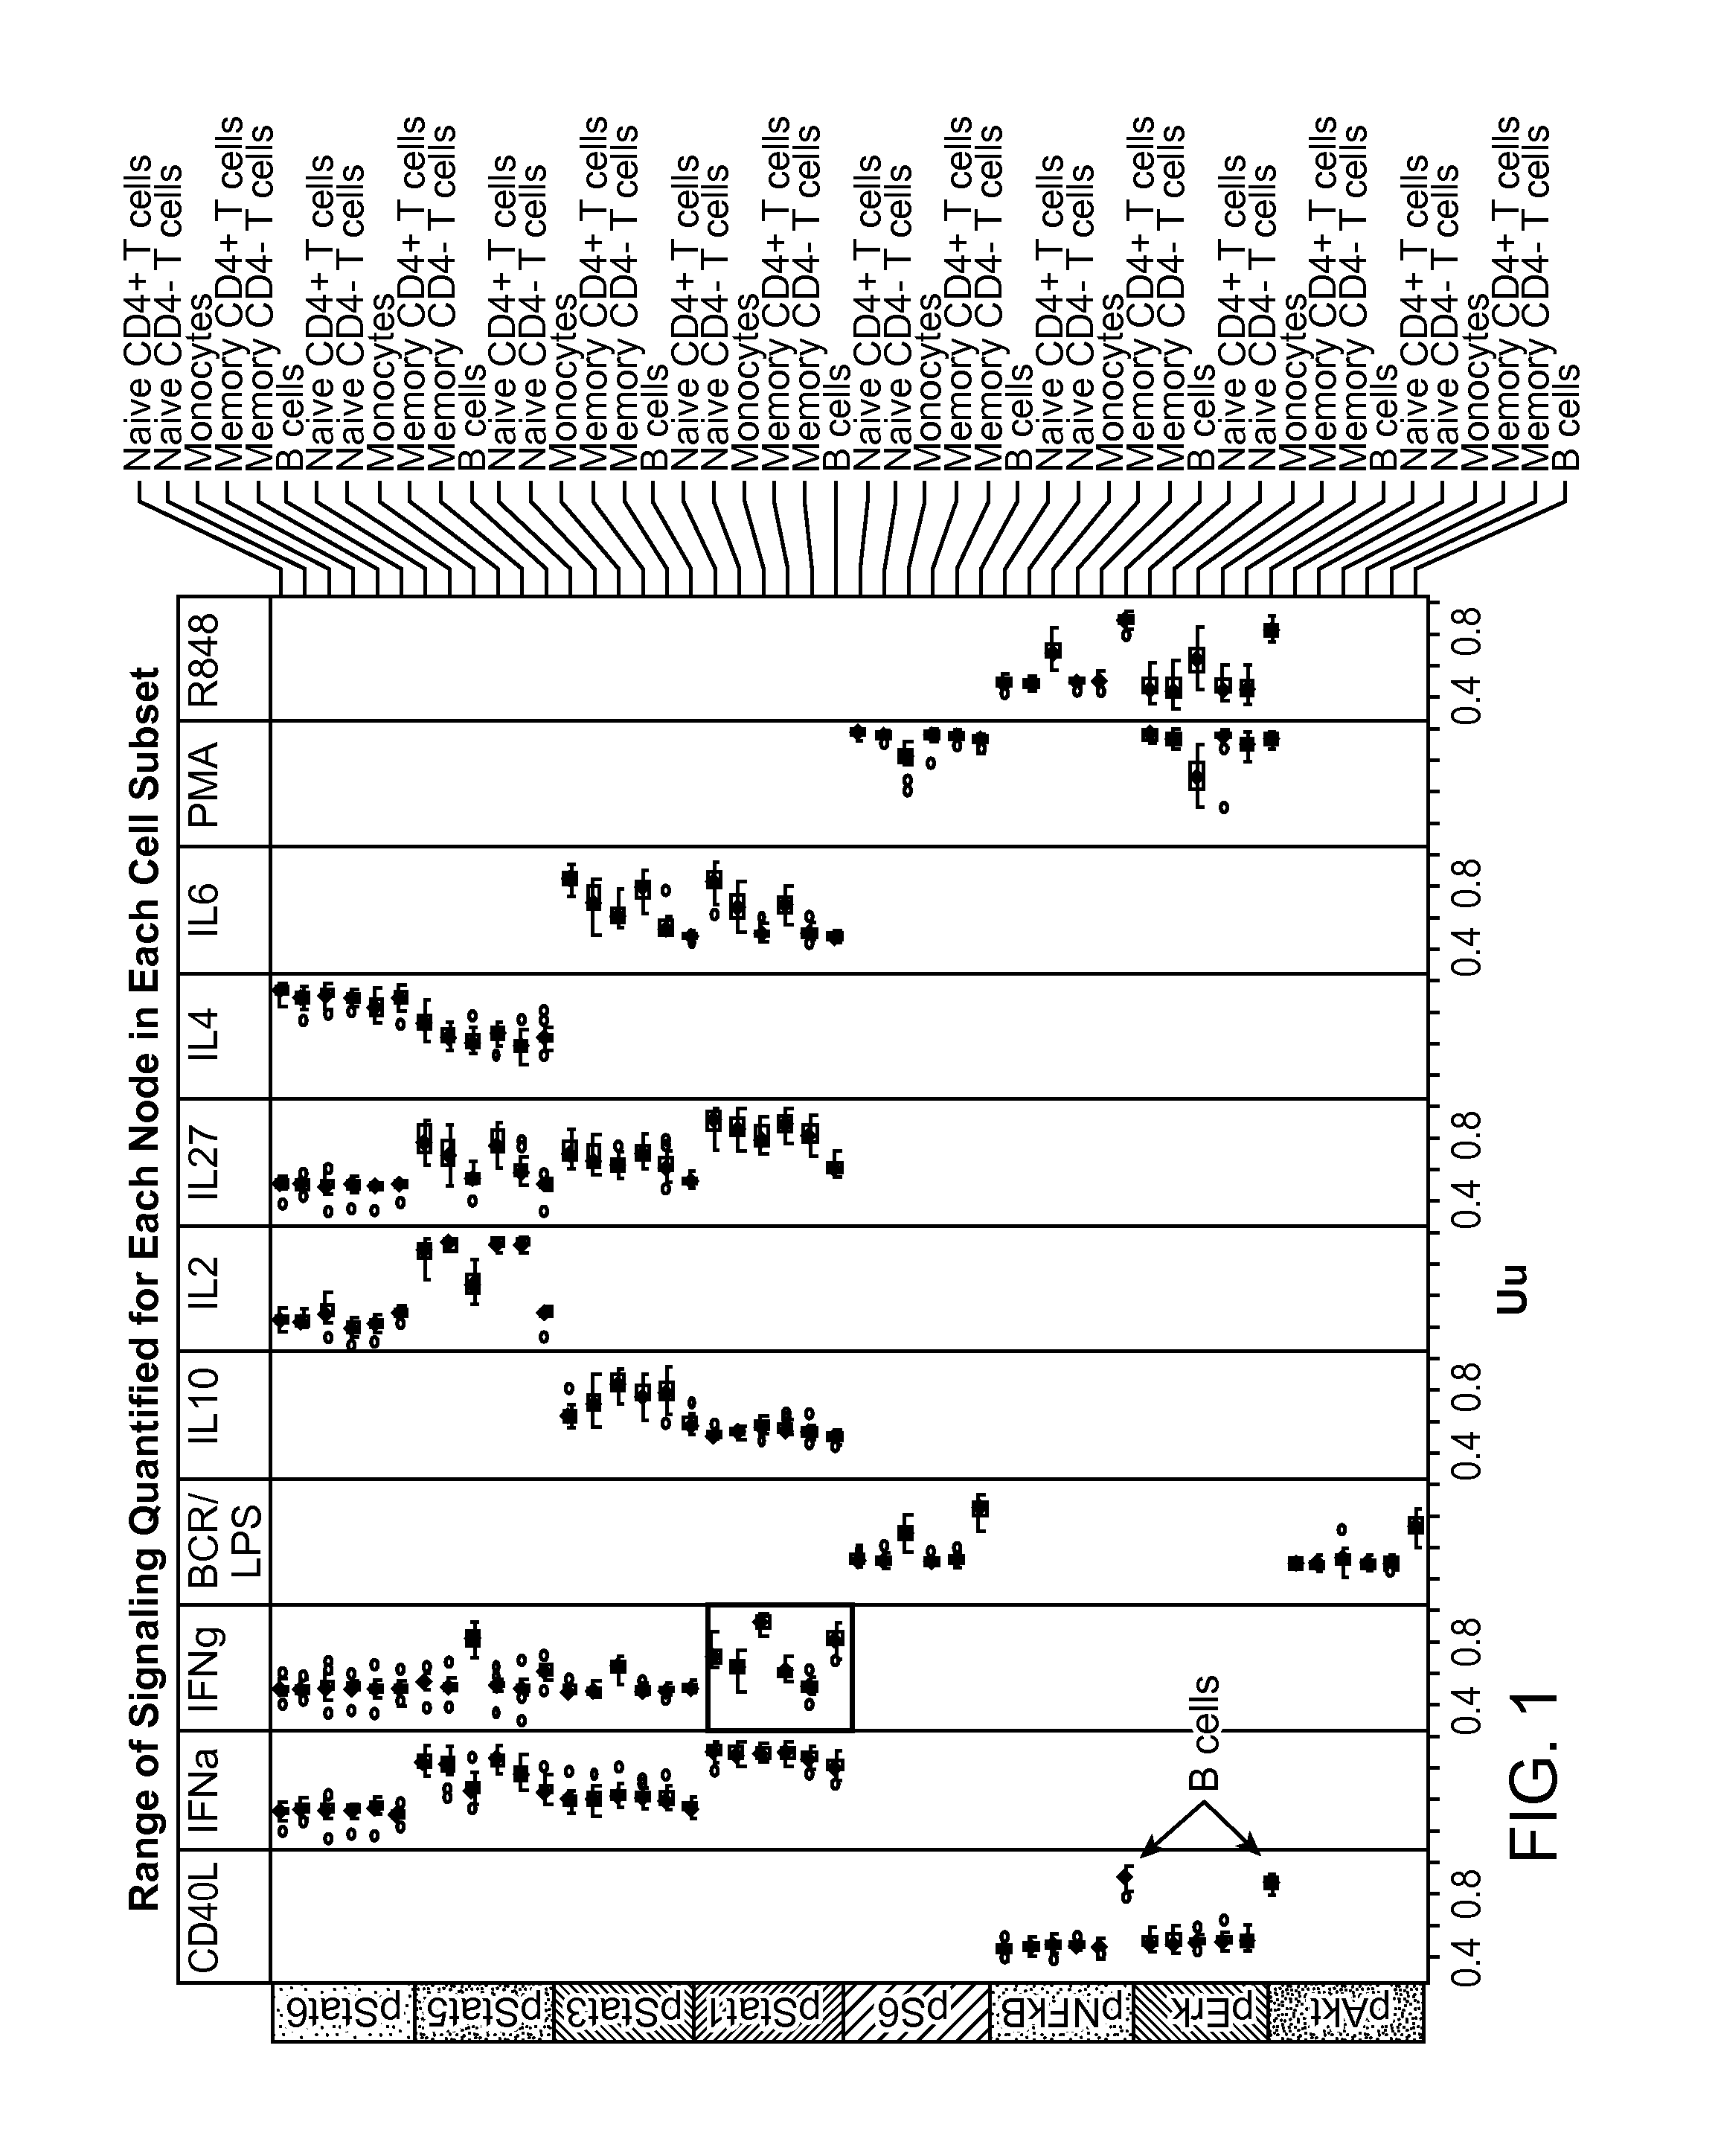
[0274]Normal cell signaling responses to PMA and IFNa□ were characterized in a set of 12 normal samples. Twelve of the normal samples were obtained from the National Institute of Health (NTH) and consisted of cryopreserved leukapheresis peripheral blood mononuclear cell (PBMC) samples. The normal samples had been previously categorized as high pStat5 responders and low pStat5 responders by the NIH based on flow-cytometry based analysis of IFNa-induced pStat5 in isolated T cells (measured at 15 minutes after modulation). The set of samples comprised 6 high responders and 6 low responders. The set of samples were homogeneous by gender and were blind associated with race, age, gender and pStat5 response. Additionally, two normal samples comprising cryopreserved PBMCs from healthy donors were processed at Nodality. In addition to the above described samples, a Jurkat cell line was used as a control.
[0275]Activation levels of different activatable elem...
example 3
Normal Cell Response to Varying Concentrations of GM-CSF, IL-27, IFNa and IL-6 in Whole Blood
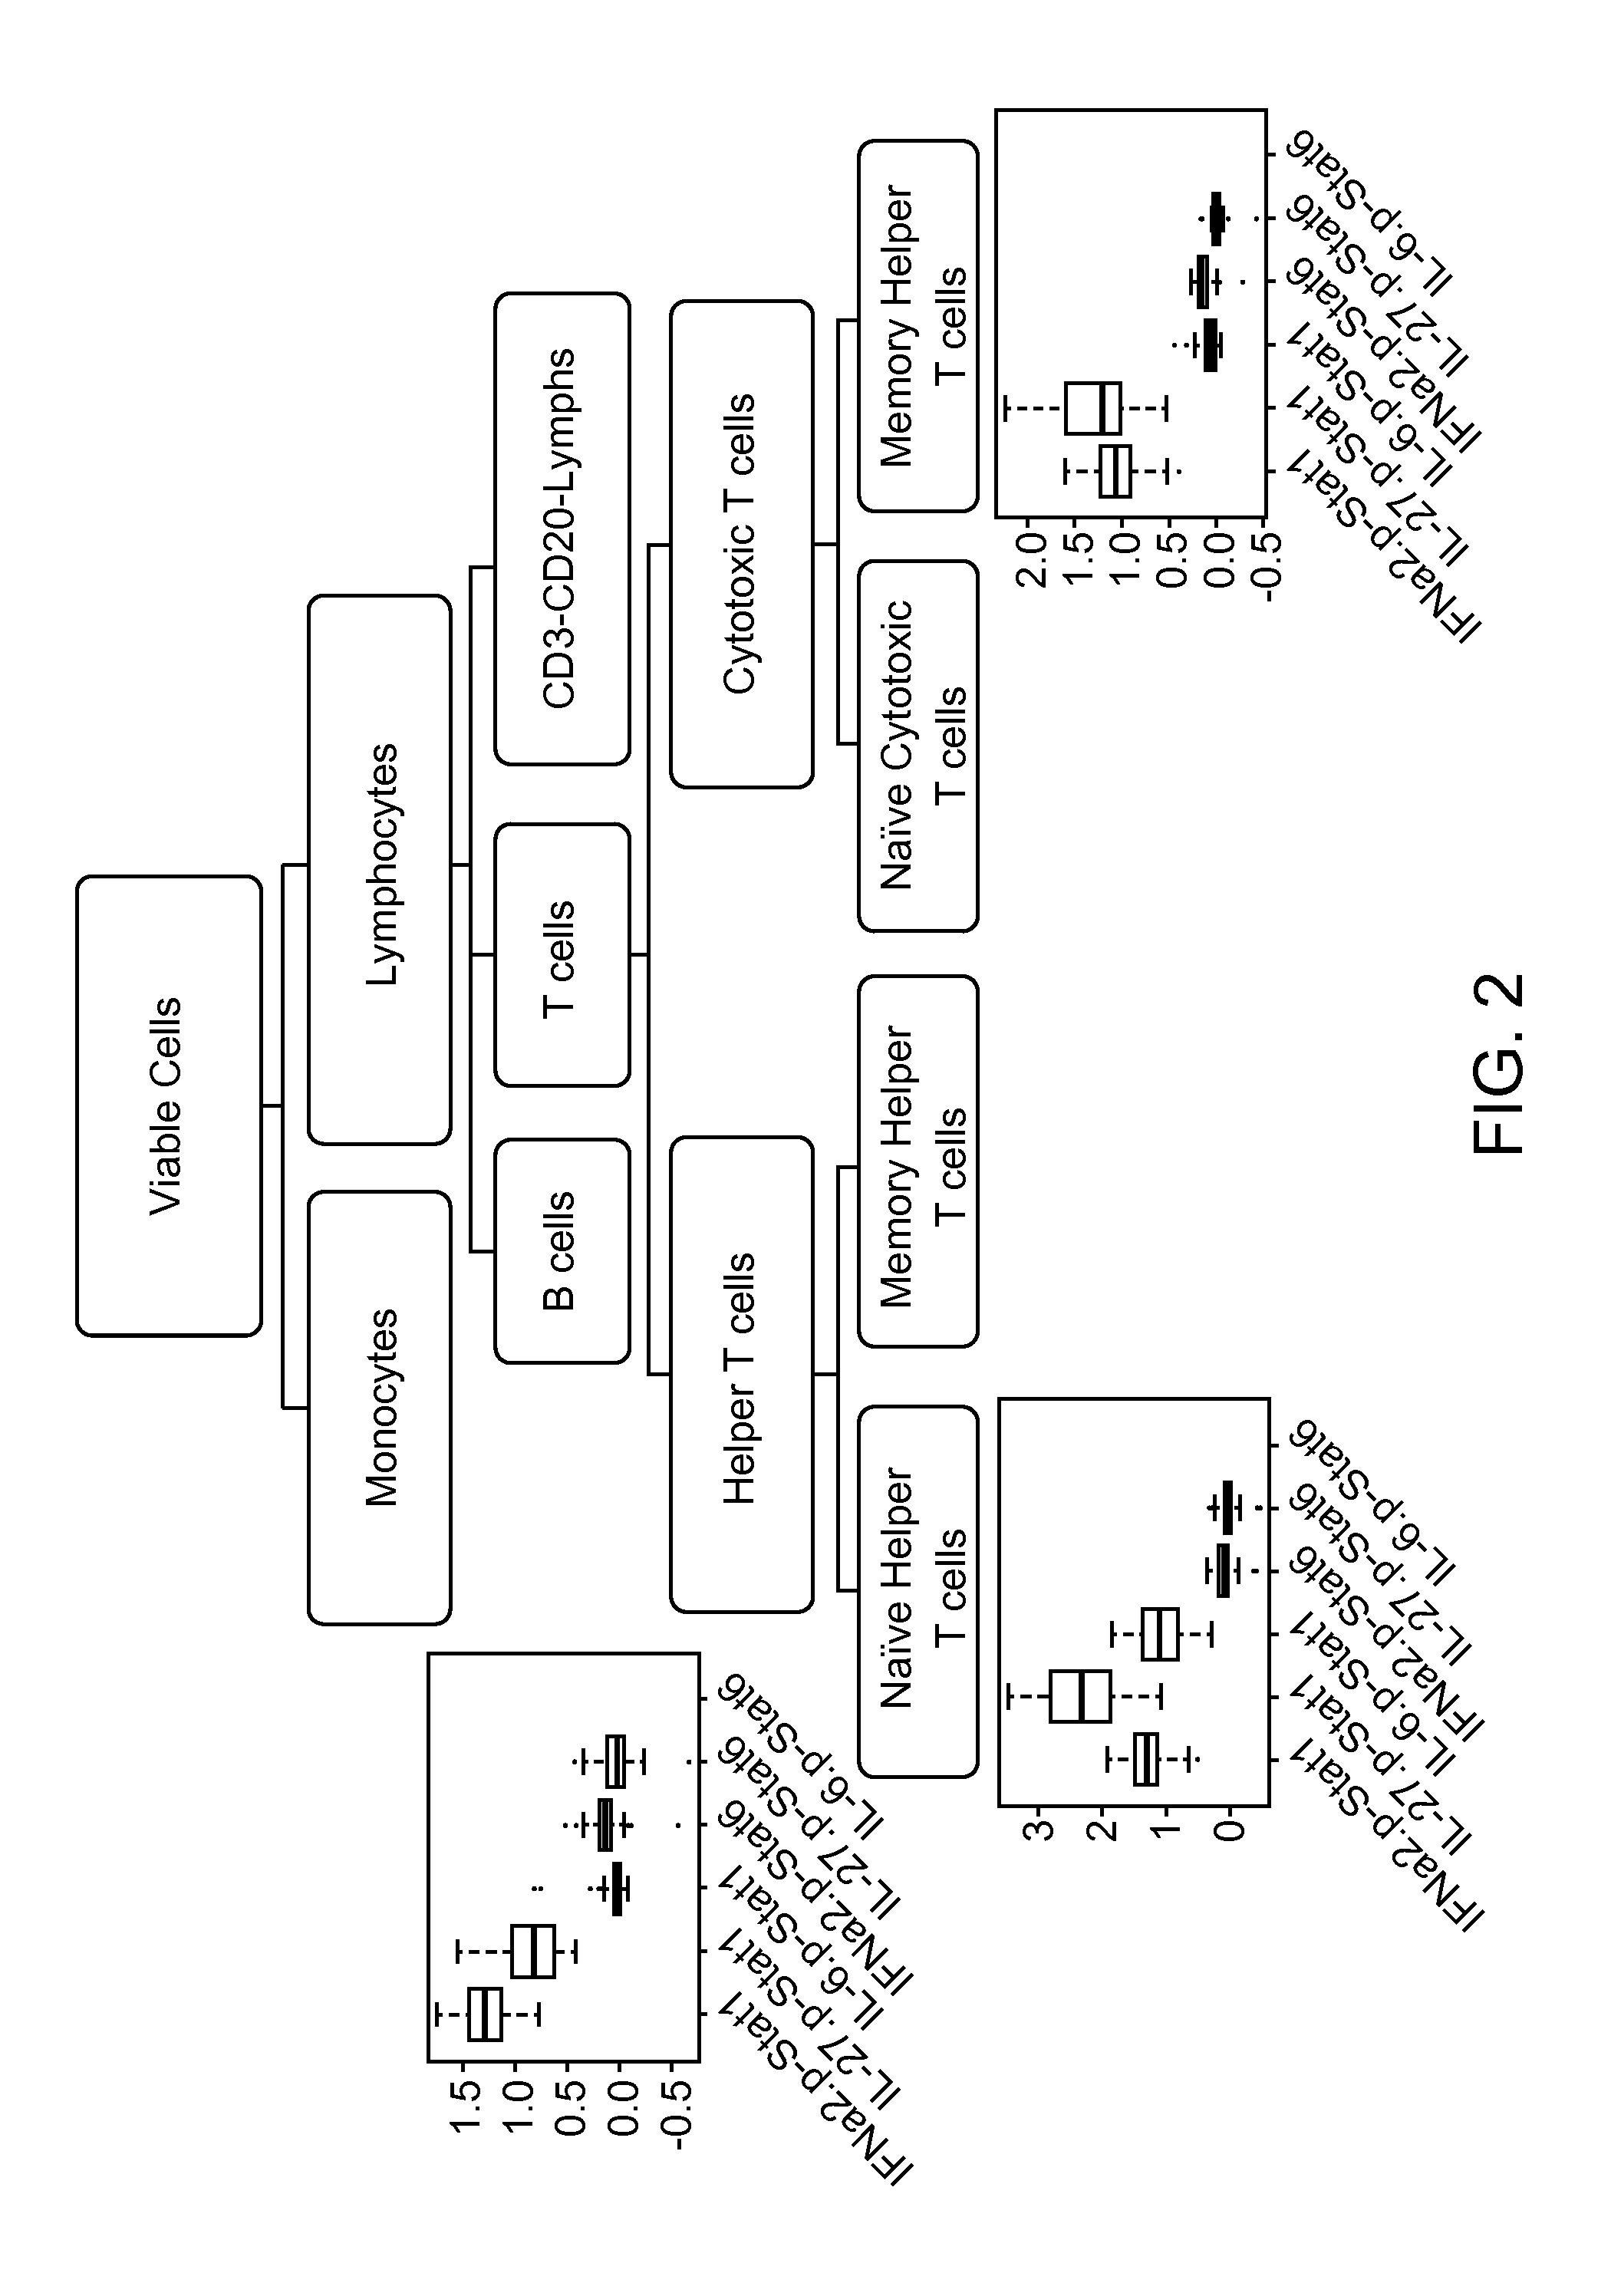
[0290]Kinetic response to varying concentrations of modulators was investigated in normal whole blood samples (i.e., samples from persons who have no diagnosis of disease). 11 normal samples were donated with informed consent by Nodality Inc. employees and processed at Nodality Inc. in South San Francisco, Calif. The samples were treated with 4 different modulators (GM-CSF, IL-27, IFNa and IL-6) at 4 different concentrations of the modulator and activation levels of pStat1, pStat3 and pStat5 were measured at different time points. Activation levels were measured at 3, 5, 10, 15, 30 and 45 minutes using flow cytometry-based single cell network profiling. The concentrations of the stimulators are tabulated below in Table 2:
TABLE 2Stimulator ConcentrationslowmedhiGM-CSF0.1ng / ml1ng / ml10ng / mlIL-271ng / ml10ng / ml100ng / mlIFNa1000IU4000IU100000IUIL-61ng / ml10ng / ml100ng / ml
[0291]The activation levels of ...
PUM
| Property | Measurement | Unit |
|---|---|---|
| temperature | aaaaa | aaaaa |
| concentration | aaaaa | aaaaa |
| cell surface | aaaaa | aaaaa |
Abstract
Description
Claims
Application Information