Data center analytics and dashboard

a data center and dashboard technology, applied in the field of data center analytics and dashboard, can solve the problems of data synchronization, high hardware cost, and inability to maintain disparate systems, and achieve the effect of rapid high-level assessment and increased ease and efficiency of business decisions

Active Publication Date: 2014-10-02
ORBIS TECHNOLOGIES
View PDF2 Cites 97 Cited by
  • Summary
  • Abstract
  • Description
  • Claims
  • Application Information

AI Technical Summary

Benefits of technology

[0007]To overcome the problems described above, a data center analytics and dashboard is disclosed that significantly increases the ease and efficiency of making business decisions based on semantic analysis of the enterprise content spread across one or more data sources. Such an approach provides a view of several high-level key indicators and summary analytics associated with the data (storage, originality, source,

Problems solved by technology

However, this is expensive for organizations in terms of maintaining the disparate systems, and there may be data synchronization issues, such as using an outdated customer address in one system even though the current address is persisted in a different system.
Additionally, an organization may be forced to spend money on hardware that is not required due to the proliferation of duplicate data.
Having this data duplication is sometimes intentional to preserve data linea

Method used


Image

  • Data center analytics and dashboard
  • Data center analytics and dashboard
  • Data center analytics and dashboard

Examples


Embodiment Construction

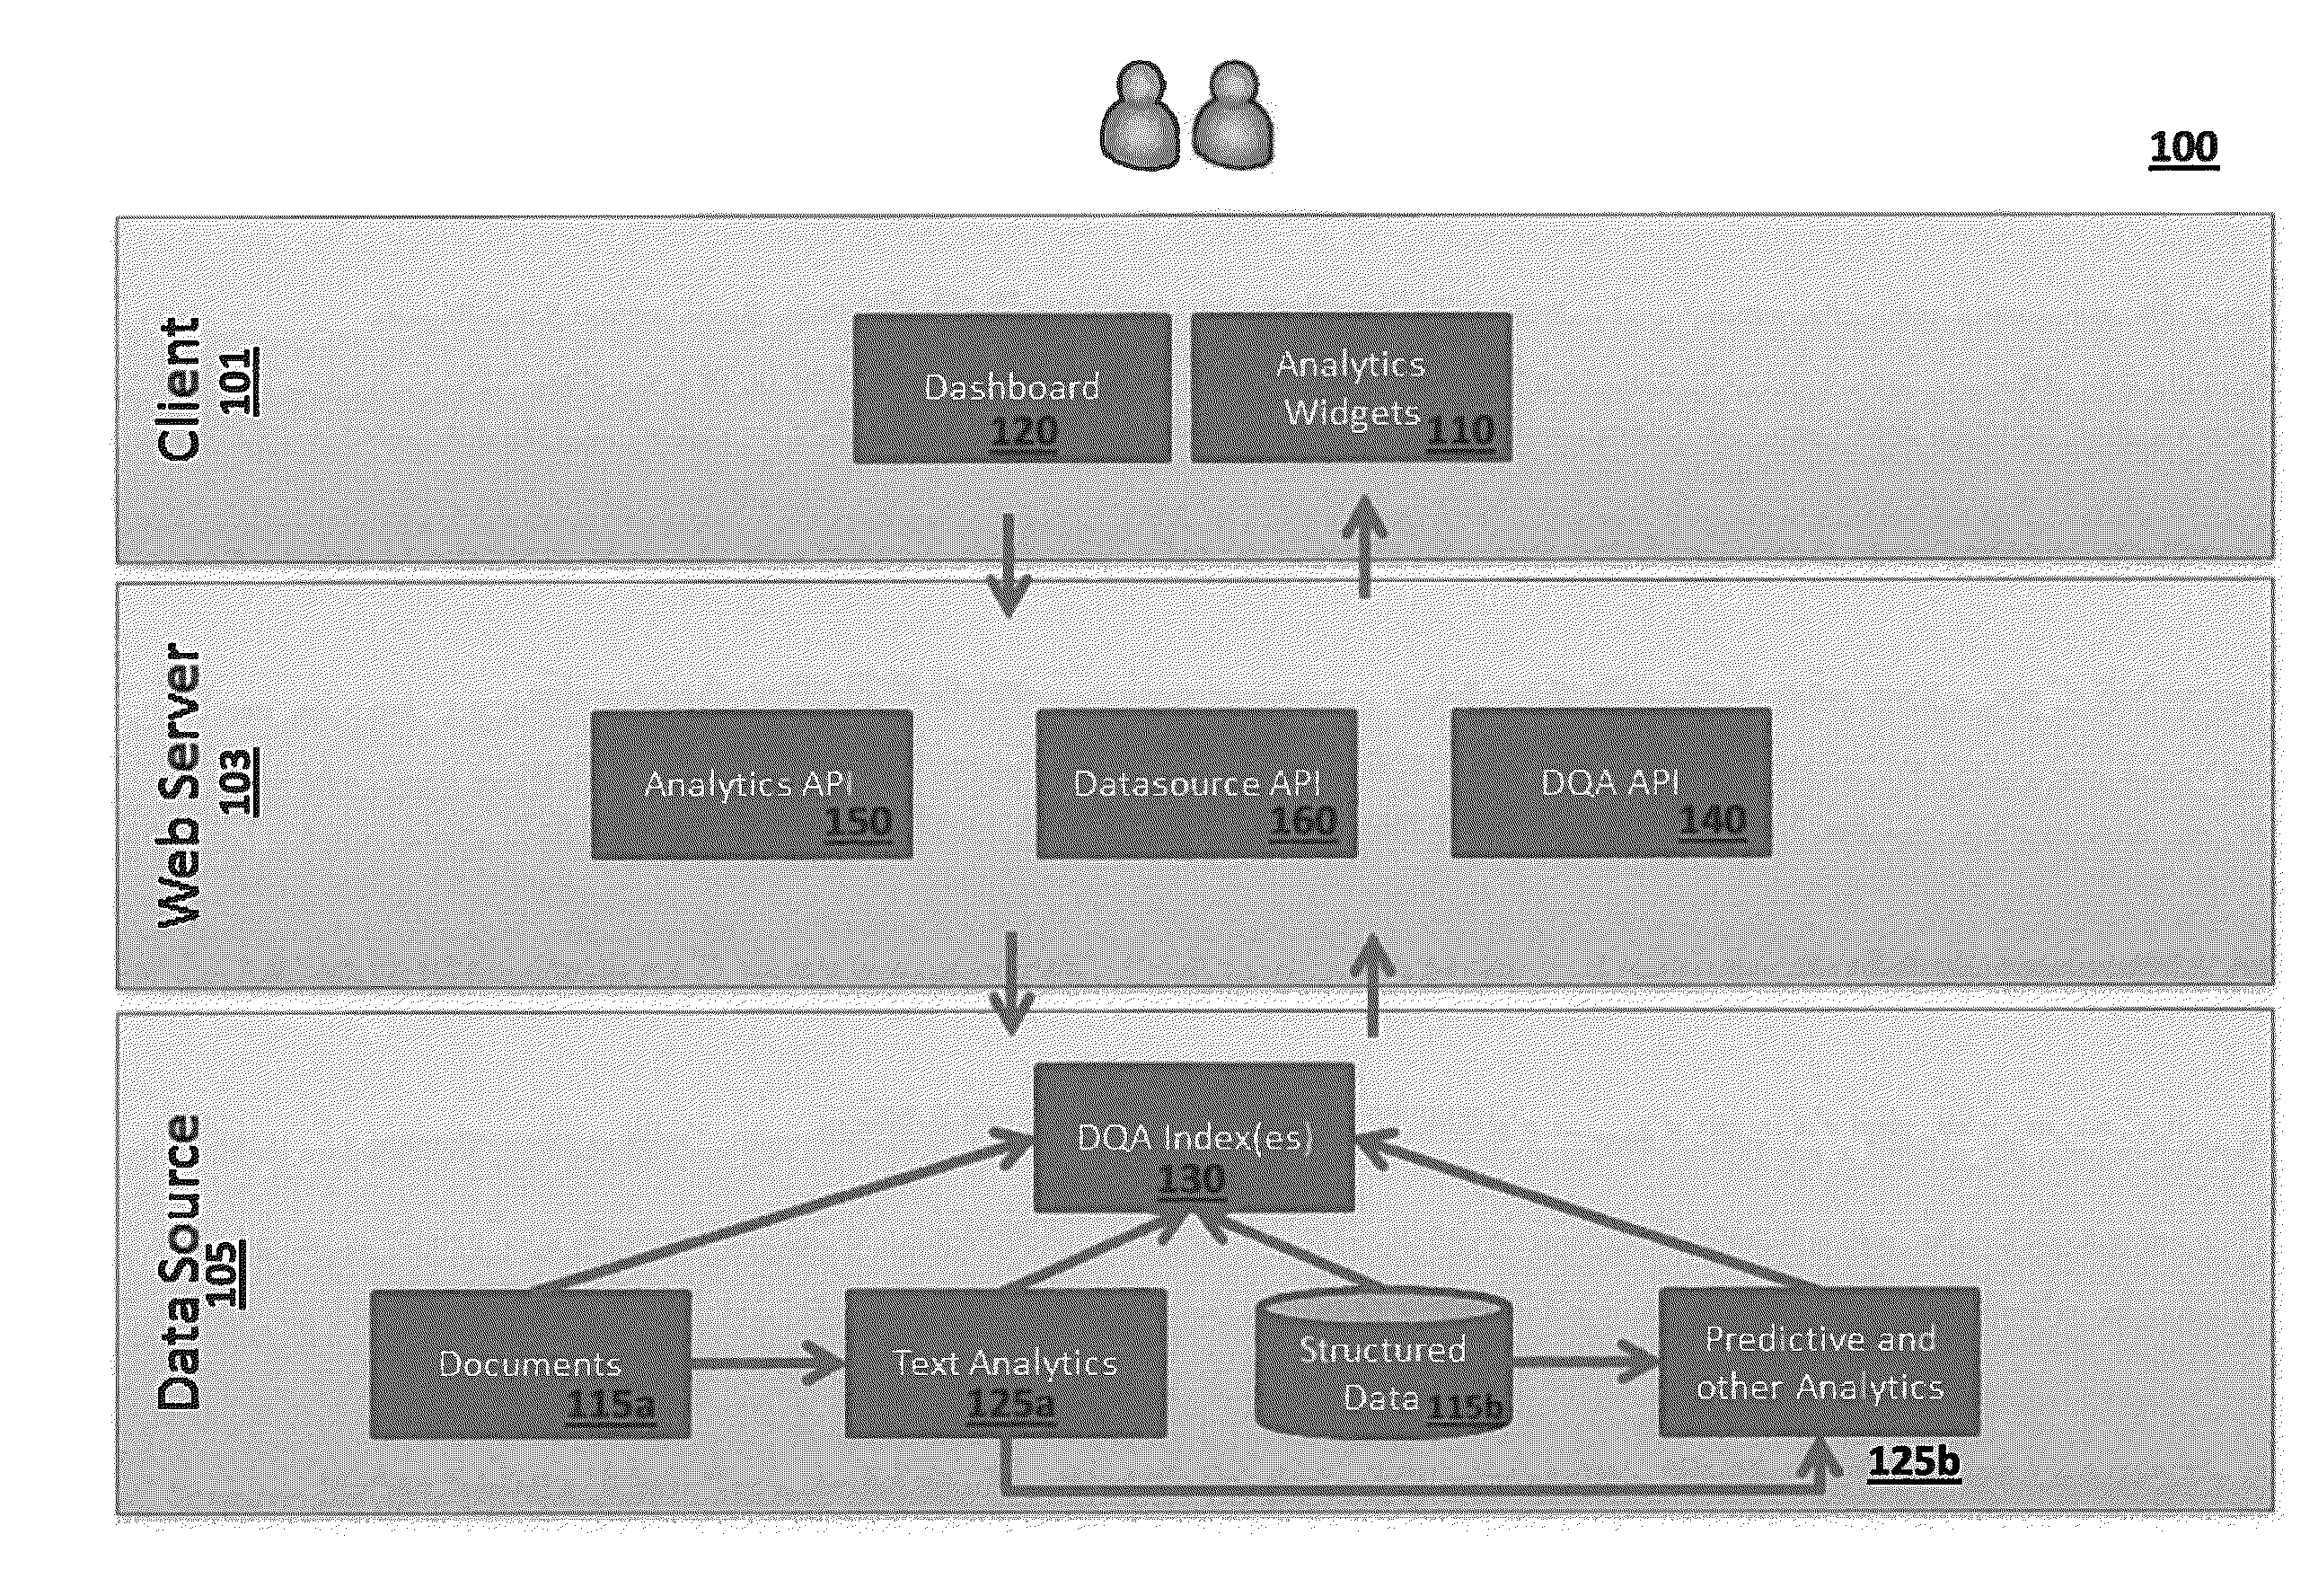
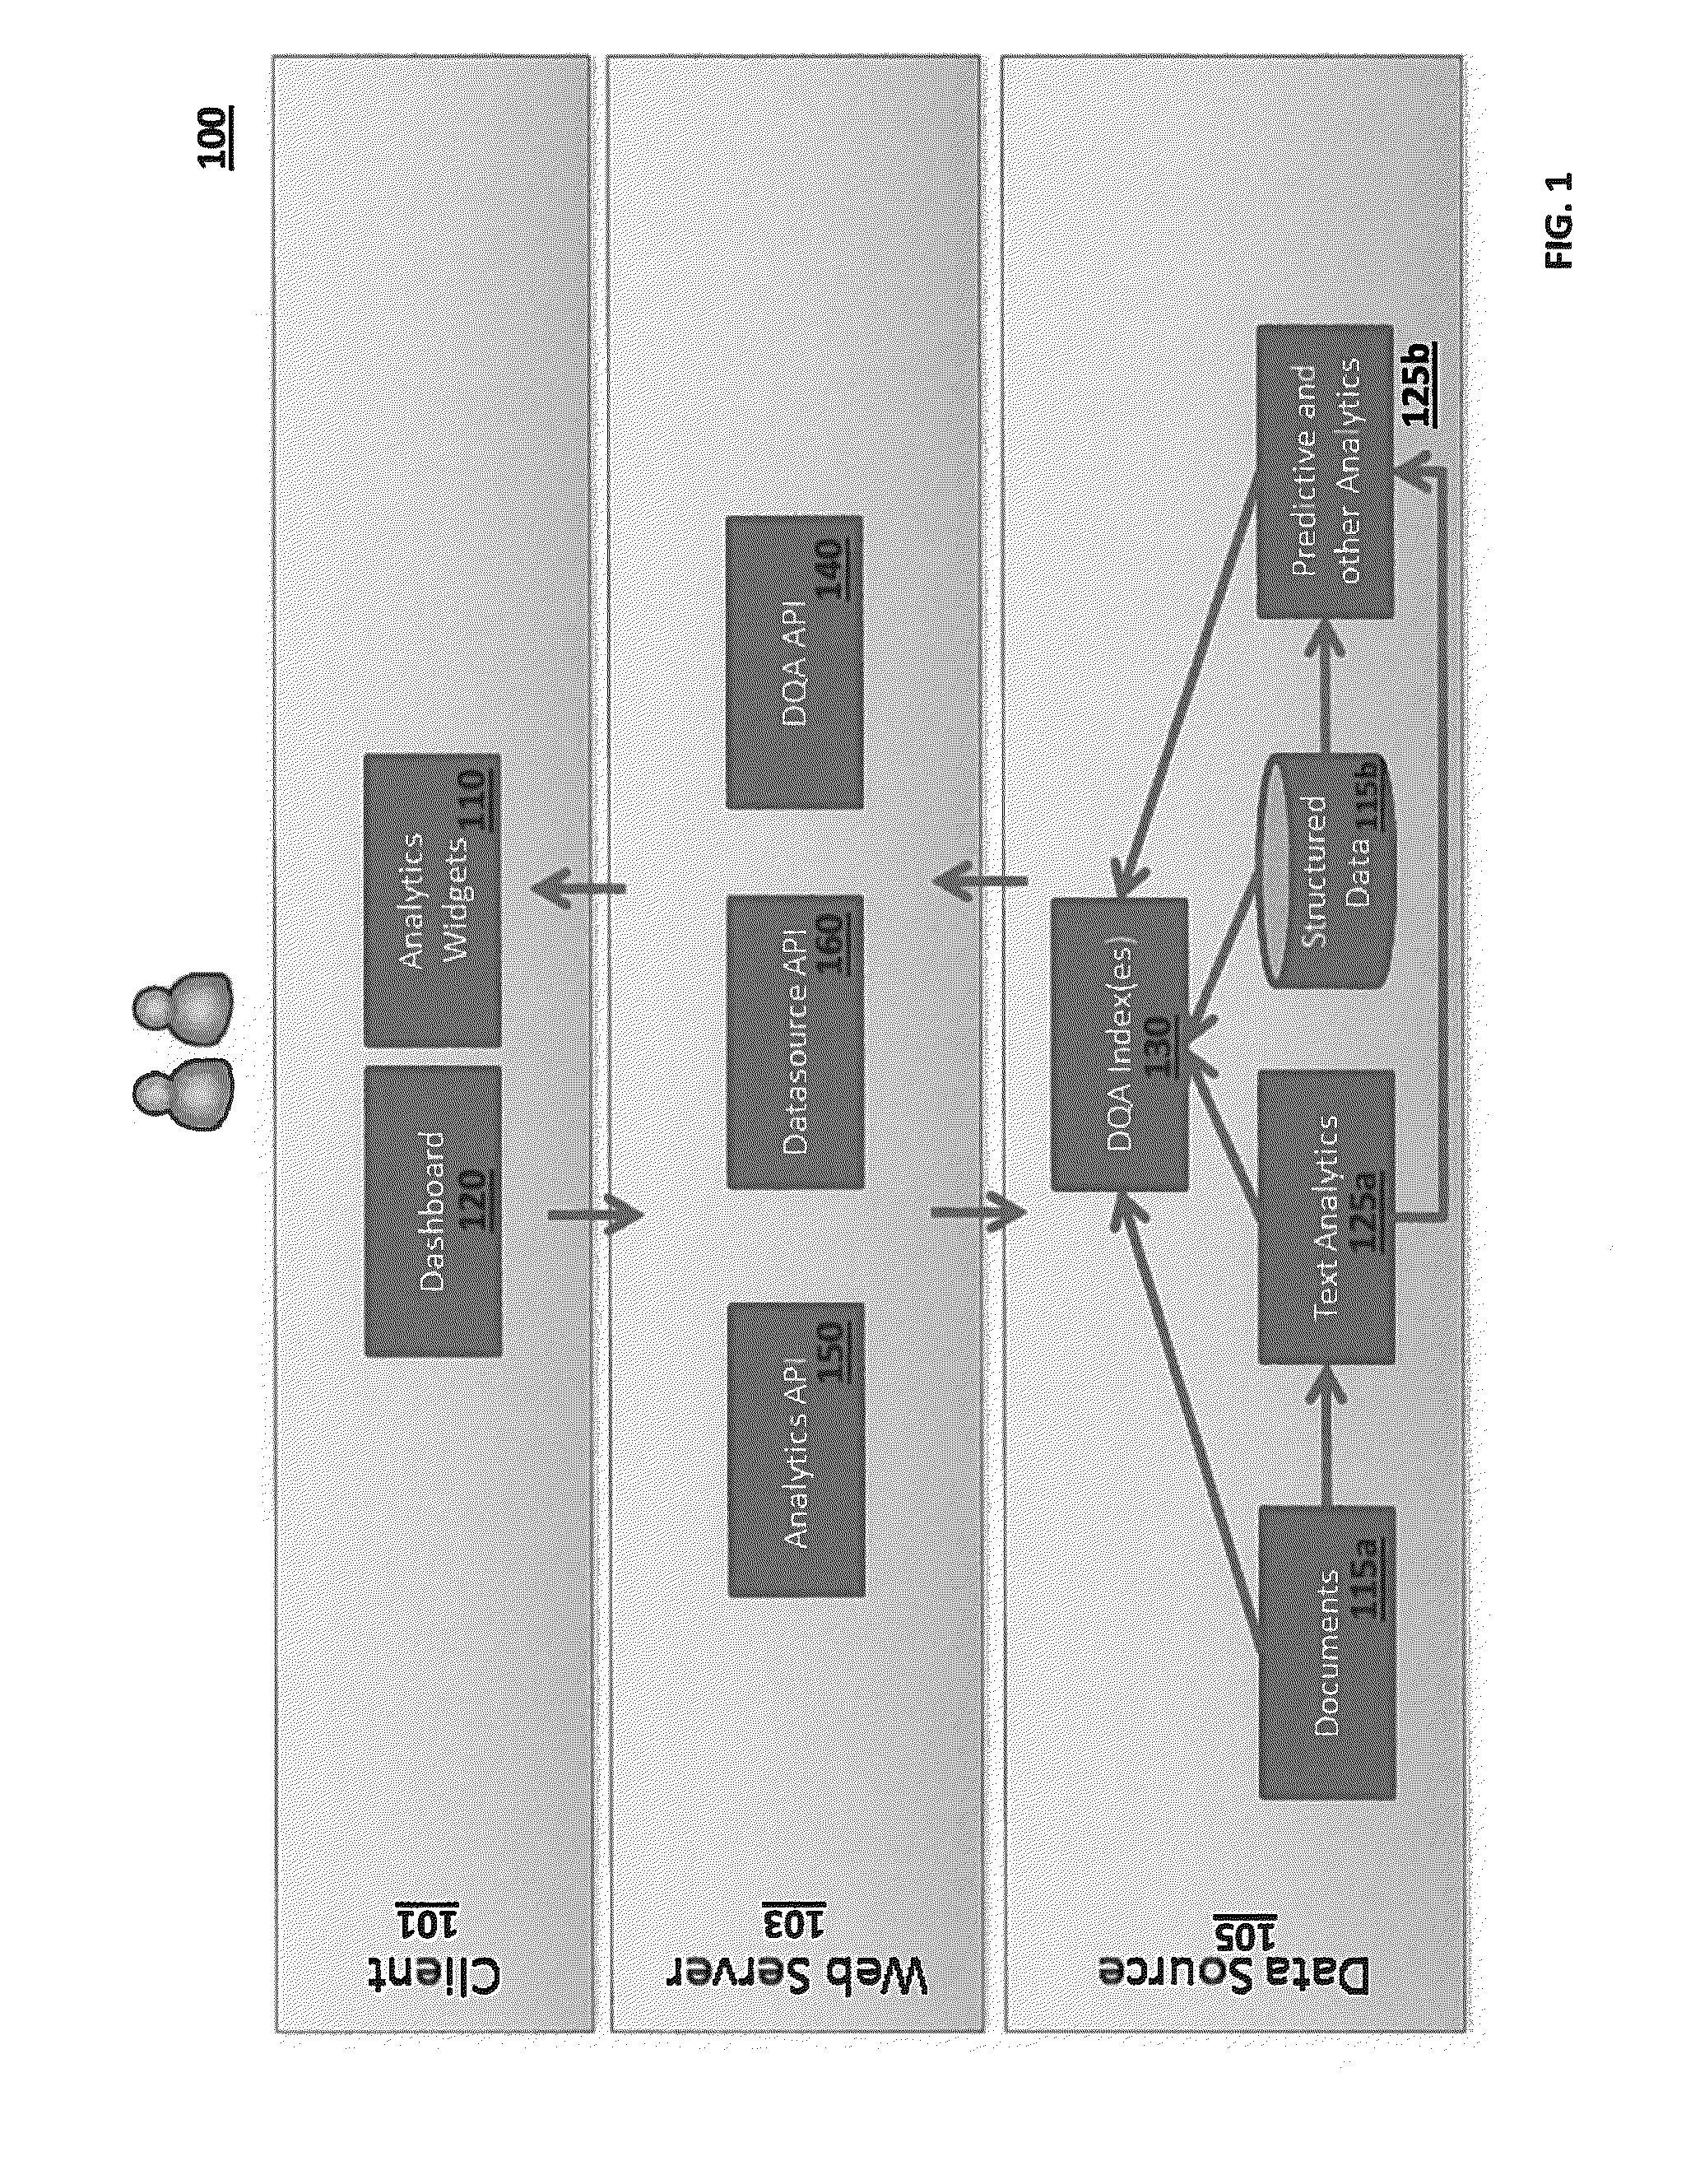
[0031]FIG. 1 is a block diagram illustrating a data quality analytics (“DQA”) system 100 according to some embodiments of the present invention. In the embodiment shown, the DQA system 100 includes client components 101, web server components 103, and data source components 105. Examples of client components include analytics widgets 110 and a dashboard 120. Examples of web server components include a DQA application programming interface (“API”) 140, an analytics API 150, and a datasource API 160. Examples of data source components include documents and structured data 115a and 115b, respectively, text analytics and predictive and other analytics 125a and 125b, respectively, and DQA index(es) 130.

[0032]A client may interact with the DQA system 100 using client components 101, including analytics widgets 110 and dashboard 120. On the backend, the DQA system 100 may consist of one or more servers, computers, and network devices to operate the DQA indexing and analytics component 130,...


PUM


Abstract

A method and system to evaluate data efficacy across an enterprise is disclosed. The method includes the step of indexing a set of data sources that include at least one of structured and unstructured data artifacts. The method further includes accessing the indexing on the one or more data sources with a computer. The method further includes the step of generating a plurality of analytics about the data sources based on the indexing, wherein the analytics include a plurality of: a document originality analytic, a corpus storage volume analytic, a data source ingest analytic, a document type analytic, and an analysis analytic. The method further includes displaying, on a display device, an interactive visualization of results based on the analytics, wherein the visualization comprises at least one of: a histogram, a graph, a timeline, a panel, a list, a chart, a popup, and a table.

Description

CROSS REFERENCE TO RELATED APPLICATIONS[0001]The present application claims priority benefit under 35 U.S.C. §119(e) of U.S. Provisional Patent Application No. 61 / 807,534 entitled “Data Center Analytics and Dashboard,” filed Apr. 2, 2013, the contents of which are incorporated herein by reference in their entirety.TECHNICAL FIELD[0002]The present invention relates to systems and methods to generate and display analytics for enterprise data spread across one or more data sources.BACKGROUND[0003]Organizations often have multiple systems that store and process the same or similar data. However, this is expensive for organizations in terms of maintaining the disparate systems, and there may be data synchronization issues, such as using an outdated customer address in one system even though the current address is persisted in a different system. Additionally, an organization may be forced to spend money on hardware that is not required due to the proliferation of duplicate data.[0004]In ...

Claims


Application Information

Patent Timeline
IPC IPC(8): G06N5/04
CPCG06N5/04G06Q10/00
Inventor CLARK, DAVIDBLENKHORN, ARI
Owner ORBIS TECHNOLOGIES
Why Eureka
Try Eureka