Methods and systems for determining global sensitivity of a process

a global sensitivity and process technology, applied in the field of computer implemented systems and methods for performing global sensitivity analysis, can solve the problems of increasing complexity of models, increasing computational complexity, and difficult (even expensive) program and analytically compute the required derivatives

Inactive Publication Date: 2016-02-25
THE ARIZONA BOARD OF REGENTS ON BEHALF OF THE UNIV OF ARIZONA
View PDF3 Cites 22 Cited by
  • Summary
  • Abstract
  • Description
  • Claims
  • Application Information

AI Technical Summary

Benefits of technology

[0024]In practice, the size of Δxi is usually selected in an ad-hoc manner. However, for significantly non-linear responses the resulting interpretation of sensitivity can itself be significantly sensitive to the size of Δxi. Further, numerical derivation of second- and higher-order partial derivatives can require large numbers of model runs. In certain cases, (including model calibration using performance metrics such as mean squared error), the Hessian matrix can be approximated using computations involving only first-order partial derivatives, resulting in significant computational savings.Global (Population Sample-Based) Sensitivity Analysis (GSA)
[0046]Computational Implementation: For simple, analytically tractable functions, the variance-based sensitivity indices can be calculated analytically. The Fourier Amplitude Sensitivity Test (FAST) provides an efficient way to numerically compute variance-based sensitivity indices. However, FAST can provide only first-order sensitivity indices, and a later development called the ‘extended FAST’ (EFAST) allows the computation of total effects.

Problems solved by technology

With continuous advances in understanding and computing power, such models are becoming more complex with increasingly more factors to be specified (model parameters, forcings, boundary conditions, etc.).
Such models are rapidly becoming increasingly more complex and computationally intensive, and are growing in dimensionality (both process and parameter), as they progressively and more rigorously reflect our growing understanding (or hypotheses) about the underlying real-world systems they are constructed to represent.
In a significant fraction of Earth Science models, their complexity makes it difficult (even expensive) to program and analytically compute the required derivatives, so it is common to estimate their values numerically via finite difference methods that approximate ∂xi by Δx1 over some small distance.
However, for significantly non-linear responses the resulting interpretation of sensitivity can itself be significantly sensitive to the size of Δxi.
Further, numerical derivation of second- and higher-order partial derivatives can require large numbers of model runs.
Local (point-based) sensitivity analysis has a unique definition and theoretical basis, but typically provides only a limited view of model sensitivity because the results (and hence interpretation) can vary with location in the factor space.
However, this problem of generalizing local sensitivity measures to represent ‘global’ properties (i.e., to somehow reflect the broader characteristics of sensitivity over a domain of interest) is not trivial and, so far, no unique and certain definition for global sensitivity exists.
Since absolute sensitivity can be difficult to quantify (given that it can vary with scaling or transformation of the factor space), it is usual to focus on the relative sensitivity of factors with respect to each other.
Further, even if high-order effects exist, they can be difficult to interpret, and in many cases may not have any actual physical relevance (i.e., they may be spurious artefacts of the modeling and / or system identification process).
This can result in highly non-monotonic and non-smooth response surfaces that can have multiple modes (i.e., ‘regions of attraction’ in the optimization sense).
However, if g4(x) 128 primarily represents noise due to data errors or numerical artefacts, such an interpretation can be highly misleading.
Further, OAT does not detect and measure factor interactions.
Further, because an m-level full factorial design in an n-dimensional factor space requires mn model runs, the approach is subject to the curse of dimensionality and computational cost can rapidly become prohibitive as problem dimension increases.
However, a major drawback of the regression-based approach is the need to pre-specify an appropriate form for the regression function, and if the regression equation does not fit the underlying response surface well, the sensitivity estimates can be seriously incorrect.
As such, the Sobol approach is unable to distinguish between response surface structures that might happen to have identical global variance of model response but completely different distributions and spatial organization of the performance metric and its derivatives.
The absence of a unique definition for sensitivity can result in different, even conflicting, assessments of the underlying sensitivities for a given problem.b. Computational Cost—The cost of carrying out SA can be large, even excessive, for high-dimensional problems and / or computationally intensive models.

Method used


Image

  • Methods and systems for determining global sensitivity of a process
  • Methods and systems for determining global sensitivity of a process
  • Methods and systems for determining global sensitivity of a process

Examples


example 1

Six-Dimensional Response Surface without Interactions

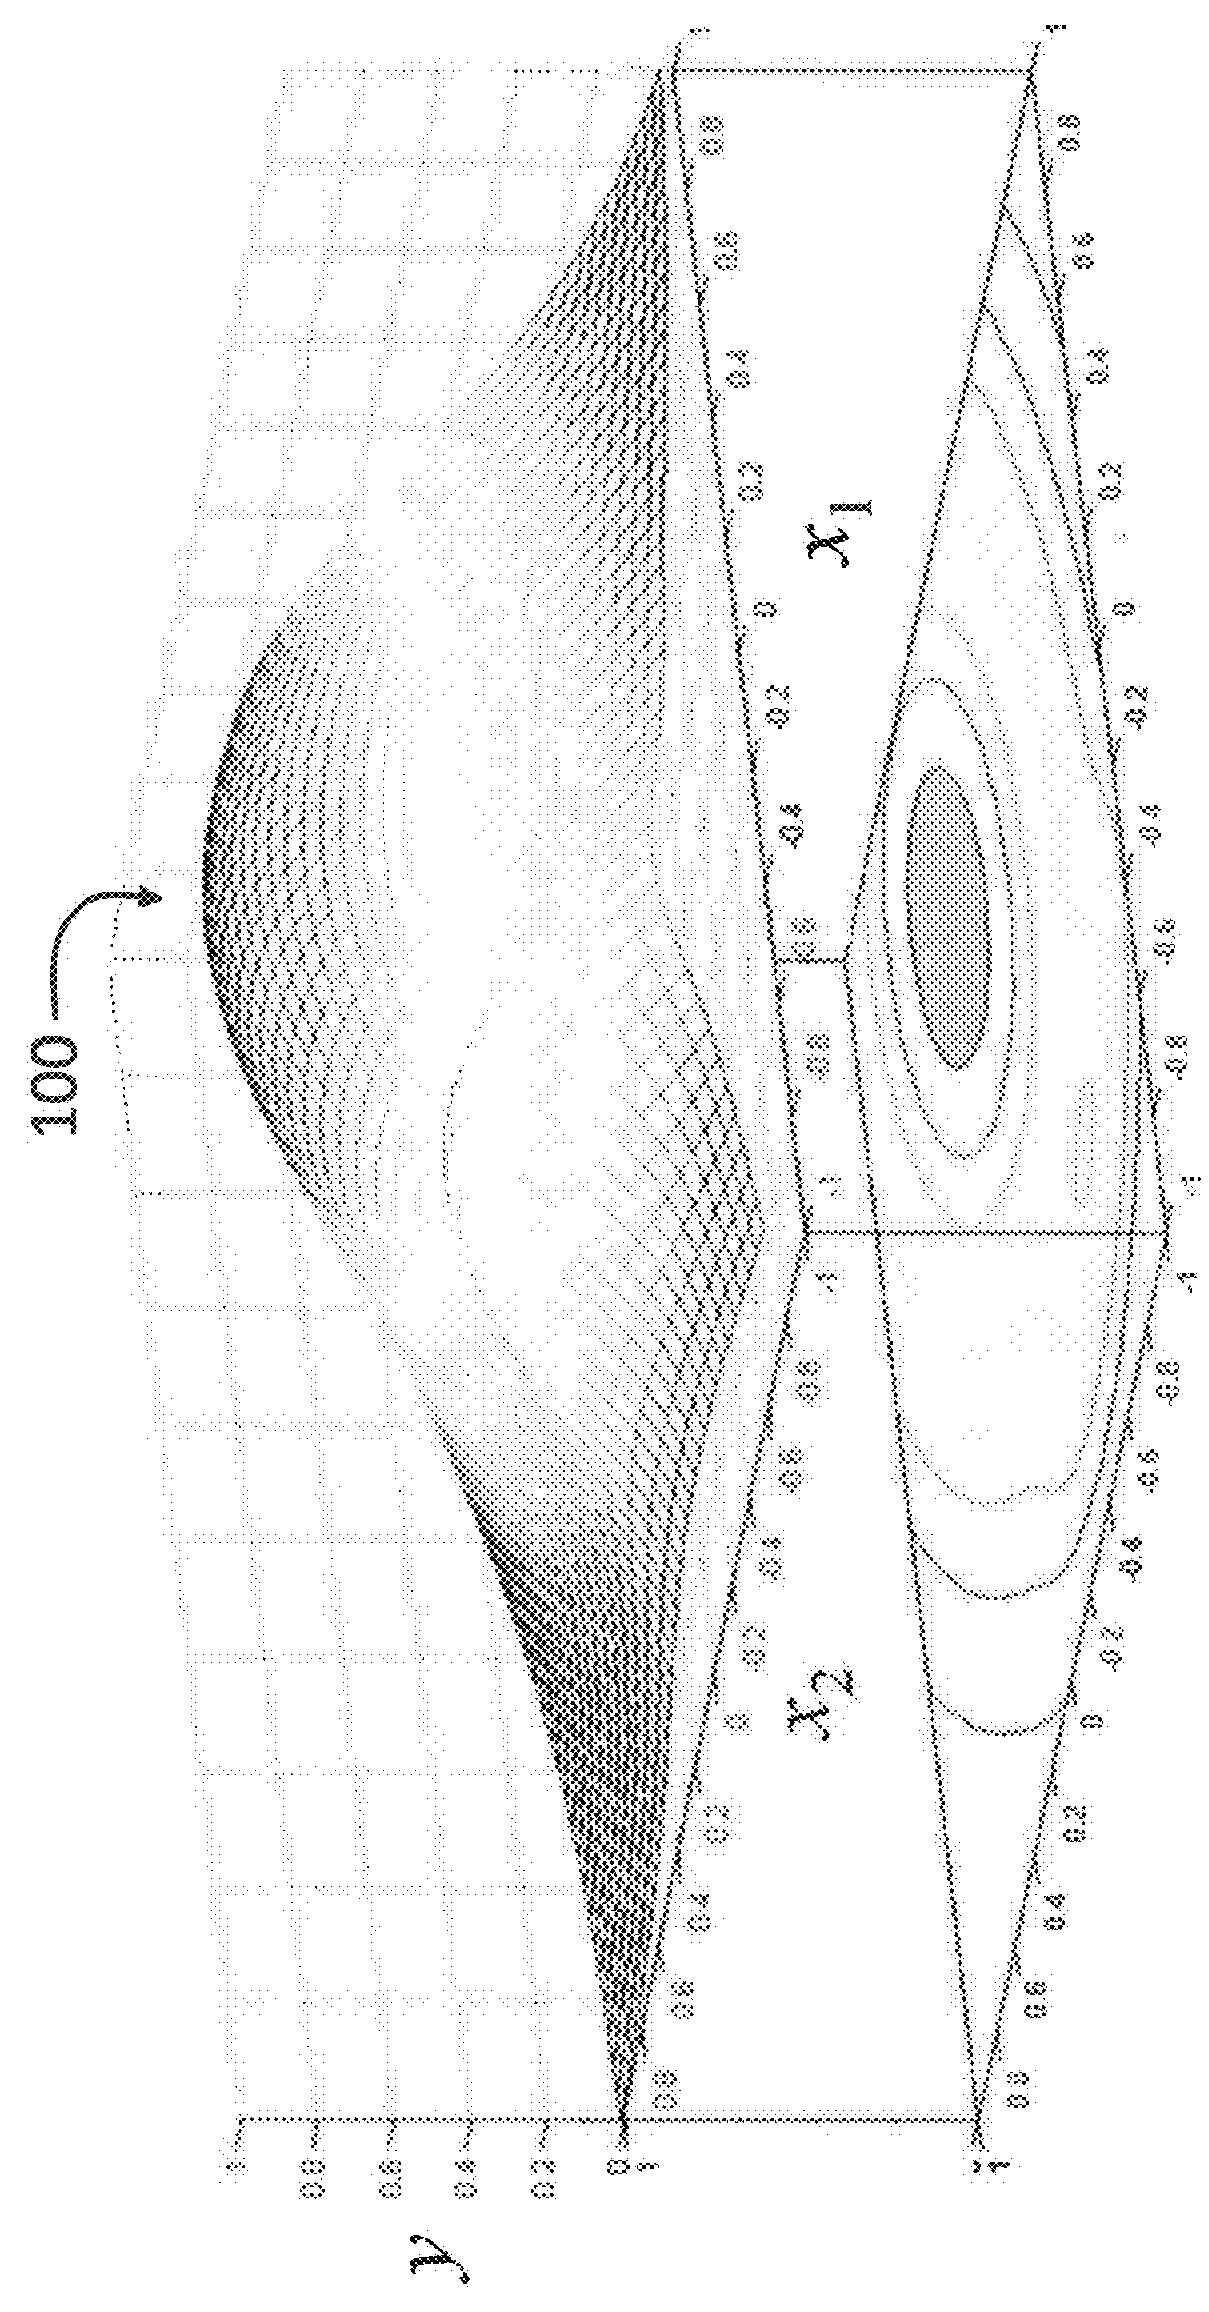
[0129]FIG. 10 illustrates a synthetic test function with six fully non-interacting factors. The function ƒ(·) is constructed as the sum of six one-factor functions, g1(·) . . . , g6(·), as follows:

y=ƒ(x1, . . . ,x6)=g1(x1)+g2(x2)+ . . . +g6(x6)  (Eq-16)

where:

g1(x1)=−sin(πx1)−0.3 sin(3.33πx1)  (Eq-16a)

g2(x2)=−0.76 sin(π(x1−0.2))−0.315  (Eq-16b)

g3(x3)=−0.12 sin(1.05π(x1−0.2))−0.02 sin(95.24πx1)−0.96  (Eq-16c)

g4(x4)=−0.12 sin(1.05π(x1−0.2))−0.96  (Eq-16d)

g5(x5)=−0.05 sin(π(x1−0.2))−1.02  (Eq-16e)

g6(x6)=−1.08  (Eq-16f)

[0130]Intuitively, the sensitivity of the factors in Eq-16 may be ranked as follows: x1>x2>x3>x4>x5>x6. Comparing x1 and x2, the effect of x1 is more complex (bi-modal), the slope along x1 is generally larger, and also x1 controls a larger range of variation in y. The effect of x3 is effectively similar to the effect of x4, augmented by some degree of roughness (high frequency and low amplitude noise). Such roughness is ...

example 2

5-Parameter Conceptual Rainfall-Runoff Model

[0140]The second example uses the commonly available HYMOD model to simulate the rainfall-runoff response of the 1944 km2 Leaf River watershed, located north of Collins, Miss. Here, sensitivity of the Nash-Sutcliffe criterion is evaluated (i.e., goodness-of-fit of the model to observation) to variations in the five model parameters across their feasible range. The five parameters are the maximum storage capacity in the catchment, Cmax (unit L), the degree of spatial variability of the soil moisture capacity within the catchment, bexp (unitless), the factor distributing the flow between the two series of reservoirs, Alpha (unitless), and the residence times of the linear quick and slow reservoirs, Rq (unit T) and Rs (unit T). For simplicity of presentation, all factors were scaled so that their feasible ranges correspond to [0-1].

[0141]FIGS. 15A-15D show the VARS products obtained for the second example. The directional variogram of Rq is l...

example 3

45-Parameter Land Surface Scheme-Hydrology Model

[0143]The third example is conducted utilizing the MESH modelling system which couples the Canadian Land Surface Scheme (CLASS) with land-surface parameterization and hydrological routing schemes used by WATFLOOD. The study area is the White Gull basin with a drainage area of 603 km2, which is a research site of Boreal Ecosystems Atmosphere Study (BOREAS) located in Saskatchewan, Canada. The model's 45 surface and subsurface parameters were calibrated by maximizing the Nash-Sutcliffe criterion with regards to streamflow. This case study provides a rigorous test of the efficiency of the VARS approach, since the model is computationally intensive, with each model run requiring approximately 30 seconds of computer time.

[0144]To begin, FIG. 17 shows a VARS assessment conducted using 250 star points (requiring 101,500 model runs). The 45 estimated directional parameter variograms show quite simple forms, and reveal that LAMIN4 is the least ...


PUM


Abstract

Systems and methods for determining the sensitivity of a model to a factor are disclosed. A directional variogram corresponding to a response surface of the model is determined. The variogram is then output as an indication of the sensitivity of the model.

Description

BACKGROUND[0001]1. Technical Field Text[0002]Embodiments of the invention relate to computer implemented systems and methods for performing global sensitivity analysis.[0003]2. Background Information[0004]Computer simulation models are essential components of research, design, development, and decision-making in science and engineering. With continuous advances in understanding and computing power, such models are becoming more complex with increasingly more factors to be specified (model parameters, forcings, boundary conditions, etc.). To facilitate better understanding of the role and importance of different model factors in producing the model responses, ‘Sensitivity Analysis’ (SA) is helpful. There are a variety of approaches towards sensitivity analysis that formally describe different “intuitive” understandings of the sensitivity of one or multiple model responses to different factors such as model parameters or forcings. Further, the objectives of SA can vary with applicatio...

Claims


Application Information

Patent Timeline
Patent Type & Authority Applications(United States)
IPC IPC(8): G06F17/18G06F17/50
CPCG06F17/5009G06F17/18G06Q10/067G06F30/20
Inventor RAZAVI, SEYED SAMANGUPTA, HOSHIN V.
Owner THE ARIZONA BOARD OF REGENTS ON BEHALF OF THE UNIV OF ARIZONA
Why Eureka
Try Eureka