Look ahead pore pressure prediction

a pore pressure prediction and pore pressure technology, applied in the direction of survey, directional drilling, borehole/well accessories, etc., can solve the problem of compromising the resistivity measurement within the neighboring shale, and achieve the effect of low resistance value, good results and salinity increas

Inactive Publication Date: 2016-07-28
STATOIL GULF SERVICES
View PDF4 Cites 4 Cited by
  • Summary
  • Abstract
  • Description
  • Claims
  • Application Information

AI Technical Summary

Benefits of technology

[0015]The method may also include the detection of an upcoming sudden pressure increase (e.g., overpressure sand). In order to do this, resistivity and porosity are normalized by the resistivity and porosity value obtained in the previous step when the measurements cross the threshold of a dangerous situation. From that point, a new non-dimensional cross plot is made that starts from the value on the normalized resistivity and porosity (the value being one and one). All the subsequent measured values of resistivity and porosity are normalized and followed while drilling: the normalized values while drilling are going to make a trajectory that is followed in the new non-dimensional crossplot. The trajectory of the subsequent normalized resistivity and porosity is expected to go to values larger than the resistivity reference and smaller than the porosity reference with increasing depth. Thus, in the normalized plot, the value of normalized resistivity is expected to be larger than 1 with increasing depth, and the value of normalized porosity is expected to be lower than 1 with increasing depth. The resistivity value is larger than the reference at a shallow point because compaction is acting with increasing depth. Porosity is expected to be smaller than the reference for the same reason. The normalization eliminates any other effects, like salinity, that could push the resistivity lower than the reference. In fact, salinity is expected to increase with depth. As such, the normalization is going to make salinity a second order effect within the analyzed interval deeper than the reference, if the surrounding pore pressure is high enough. In fact, the overpressure is high at this point in depth because a first warning was sent (previous point) that the region is characterized by high overpressure. Note that in this context, normalization has also the meaning of a zoom in the porosity resistivity cross plot. A threshold should be set for the measured averaged porosity to be small enough: a value of porosity lower than 24%, preferably lower than 20%, more preferably lower than 17% has given good results in all the cases analyzed. If the porosity is larger than this value, other mechanisms could be driving the porosity resistivity cross plot (for example salinity) even with a large enough pore pressure so that a low value of resistivity w

Problems solved by technology

The presence of hydrocarbon in that section could comprom

Method used


Image

  • Look ahead pore pressure prediction
  • Look ahead pore pressure prediction
  • Look ahead pore pressure prediction

Examples


Embodiment Construction

[0023]The present invention will now be described with reference to the accompanying drawings.

[0024]The present invention is directed to a predictable relationship between resistivity and porosity (derived from density) that occurs up to 300 meters above an overpressured sandstone in the overlying shales. Because high overpressure from a sand body is communicated to the shale above, a variation from the normal trend of the resistivity / porosity (or any other combination of variables, like resistivity and velocity) field is expected when approaching the high overpressured sand.

[0025]The present invention is also directed to a two-warning system based on this information. First, an early warning alerts that there is an overpressured region below. Then, a second warning occurs when the overpressured layer is approaching in order to better locate it.

[0026]As a drill bit drills, porosity and resistivity are measured and plotted on a graph with porosity on the x-axis and resistivity on the...


PUM


Abstract

A method for predicting jumps in pore pressure of a subsurface includes the steps of obtaining a porosity and a resistivity log value while drilling; dividing a cross plot of the porosity and the resistivity log values into two regions where the split of the two regions is based on the following (I): R=0.062/ø1.5; averaging the obtained porosity and resistivity log values in the subsurface within a set interval to obtain a representative value of resistivity and porosity for the subsurface within the set interval; and giving a first warning of a high overpressure region if the representative value of resistivity at the representative value of porosity is lower than 0.062/ø1.5. The method may also include giving a second warning that a jump in pore pressure is coming within 100-300 meters if the normalized values of resistivity and porosity has a turning down point in its trajectory.

Description

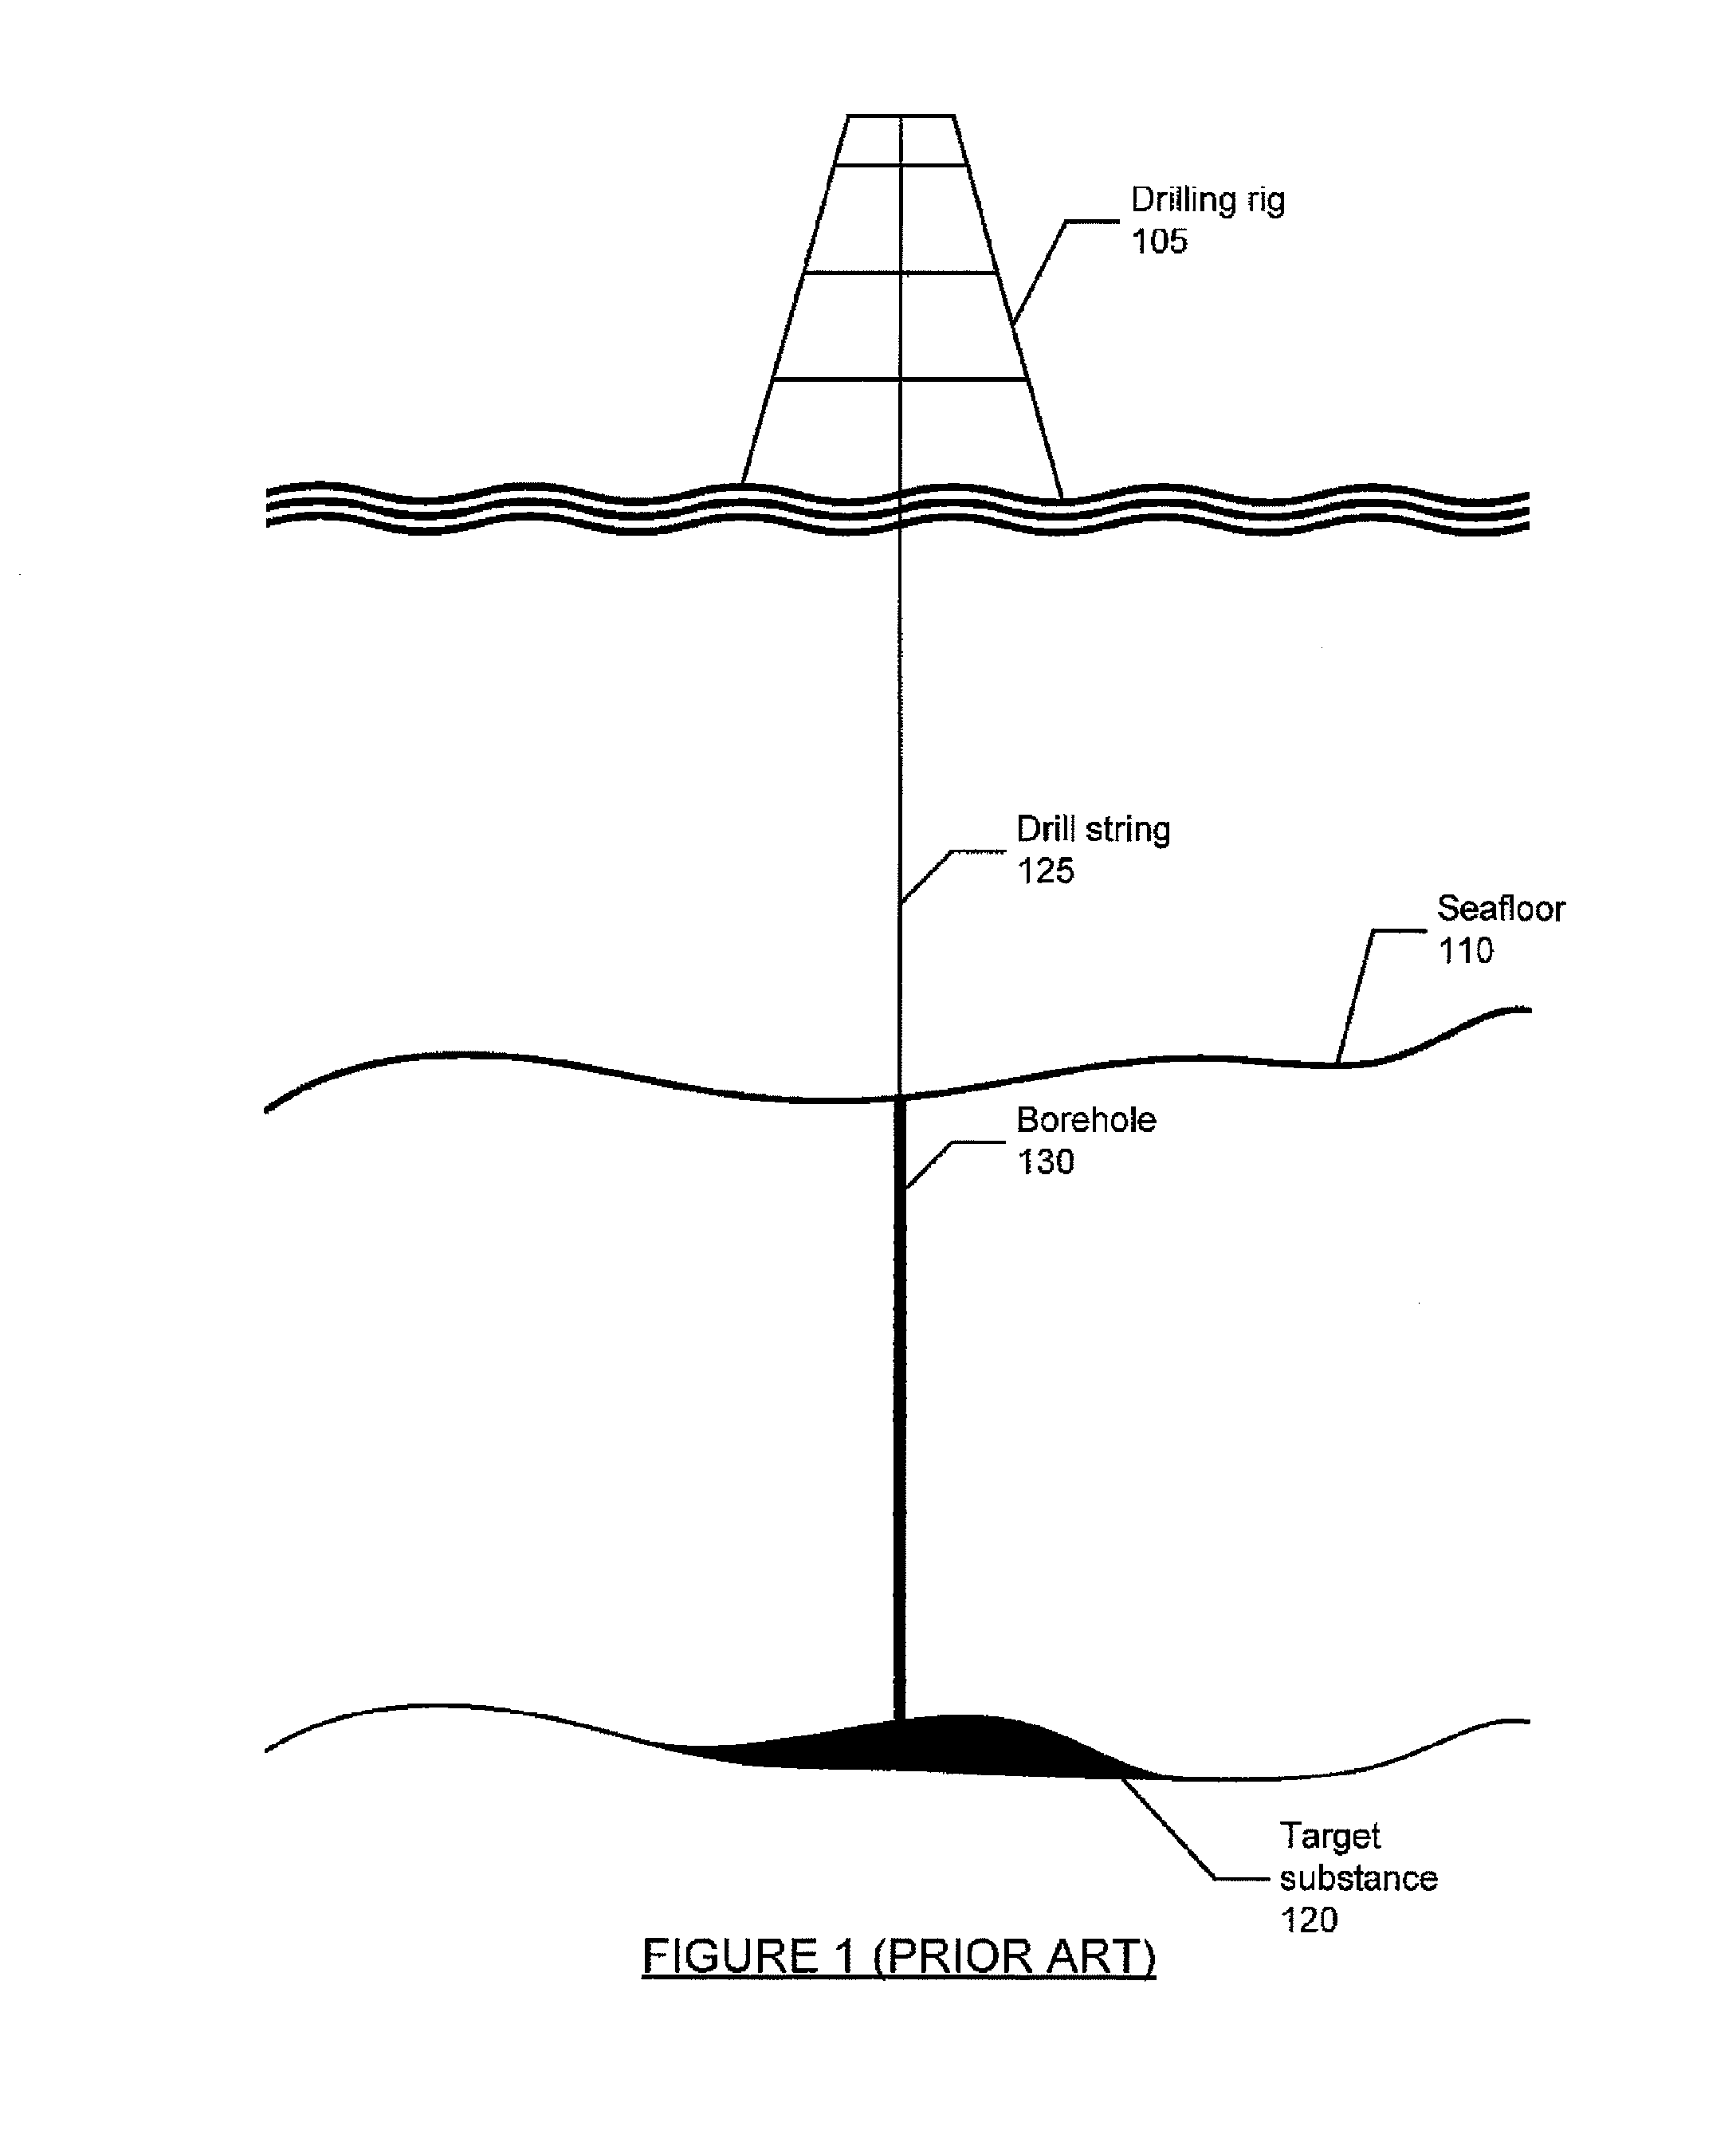
BACKGROUND OF THE INVENTION[0001]1. Field of the Invention[0002]The present invention relates to look ahead pore pressure prediction. This system provides a warning if a high overpressure regions is being drilled. The system then provides a second warning when a high overpressure sand is approaching within 300 meters from the drill bit.[0003]2. Description of Background Art[0004]FIG. 1 shows an exemplary diagram of a drilling operation. One of ordinary skill in the art will appreciate that the drilling operation shown in FIG. 1 is provided for exemplary purposes only and accordingly should not be construed as limiting the scope of the present invention. For example, the drilling operation shown in FIG. 1 is a seafloor drilling operation, but the drilling operation may alternatively be a land drilling operation.[0005]As shown in FIG. 1, a drilling rig 105 is configured to drill into a formation (e.g., a formation below a seafloor 110) using a drill bit (not shown) coupled to the dist...

Claims


Application Information

Patent Timeline
IPC IPC(8): E21B7/00E21B47/06
CPCE21B47/06E21B7/00E21B7/04
Inventor DE PRISCO, GIUSEPPEBREVIK, IVARPALACIOS, ALEJANDRO BELLO
Owner STATOIL GULF SERVICES
Why Eureka
Try Eureka