Network data visualization system and method for downloading visualization software to a user station after user authentication

Inactive Publication Date: 2001-05-29
BRITISH TELECOMM PLC
View PDF27 Cites 82 Cited by
  • Summary
  • Abstract
  • Description
  • Claims
  • Application Information

AI Technical Summary

Problems solved by technology

There are many scenarios in which a user may ha

Method used


Image

  • Network data visualization system and method for downloading visualization software to a user station after user authentication
  • Network data visualization system and method for downloading visualization software to a user station after user authentication
  • Network data visualization system and method for downloading visualization software to a user station after user authentication

Examples


Embodiment Construction

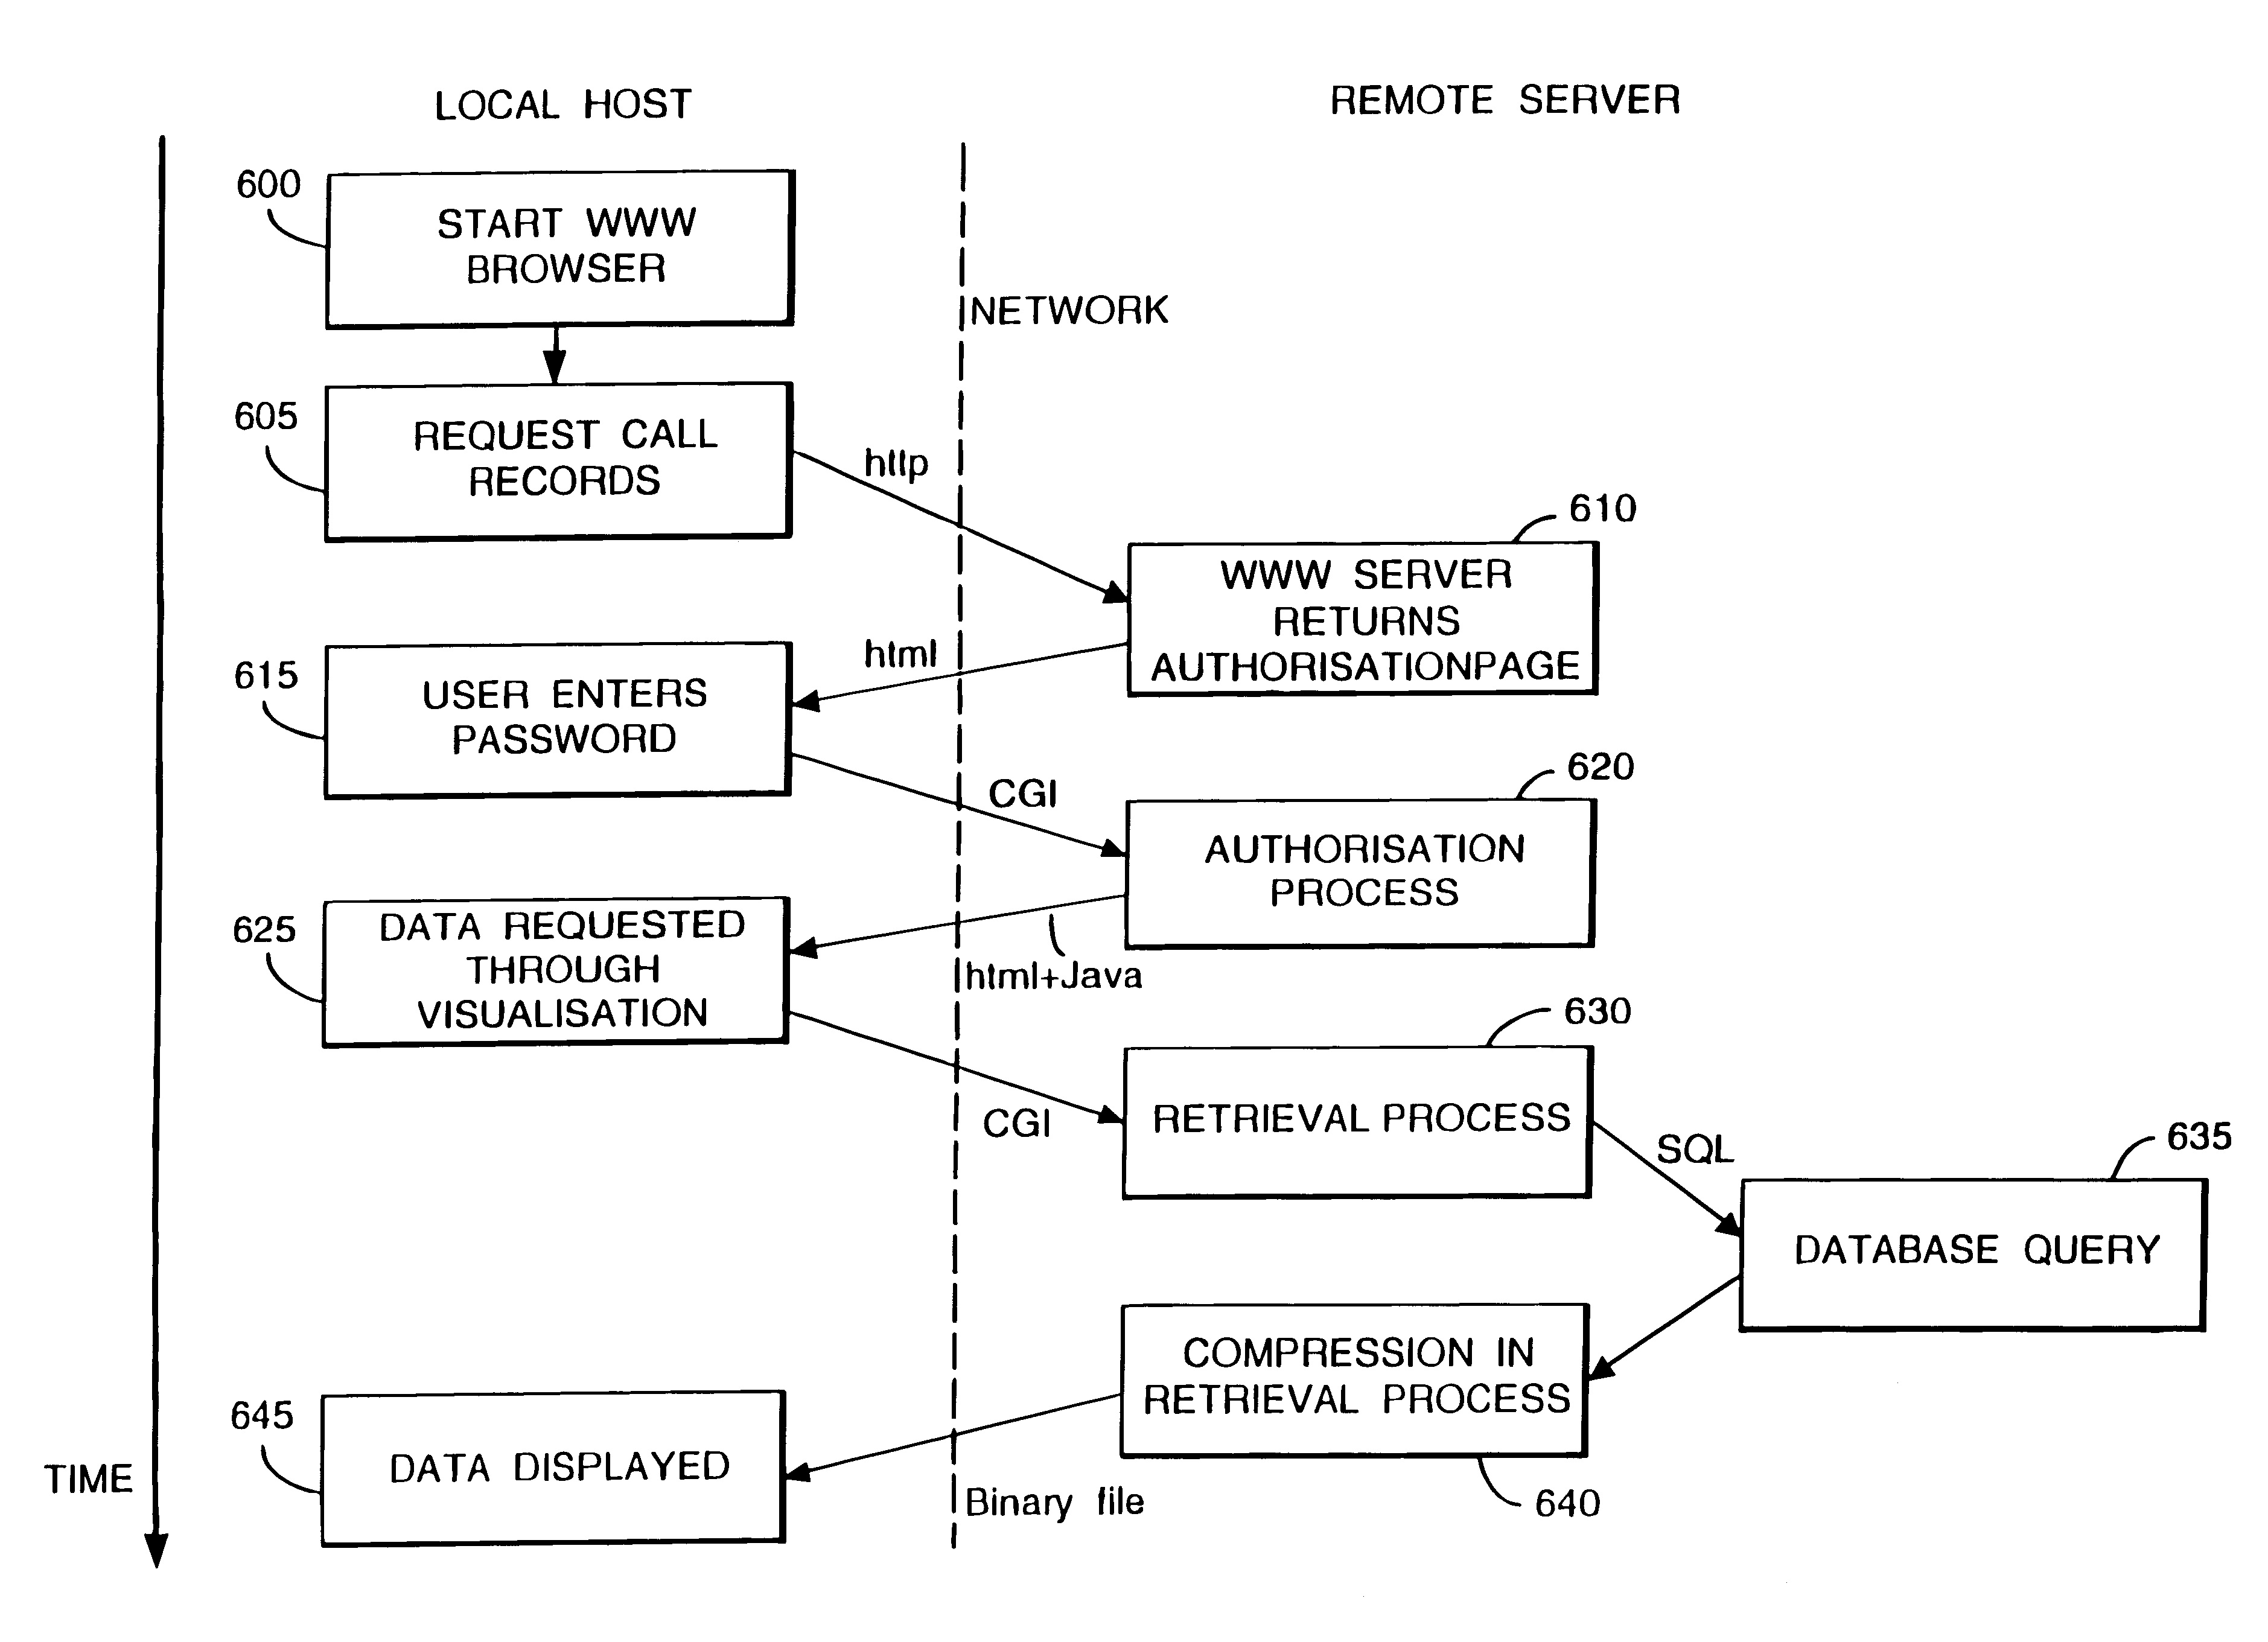
A major problem in moving to geographically diverse data access is the method of delivery. To be of practical use the system should preferably be capable of allowing immediate access to data which is continually being produced. Different methods of data visualisation are appropriate to different data types and so require different software in which to produce them. Although it would be possible for each user to procure and load the necessary software onto their local machines prior to receiving the data, this would involve delay and require a certain level of technical competence on the part of the user.

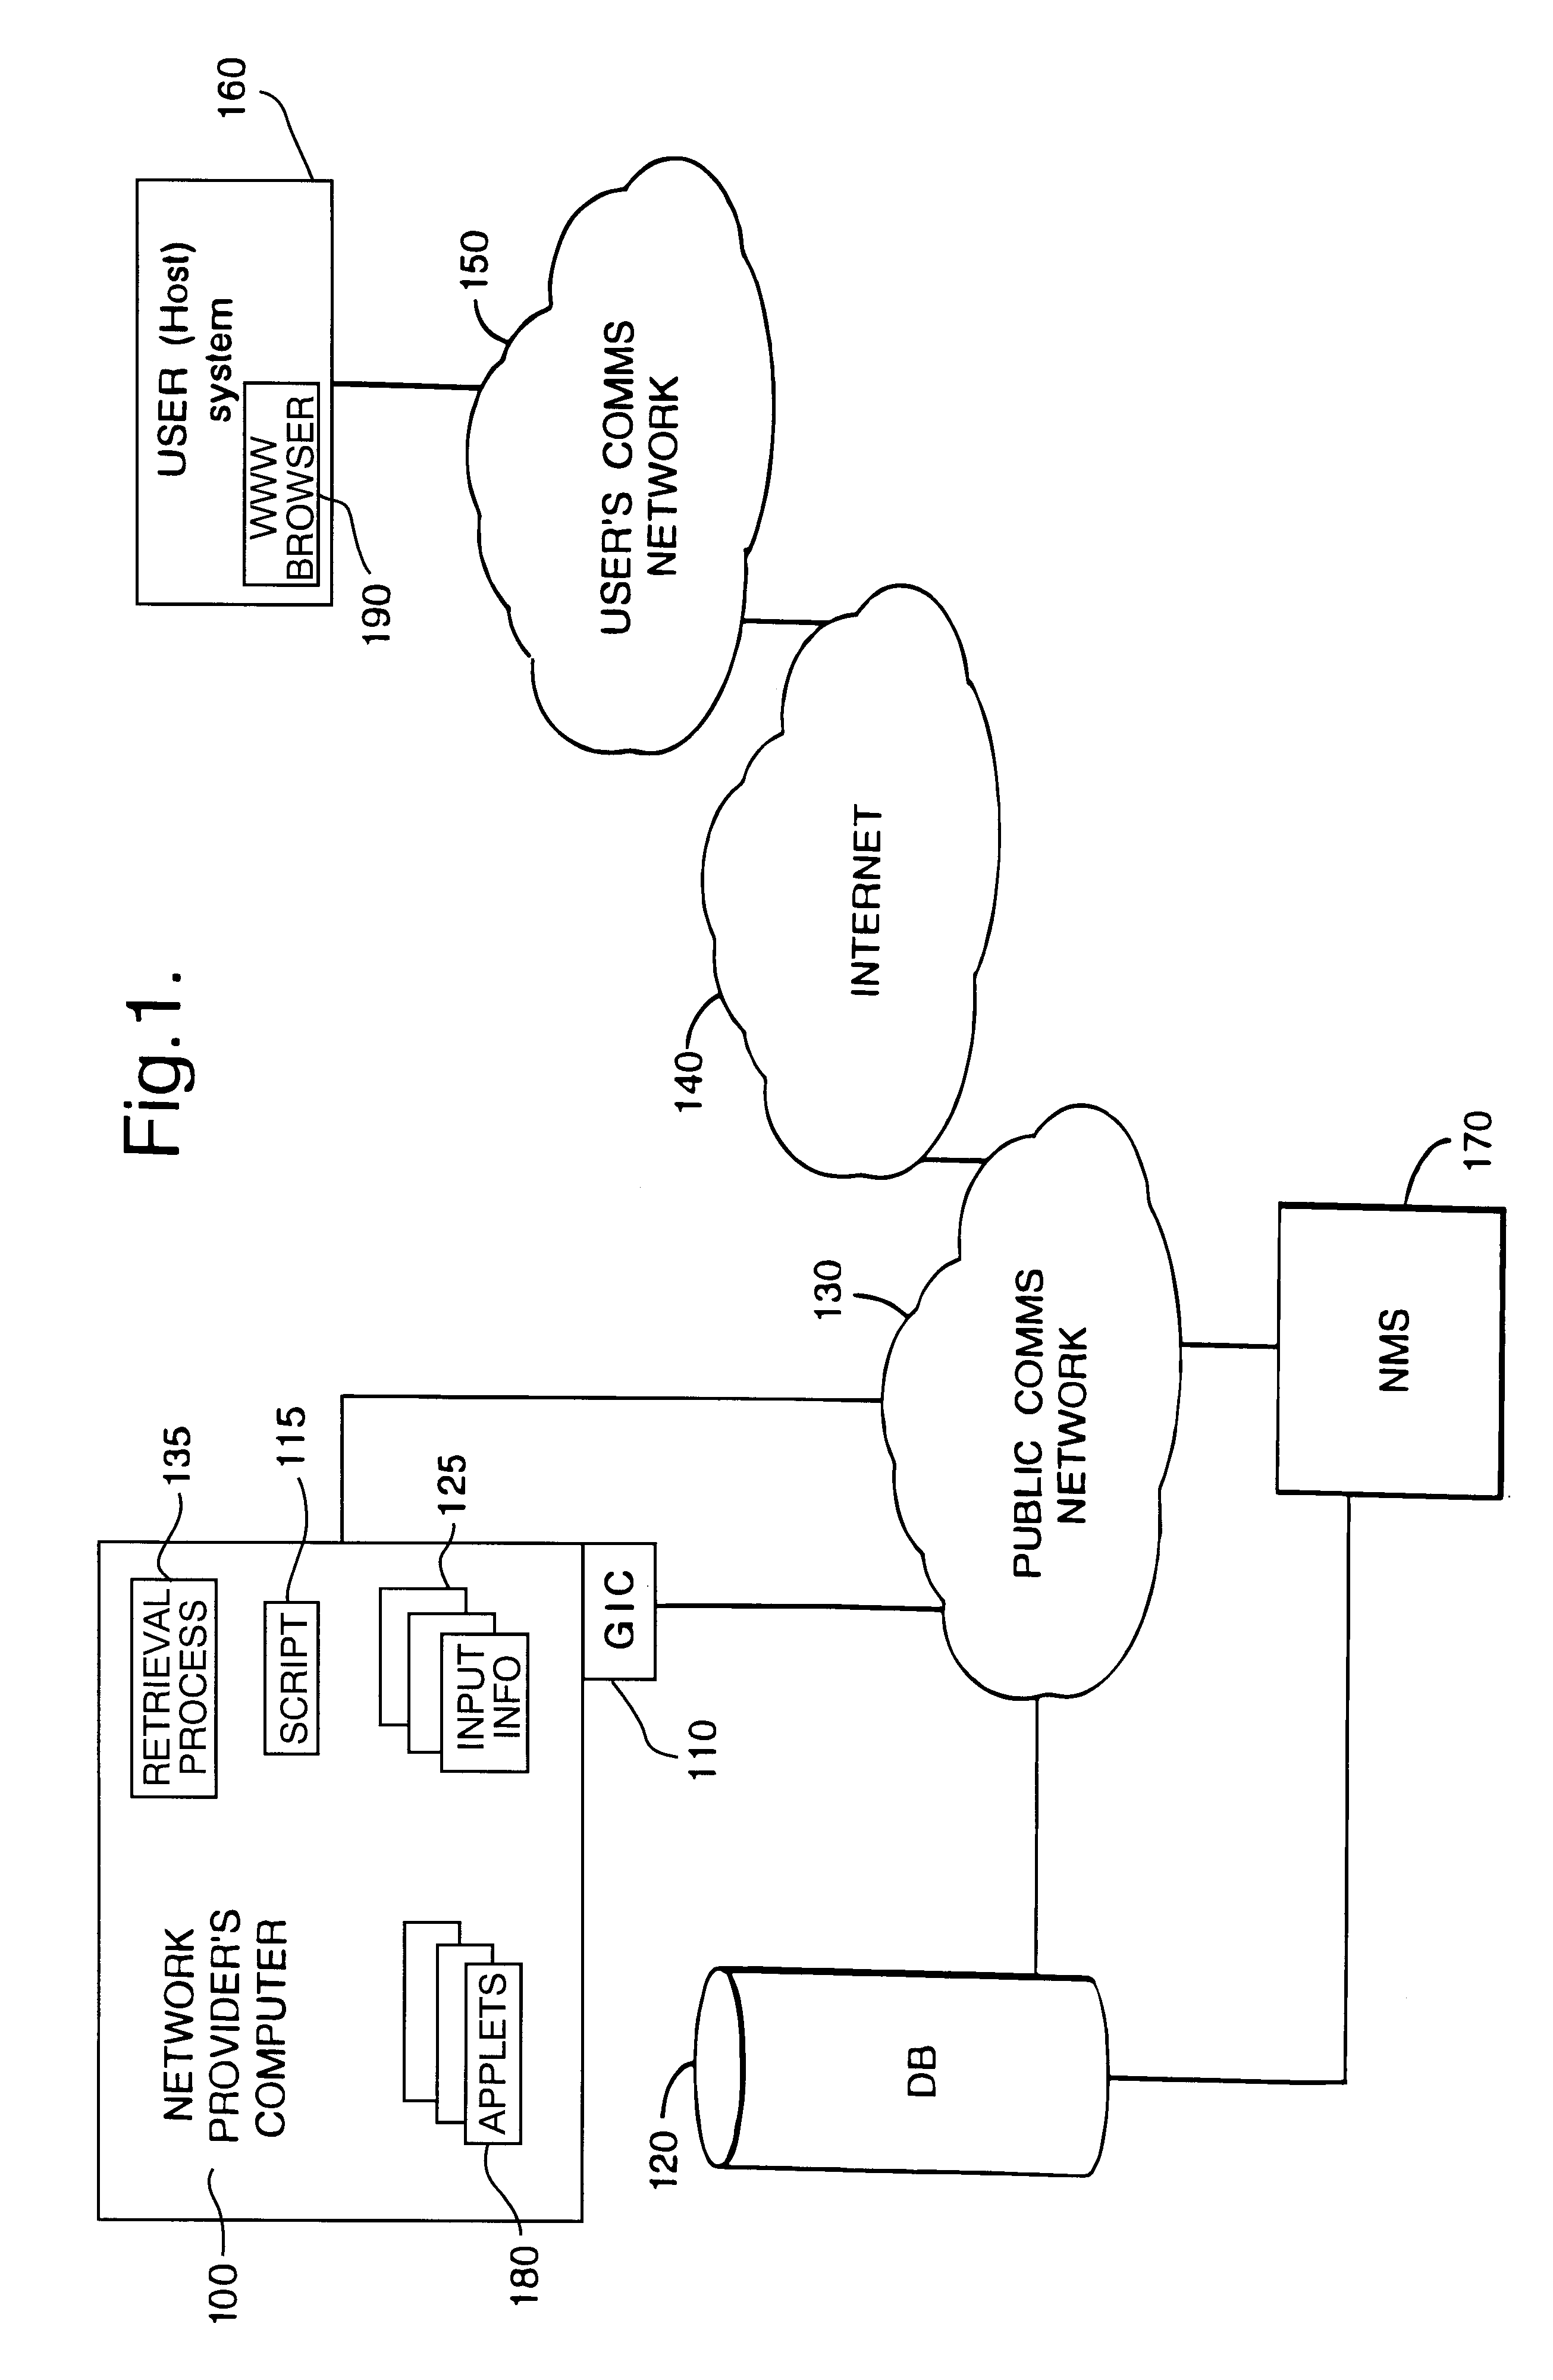
Referring to FIG. 1, the data access and visualisation system provides data to a user's personal computer (PC) 160 by means of one or more (in this case three) communications networks 130,140,150. That is, the user's PC 160 is connected via their own Local Area Network (LAN) 150 in known manner to a data network with high inter-connectivity between different sites, for instance an "i...


PUM


Abstract

A network data visualization system and method are disclosed. In a specific embodiment, a user accesses a web page using a browser. Before returning the web page, the server authenticates the user by returning an authorization page that prompts the user for a password. If the user enters a valid password, the server returns a web page containing data visualization software in the form of one or more applets. The data visualization software running on the user station retrieves network data from a database, processes the retrieved network data for visualization, and displays the network data to the user. The network data may include telephone call records, traffic data, or traffic management statistics. The displayed information may be arranged temporally or spatially. The displayed information may be limited to that of one or more specific telephone numbers. The data visualization software allows the user to monitor events almost in realtime.

Description

1. Field of the InventionThe present invention relates to a system and / or process for remote access to data and visualisation thereof. It finds particular application in data monitoring.2. Related ArtData visualisation techniques are known and clearly useful. There are many scenarios in which a user may have complex and extensive data available to them. The ability to present large data sets in a graphical form which allows a user to gain more understanding of the original data has been the focus of the emerging subject of scientific visualisation for the past few years. In a typical visualisation application, data is represented in the form of a three dimensional graphical object on a computer display screen. The shape and colouring of the object are dictated by the data set from which it was derived. The user has the ability to move and turn the object on the screen and adjust the lighting angles to highlight features in the data set. The use of animation, where the form of the ob...

Claims


Application Information

Patent Timeline
IPC IPC(8): G06F9/46
CPCG06F9/54H04L41/22
Inventor SHARPLES, PETER A.FAUTH, MARCO J.
Owner BRITISH TELECOMM PLC
Why Eureka
Try Eureka