Method and apparatus for predicting response to food
a technology of predicting the response of food and methods, applied in the field of nutrition, can solve the problems of increasing the risk of developing many chronic diseases of aging, and the current therapies appear to not work,
- Summary
- Abstract
- Description
- Claims
- Application Information
AI Technical Summary
Benefits of technology
Problems solved by technology
Method used
Image
Examples
example 1
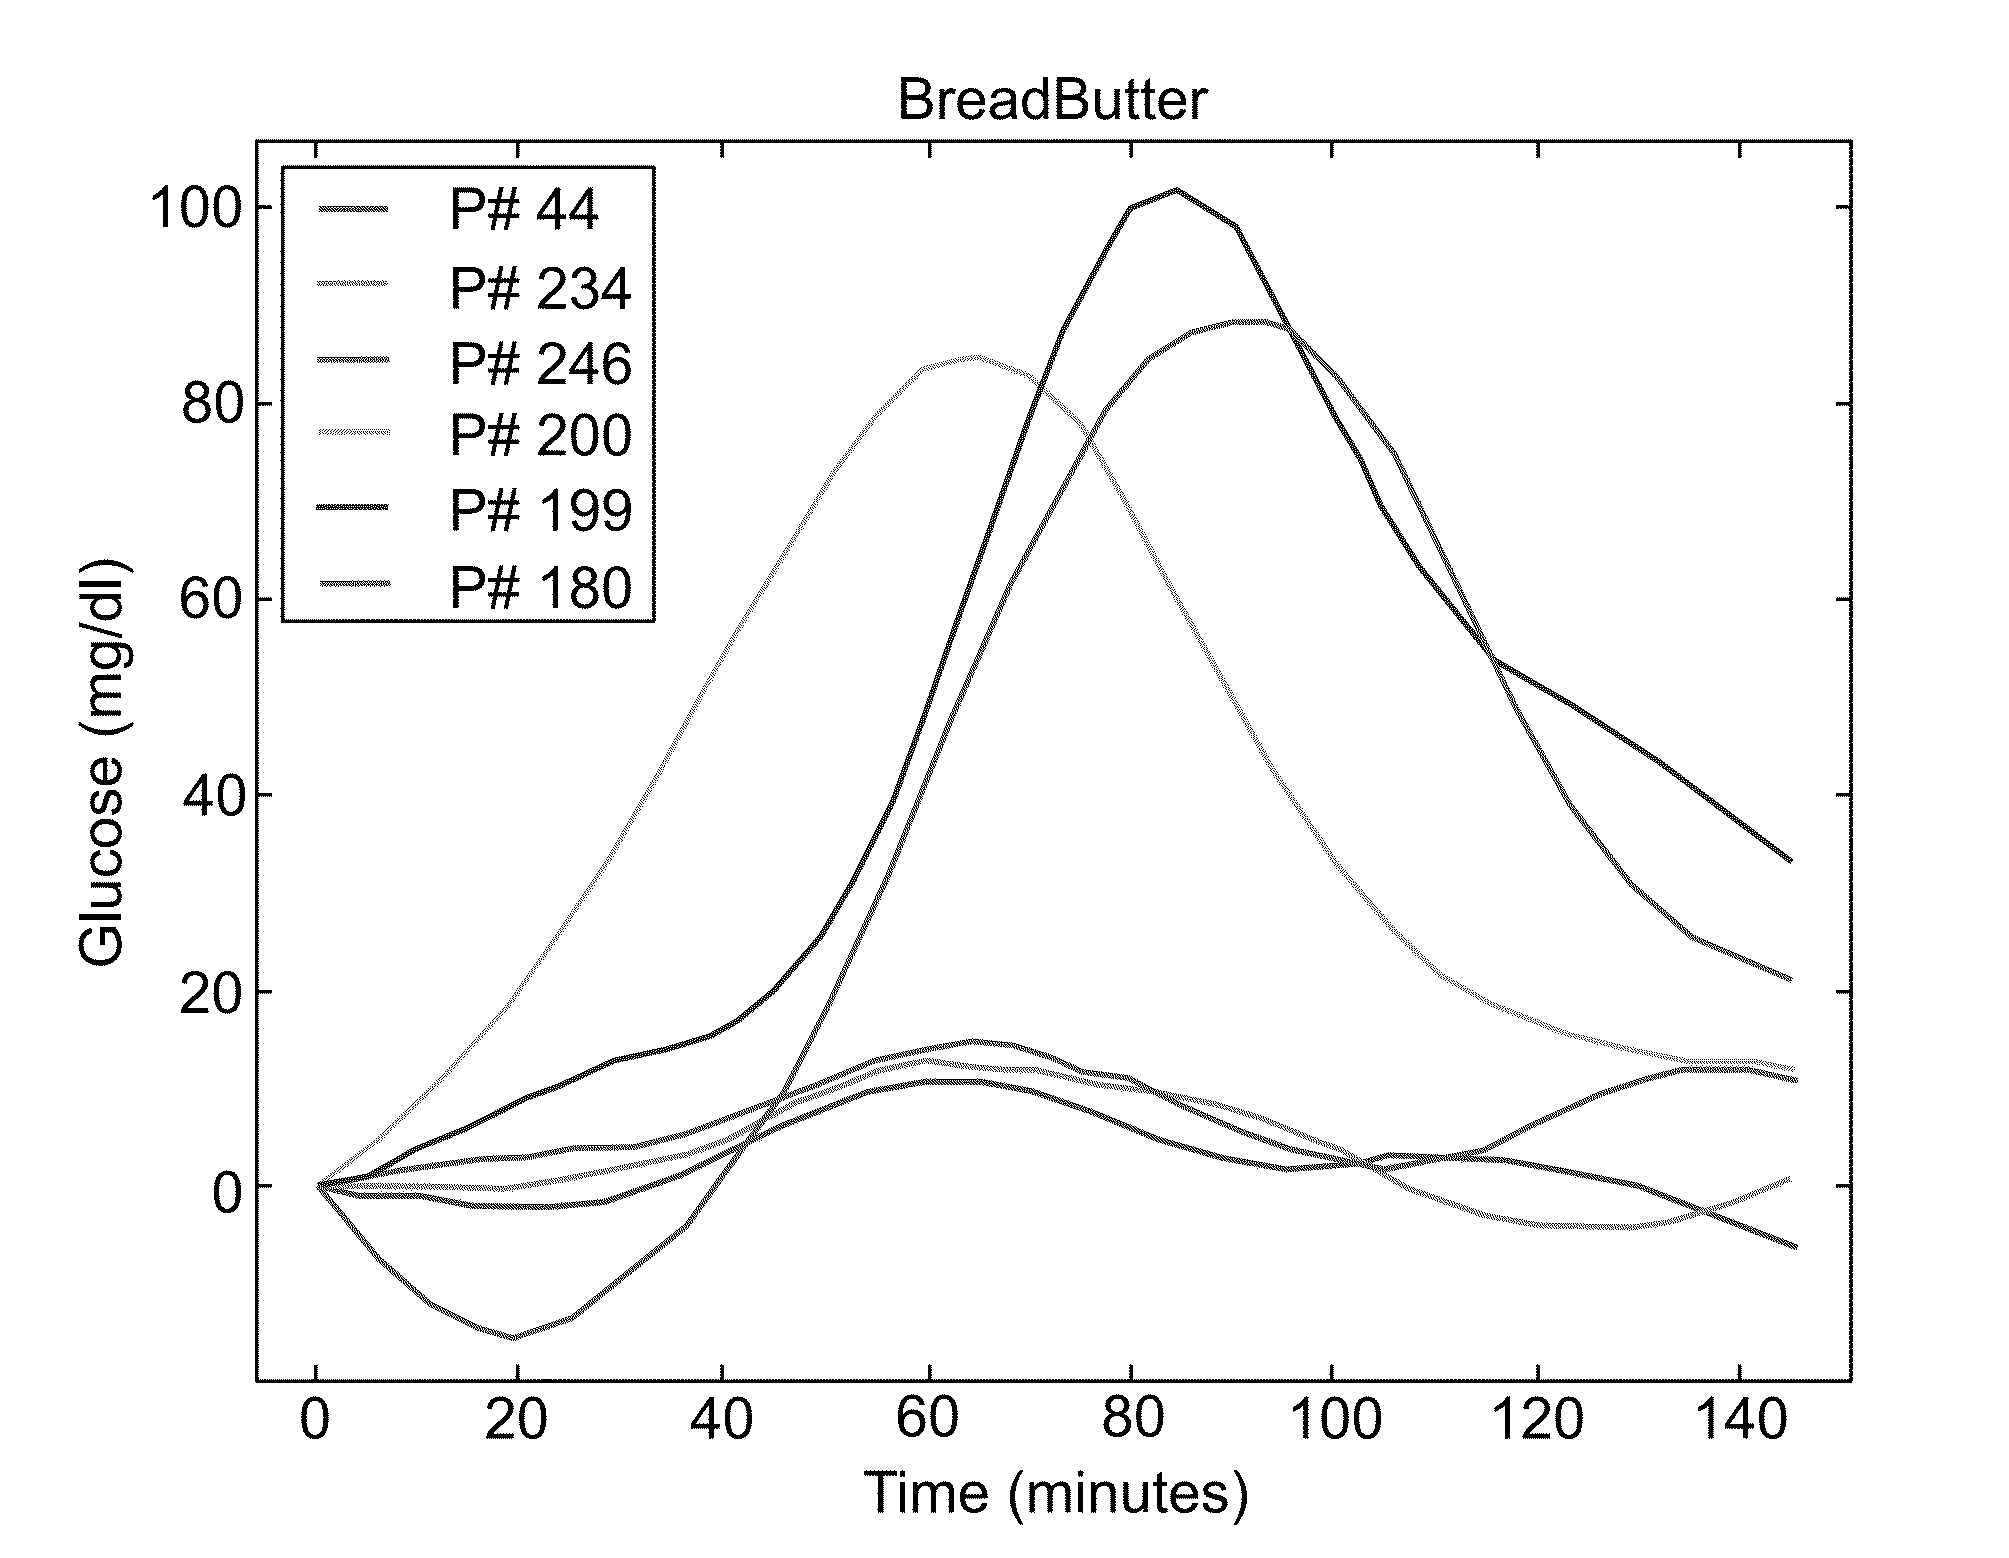
[0230]Blood glucose levels are rapidly elevating in the general population, resulting in a sharp incline in the prevalence of pre-diabetes and impaired glucose tolerance, and eventual development of type II diabetes mellitus. Dietary intake and food composition are considered central determinants of glucose levels and critically involved in glucose homeostasis in normoglycemic and pre-diabetic individuals alike. Indeed, dietary modifications in pre-diabetics can result in full reversal of hyperglycemia and its long-term complications. However, the individualized effects of food intake on the glycemic response remain poorly understood, thus substantially limiting the ability to effectively induce glycemic control through dietary intervention. This major obstacle stems from the substantial and poorly understood individual variability in the glycemic response to foods. A critical, yet poorly studied determinant of this diet-related variability is the composition and function of the int...
example 2
[0264]The data collected in Example 1 above were re-analyzed by stochastic boosting using decision trees. The results are presented in FIGS. 9A-G.
[0265]FIG. 9A shows boxplot of actual measured glucose responses for each of 5 different glucose level predictions. The center line is the median, and top and bottom bars signify the 75 and 25 percentiles, respectively. The overall correlation across all meals (R=0.56) is also indicated.
[0266]FIG. 9B shows all 7072 meals as predicted according to some embodiments of the present invention. Shown is a comparison between the predicted glucose response (abscissa) and the measured response (ordinate). Also shown is the overall correlation (R=0.56) and a line indicating a moving window average (100 consecutive predictions).
[0267]FIG. 9C shows a histogram of the number of participants at different levels of correlation predictions.
[0268]FIGS. 9D-G shows comparisons of the predicted and measured response of two participants from typical prediction...
example 3
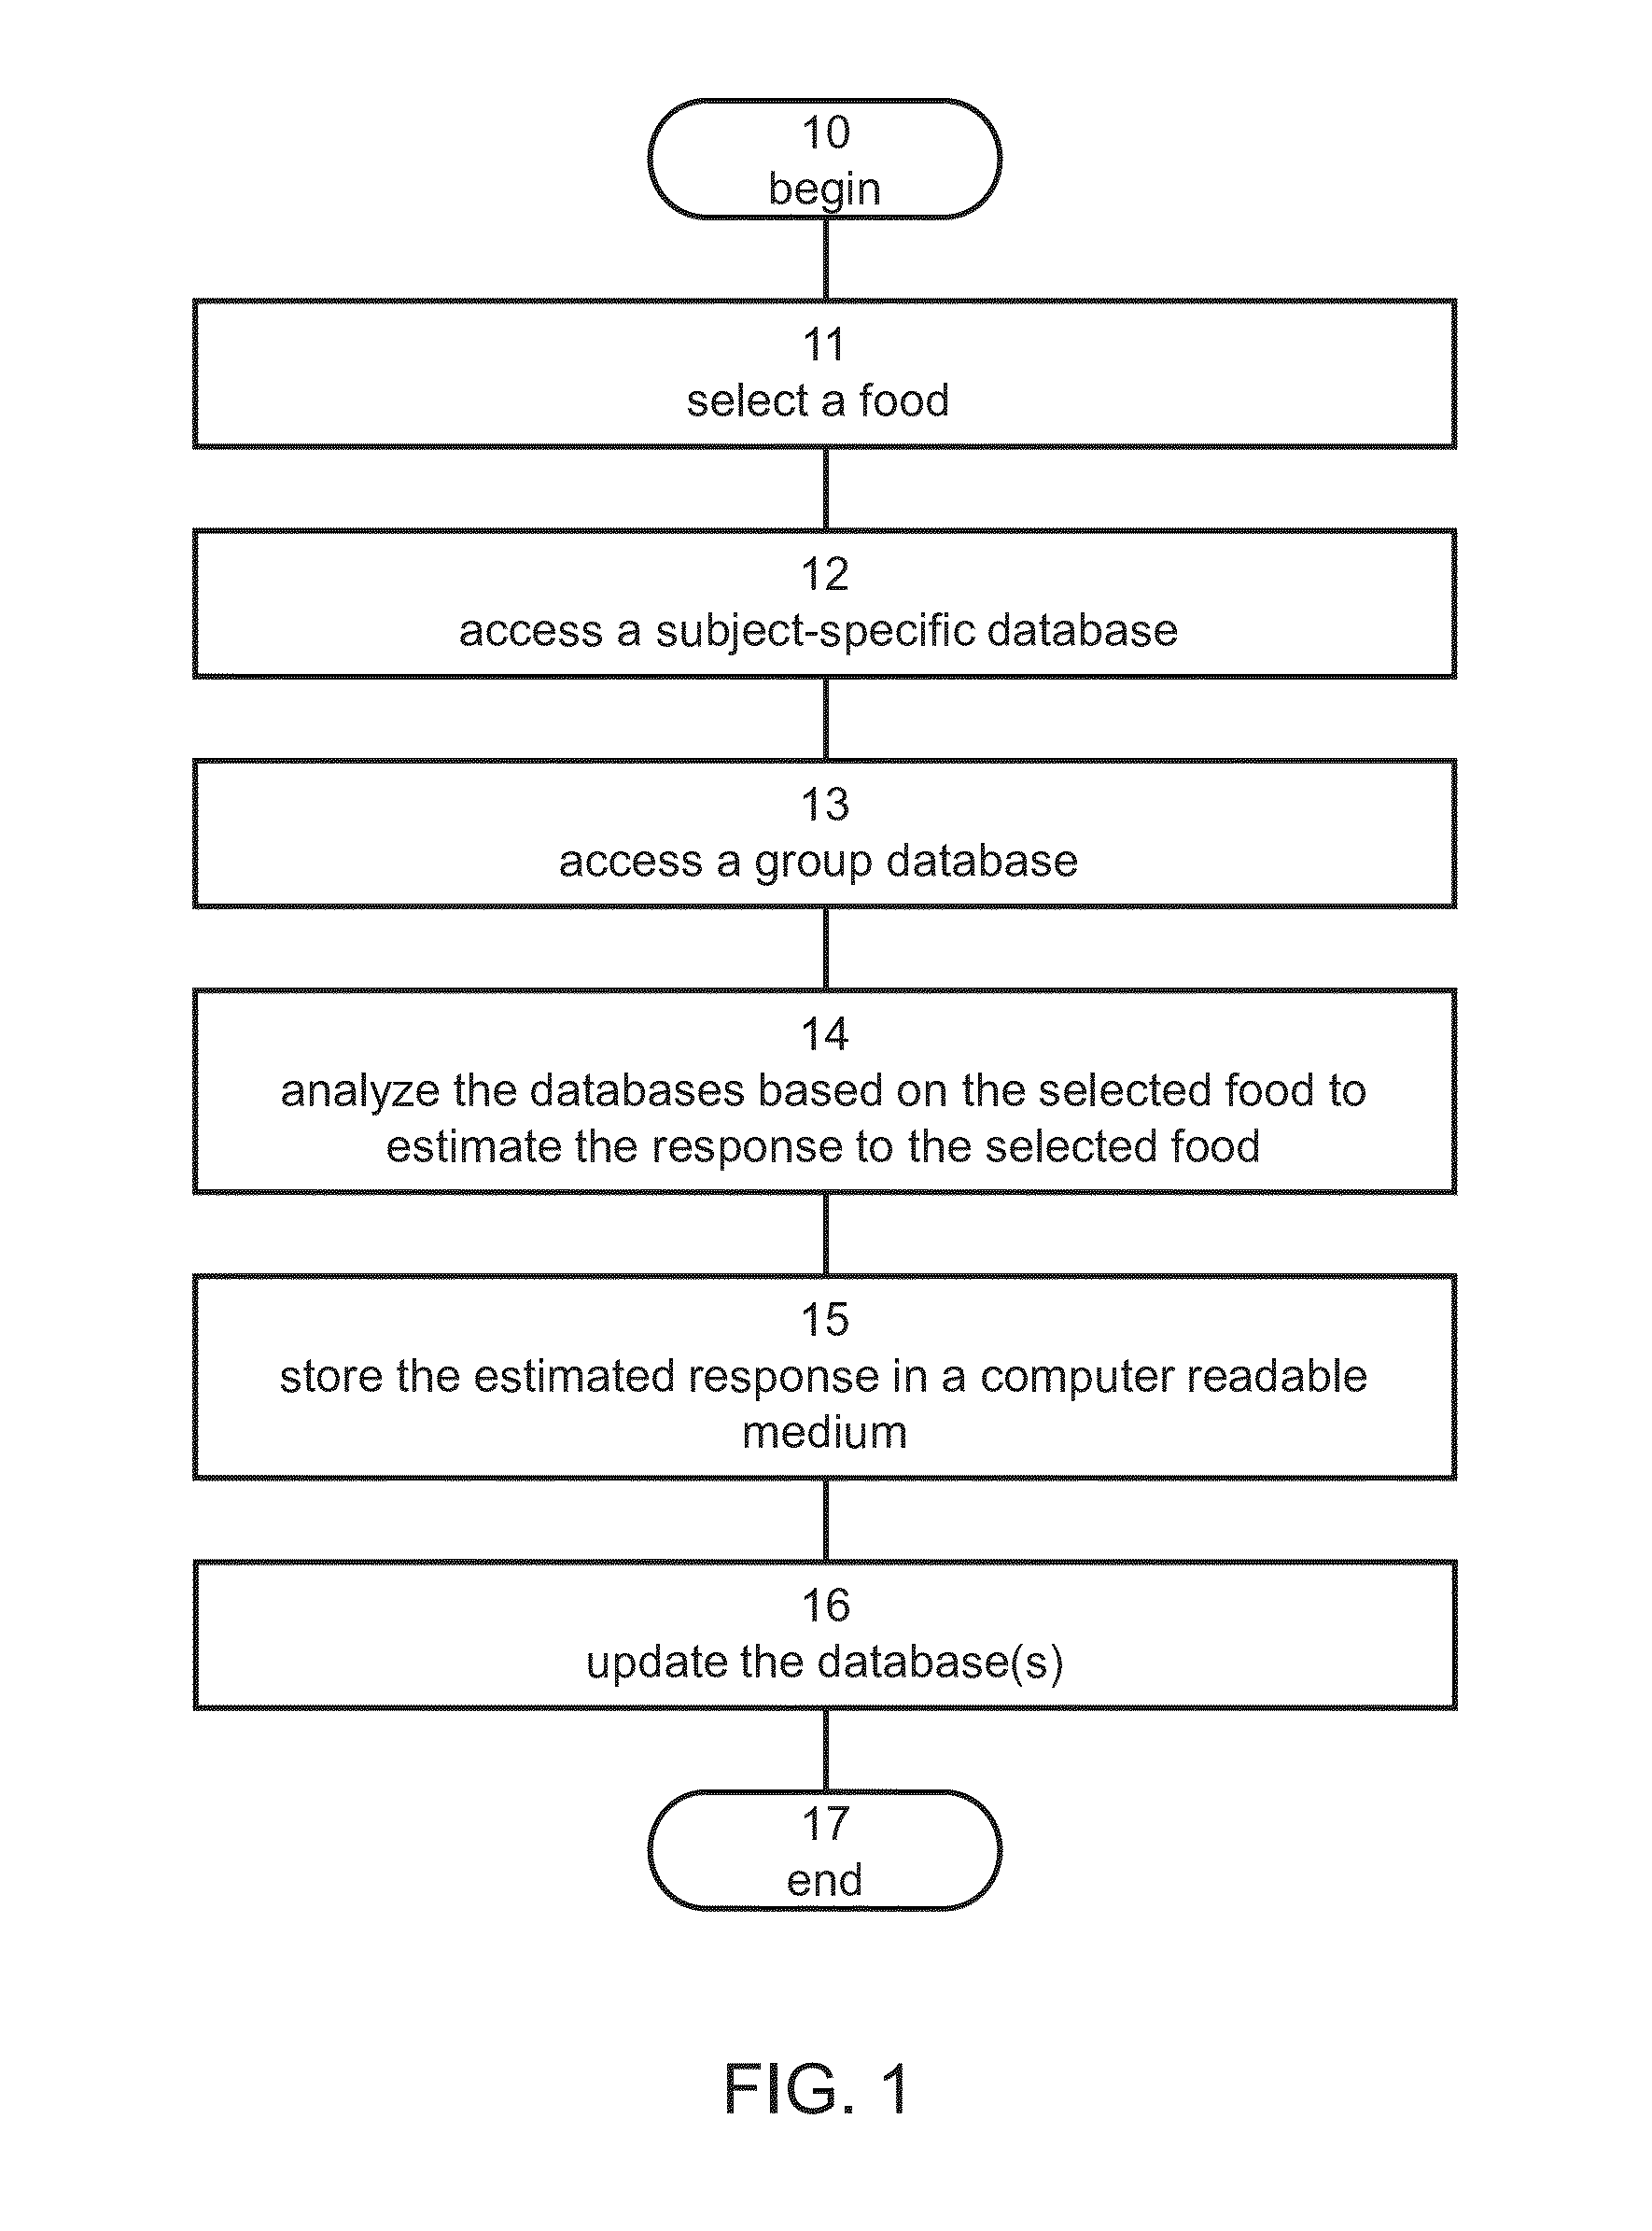
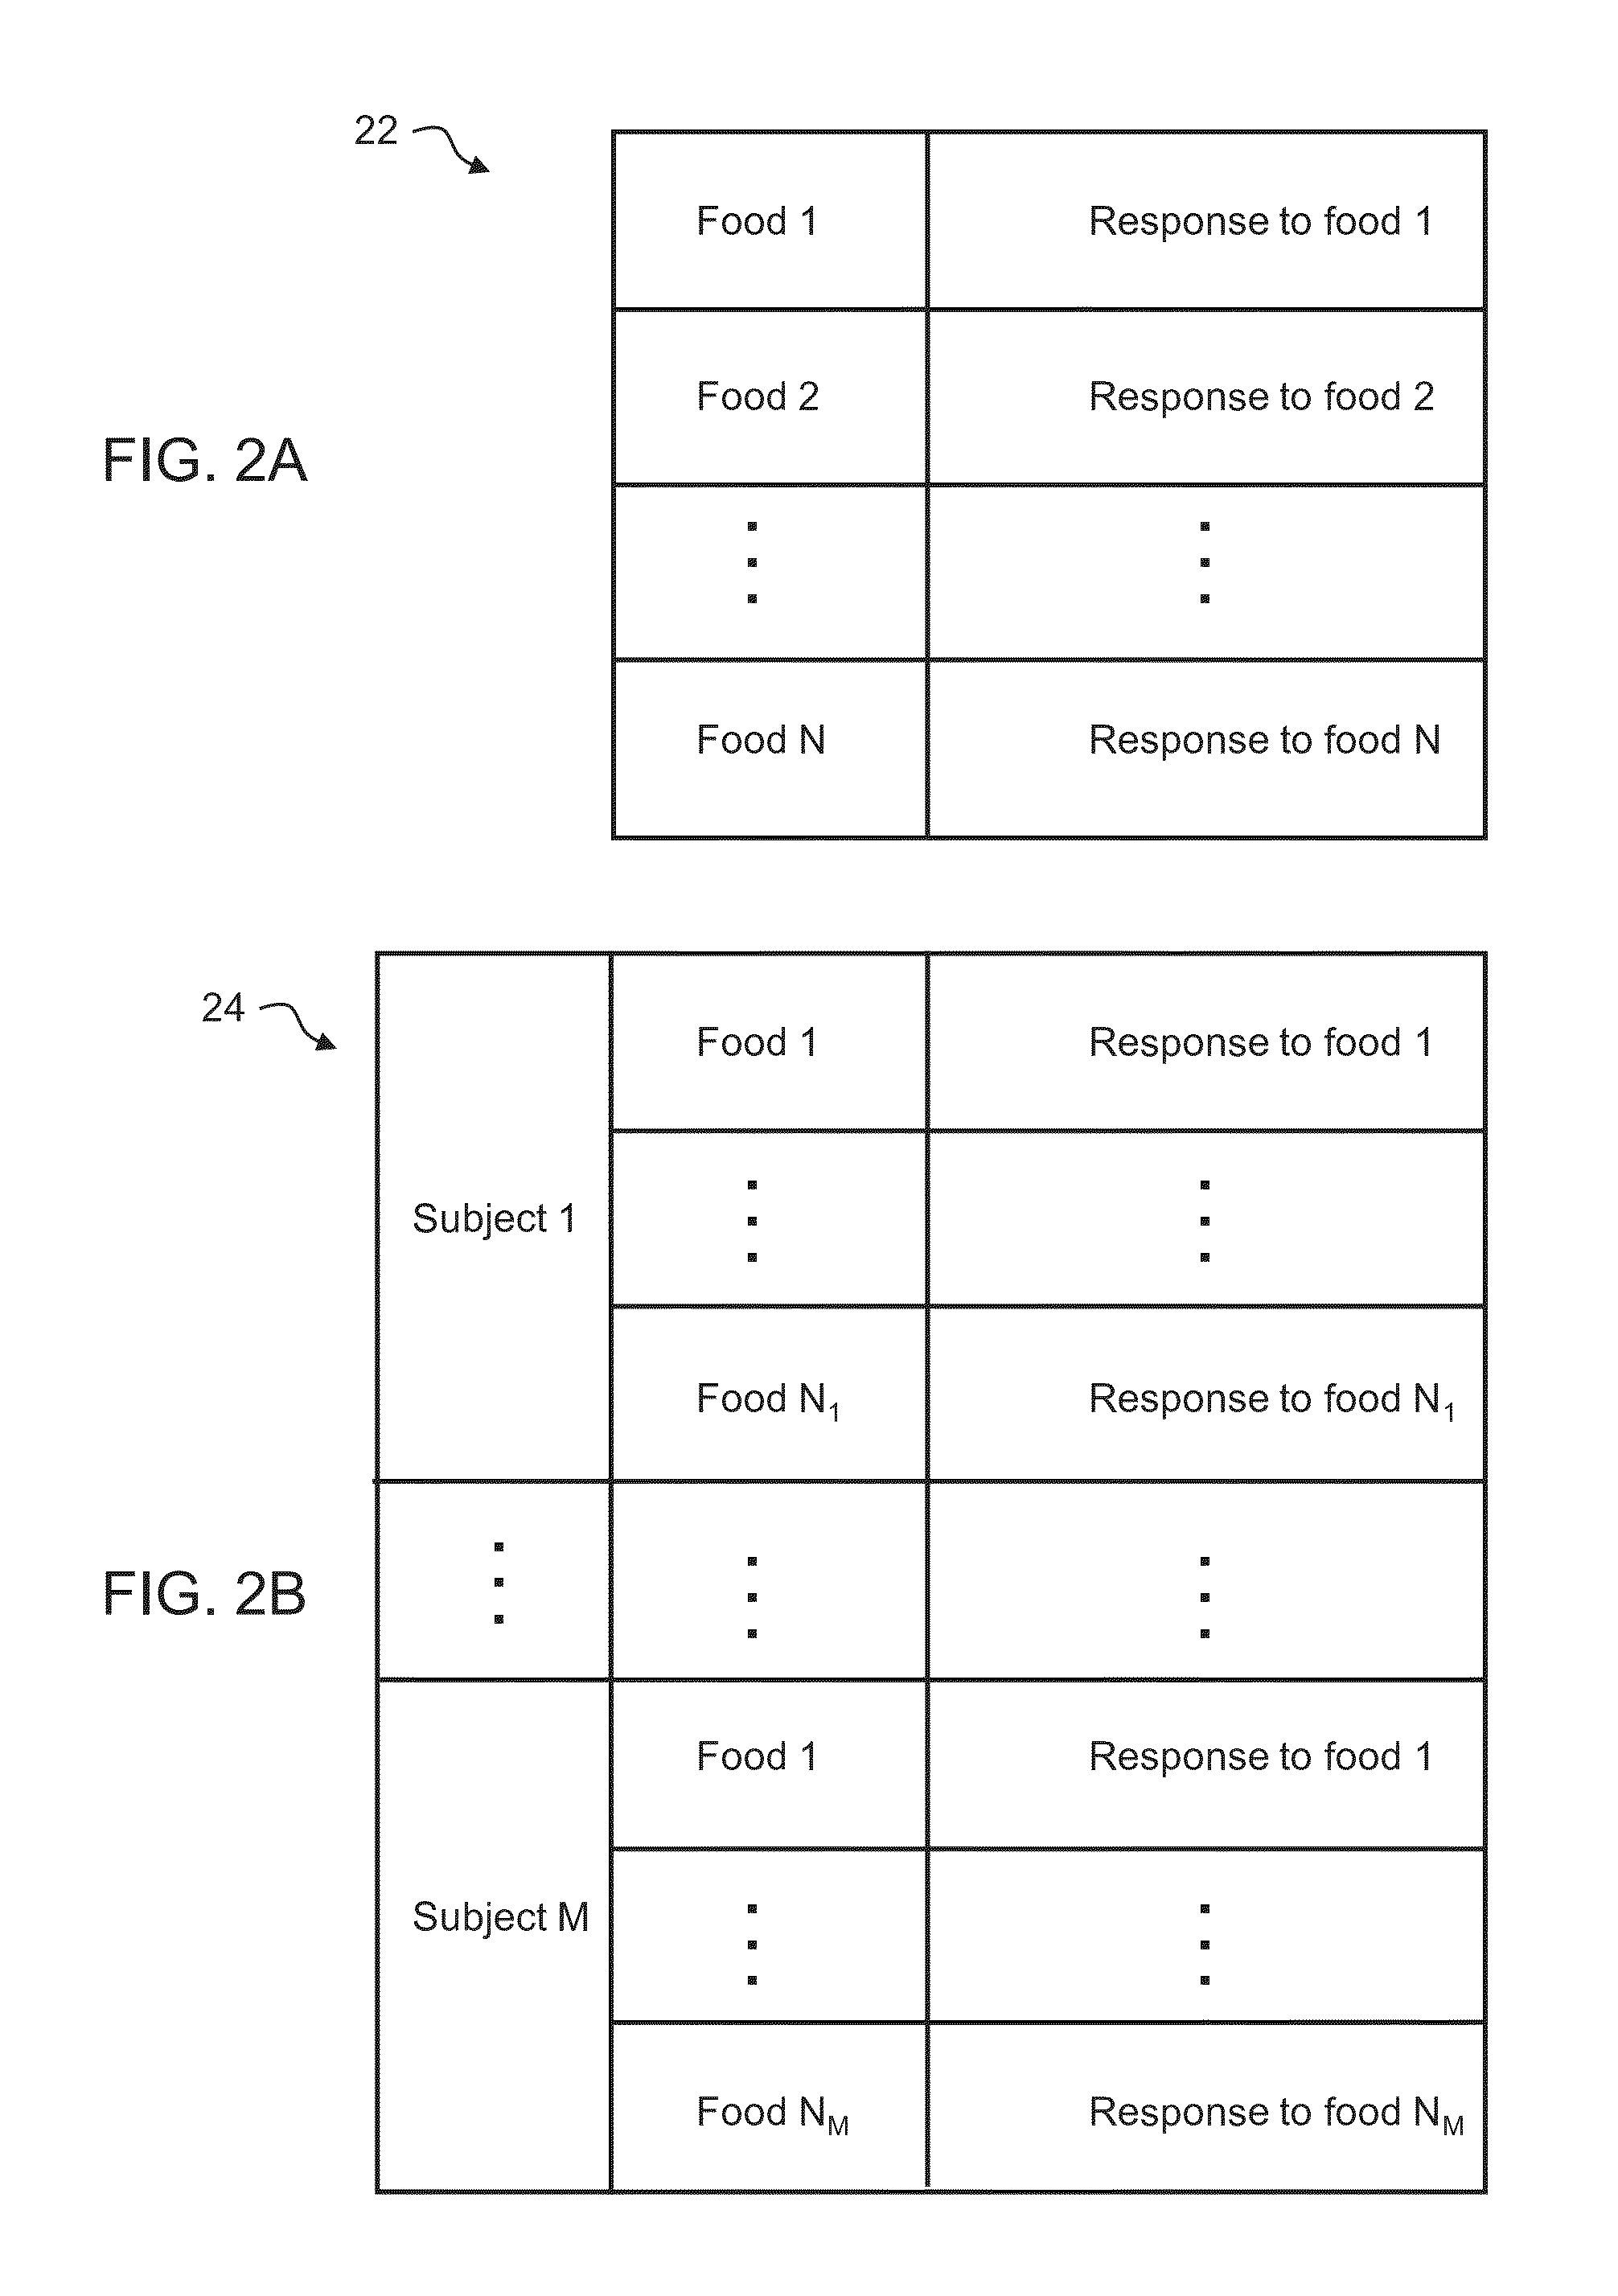
[0269]This example demonstrates the ability of the database according to embodiments described herein to predict a response of a subject to food using a group database that includes responses of other subjects to foods, and a subject-specific database which includes data that describes the subject but does not include any response to any food. The data and the analysis of the collected data at the learning phase were the same as in Example 2. In the prediction phase, the glucose level data of the subject under analysis were removed from the database. The subject-specific database included data describing general lifestyle, health, blood chemistry, and food intake habits including a list of foods which are regularly consumed by the individual together with corresponding intake frequencies. The lifestyle, health and food intake habits were collected by questionnaires.
[0270]FIG. 10A shows boxplot of the measured glucose responses for each of 5 different glucose level predictions. The n...
PUM
 Abstract
Description
Claims
Application Information
 - Generate Ideas
- Intellectual Property
- Life Sciences
- Materials
- Tech Scout
- Unparalleled Data Quality
- Higher Quality Content
- 60% Fewer Hallucinations
Browse by: Latest US Patents, China's latest patents, Technical Efficacy Thesaurus, Application Domain, Technology Topic, Popular Technical Reports.
© 2025 PatSnap. All rights reserved.Legal|Privacy policy|Modern Slavery Act Transparency Statement|Sitemap|About US| Contact US: help@patsnap.com


