System for decomposing events from managed infrastructures with situation room

Active Publication Date: 2017-06-01
MOOGSOFT
1 Cites 1 Cited by

AI-Extracted Technical Summary

Problems solved by technology

Because of the vast amount of information that is available on the web, it can be difficult for a person to locate information that may be of interest.
For example, a person who receives hundreds of electronic mail messages/events from infrastructure a day may find it impractical to take the time to store the messages/events from infrastructure in folders of the appropriate topic.
As a result, it may be difficult for the person to later find and retrieve all messages/events from infrastructure related to the same topic.
Because there may be no effective indexing of these groups, it can be difficult for the person to find groups related to the topic of interest.
Without an automated approach it is impractical to handle the massive amounts of web-based information that are being generated on a daily basis.
Moreover, because a person may not be fully aware of the entire web directory hierarchy or may not fully understand the semantics of information, the person may place the information in a directory that is not the most appropriate, making later retrieval difficult.
The large volume can more than difficult to manage and/or organize for most users.
However, this as well as other existing approaches present several problems.
For example, tasks are not visible to the user, or rather are “out of sight, out of mind”, and thus can be easily, if not frequently, neglected, overlooked, or forgotten.
Hence, the particular message cannot serve multiple activities at once.
Other current systems have attempted to ease these problems; however, they fall short as well for similar reasons.
This largely unnecessarily high volume of network traffic decreases worker productivity and slows down import...

Benefits of technology

[0028]These and other objects of the present invention are achieved in a system for clustering events. At least one engine is configured to receive message data from managed infrastructure that includes managed infrastructure physical hardware which supports the flow and processing of information. The at least one engine is configured to determine common characteristics of events and produce clusters of events relating to the failure of errors in the managed infrastructure. Membership in a cluster indicates a common factor of the events that is a failure or an actionable problem in the ...

Abstract

A system is provided for clustering events. At least one engine is configured to receive message data from managed infrastructure that includes managed infrastructure physical hardware which supports the flow and processing of information. The at least one engine is configured to determine common characteristics of events and produce clusters of events relating to the failure of errors in the managed infrastructure. Membership in a cluster indicates a common factor of the events that is a failure or an actionable problem in the physical hardware managed infrastructure directed to supporting the flow and processing of information. The at least one engine is configured to create one or more situations that is a collection of one or more events or alerts representative of the actionable problem in the managed infrastructure. A situation room includes a collaborative interface (UI) for decomposing events from managed infrastructures. In response to production of the clusters one or more physical changes in a managed infrastructure hardware is made, where the hardware supports the flow and processing of information.

Application Domain

Relational databasesHardware monitoring +3

Technology Topic

Real-time computingPhysical change +1

Image

  • System for decomposing events from managed infrastructures with situation room
  • System for decomposing events from managed infrastructures with situation room
  • System for decomposing events from managed infrastructures with situation room

Examples

  • Experimental program(2)

Example

Example 1
[0100]As a non-limiting example, the NMF algorithm can be executed as follows:
Let Mij by a n×p non-negative matrix, (i.e., with M>0, and k>0 an integer). Non-negative Matrix Factorization (NMF) consists in finding an approximation
X=WH(AB),  (1)
where W, H are n k and k p non-negative matrices, respectively. In practice, the factorization rank r is often chosen such that r<
[0101]The main approach to NMF is to estimate matrices W and H as a local minimum: 1) M=AB
A, B seed randomly tentatively adjusts A, B until the Frobenius distance
∥M−AB∥ is minimized
where
D is a loss function that measures the quality of the approximation. Common loss functions are based on either the Frobenius distance or the Kullback-Leibler divergence. R is an optional regularization function, defined to enforce desirable properties on matrices W and H, such as smoothness or sparsity.

Example

Example 2
[0102]As a non-limiting example, a k-means algorithm is used as follows: Given a set of event vectors (x1, x2, . . . , xn), where each observation is a d-dimensional real vector, k-means clustering aims to partition the n observations into k sets (k≦n) S={S1, S2, . . . , Sk} so as to minimize the within-cluster sum of squares (WCSS):
arg min S ∑ i = 1 k ∑ x j ∈ S i x j - μ i 2
where μi is the mean of points in Si.
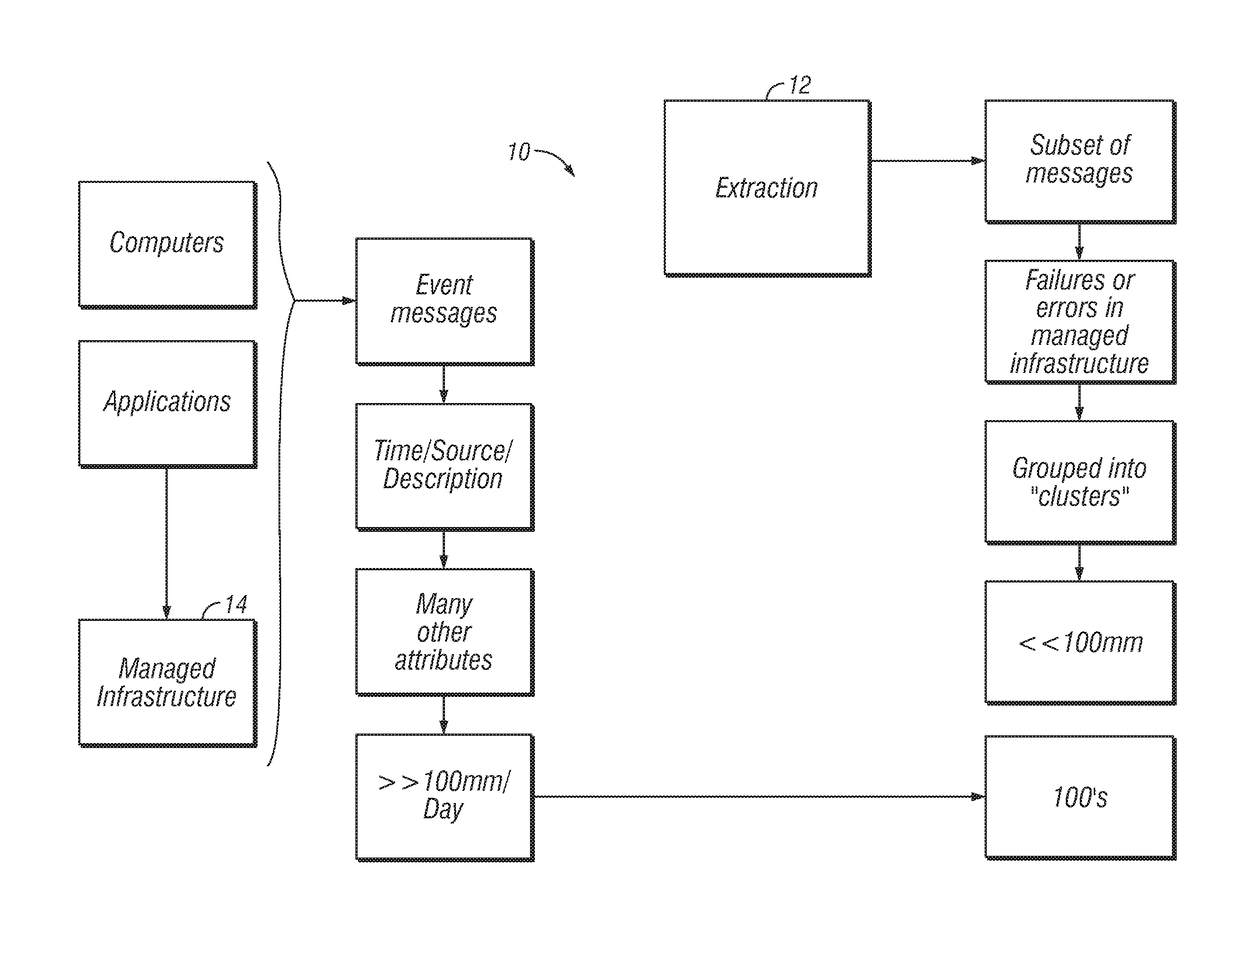
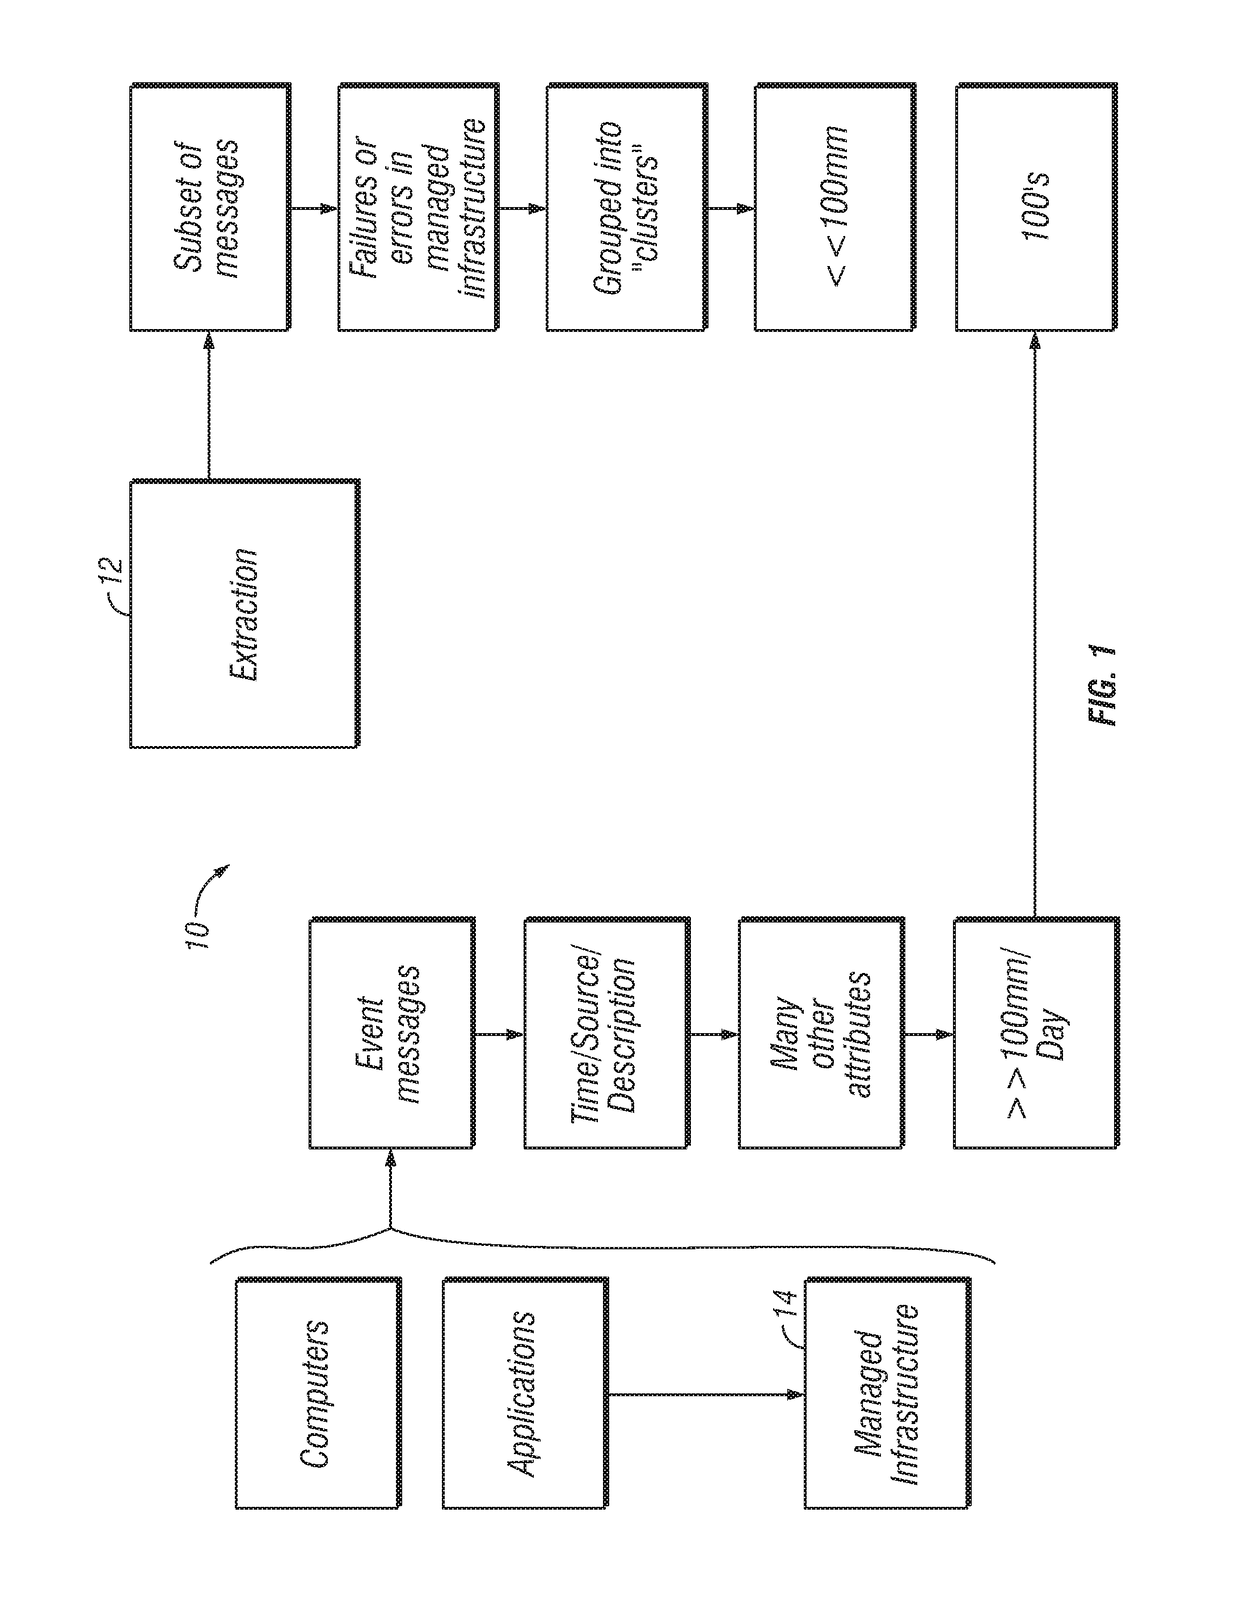
[0103]In one embodiment of the situation room 18, as illustrated in FIG. 1, a system 110 is provided for creating, and displaying in a dashboard directed to the system 10 from clustering messages received from the infrastructure 14, also known as the dashboard system for the situation room 18.
[0104]In one embodiment, the situation room 18 has a display that can be interactive. The situation room 18 can be coupled to or includes a dashboard design system 112, display computer system 114, and a data system 116.
[0105]In one embodiment, the system includes dashboard converter logic 118, data range determination logic 132, dashboard component generator 122, external interface logic 124, graphic library 126, and network interface logic 128. In one embodiment, the system includes data processing computing systems.
[0106]In one embodiment, the dashboard file converter logic 118 converts the situations and alerts from system 10 from clustering messages received from the infrastructure 14 data structures and data, to be compatible with or match with the interface logic 124.
[0107]In one embodiment, the logic 118 provides communication between the graphical dashboard and the problem walls from clustering messages received from the infrastructure 14
[0108]The problem walls from clustering messages received from the infrastructure 14 are provided as disclosed above.
[0109]In one embodiment, the logic 132, dashboard component generator 122 and the external interface logic 124 are each used for designing the problem walls from clustering messages received from the infrastructure 14.
[0110]A dashboard or SWF file can be included that establishes a data range, type of components and the external interface. In one embodiment, the logic 132 is used for a data range in a spreadsheet associated with the dashboard file used to generate a visual display.
[0111]In one embodiment, a dashboard component generator 122 is provided that allows a user to place problem walls from clustering messages received from the infrastructure 14 components with various attributes onto a canvas. The canvas can be a space where various visual components are.
[0112]In one embodiment, the user is able to choose components directed to problem walls from clustering messages received from infrastructure 14 elements from a different components. These can be included in a panel and the user can then place them on the canvas in any way that the user desires.
[0113]In one embodiment, the components are provided by the client, by the system, by third parties, and from third parties. Examples of other components include but are not limited to, graphs, style of presentation, additional information, comparisons, trends, artistic elements, text, and the like. In some embodiments, the user, or client can select the background, margins, presentation of elements and the like.
[0114]In one embodiment, an external interface logic 124 is provided. The interface logic allows a dashboard to provide data ranges, permutations, trends, activities, and the like associated with problem walls from clustering messages received from the infrastructure 14. In one embodiment, interface logic 124 allows the business application software to export application data to be displayed in a dashboard in an interactive visual format.
[0115]In various embodiments, a network interface logic 128 and 130 allows for connectivity of the dashboard design system 112, display computer system 114 and data system 116 to each other, or to public networks. In one embodiment, a graphical file that has been configured by the computer system 112 is stored in the data storage system 136. In one embodiment, the graphic file is used for data mapping, both during and after design time, and can generate the display during a period of execution. The external adapter can be utilized for communication between the data storage system 136 and the graphical file.
[0116]In one embodiment, network interface logics 128 and 130 allow computer systems 112, 114 and 116 to connect to each other and the other computer systems. As a non-limiting example, the network interface logic 128 and 130 can be one or more computers or web servers that provide a graphical user interface for clients or third parties that access the subsystems of system 112, 114 or 116 through the internet or an intranet protocol. The network interface logic 128, and 130 can include other logics configured to provide interfaces for other types of devices, including but not limited to mobile devices, server-based computing systems, and the like.
[0117]As a non-limiting example, in one embodiment, the display computer system 114 includes, network interface logic 130, context viewer system 138, data storage system 136 and dashboard display system 140.
[0118]In another embodiment, the dashboard display system 140 is included in the context viewer system 138, and be executed in a machine, one or more display and other computers, with machine-readable storage media, cache, memory, flash drive or internal or external hard drive or in a cloud computing environment, non-transitory computer readable media or non-transmissible computer-readable media, with stored instructions executed by the machine to perform the operations. In one embodiment, the context viewer system 138 is a program product that performs various processing functions. As non-limiting examples, these functions can include, receiving data from the data source, preparing data by aggregating, providing access to visualization capabilities, and the like.
[0119]In one embodiment, the data storage system 136 stores data related to problem walls from clustering messages received from the infrastructure 14 applications executed on the display computer system 114.
[0120]In one embodiment, the data storage system 136 stores problem walls from clustering messages received from the infrastructure 14 data or statistical data. As a non-limiting example, the dashboard display system 140 communicates with the display computer system 114 to display problem walls from clustering messages received from infrastructure 14 data in a dashboard in a visual manner or in visual components using graphics. Displaying problem walls from clustering messages received from infrastructure 14 data graphically may include displaying bar graphs and/or pie charts or other visual displays. In order to generate the dashboard display, the client can map dashboard data fields to the problem walls from clustering messages received from infrastructure 14 data fields. This allows access of data from problem walls from clustering messages received from infrastructure 14 without data replication.
[0121]Embodiments of the data storage system 136 may store a variety of information including application data in database 130. The application data database 130 may receive data from the data system 116. The data storage system 136 may provide data to the context viewer system 138. More specifically, the data storage system 136 may provide data to the data aggregation logic 142. The data storage system 136 may receive appropriate data mapping instructions from the data mapping logic 144 and query the data system 116 to correlate the data from one mapped field in the dashboard tool to the mapped fields in the application data 146.
[0122]Embodiments of the dashboard display system 140 may be provided on the display computer system 114. In an example embodiment, the dashboard display system 140 may transfer data from various data sources or data from various applications to external data ranges of the graphic file and display the graphical interface during runtime operations. The dashboard display system 140 may include all of the features discussed above with regard to the dashboard design system 112. Also, the dashboard display system 140 also includes a dashboard execution logic 148 and external interface logic 150. The external interface logic 150 may have similar features as the external interface logic 124 of the dashboard design system 112. The external interface logic 150 may expose selected data ranges of the dashboard to the business software data. The external interface logic 150 may allow the business application software to export application data to be displayed in the dashboard in a visual format instead of a textual format. During runtime when displaying the dashboard in the business application, the dashboard execution logic 148 is configured to receive the data from the business application and generate a Flash Island interactive display as designed by the dashboard design system 112 or dashboard display system 140.
[0123]The data system 116 includes an application logic 152 and application data 146. The data system 116 may be configured to provide data and communicate with the display computer system 114. The application logic 152 is the server side of the application that provides back end information to the context viewer system 138. For example, the application logic 152 may comprise an Enterprise Resource Planning (ERP), Customer Relation Management (CRM) or Business Intelligence (BI) system. Business intelligence may refer to computer-based techniques used to analyze business data, such as sales revenue by products and/or departments or associated costs and incomes. The application data 146 may include relational or other types of databases. The application data 146 includes various fields that may be mapped to the fields exposed by the external dashboard interface.
[0124]FIG. 13 is an example process that may be implemented using the system shown in FIG. 12. Initially, at step 154, in an example embodiment a dashboard design user may build a dashboard using a dashboard building software. The dashboard design user may configure the dashboard during design time. In an example embodiment, design time may include the design user configuring the dashboard layout and exposing a related data range. The dashboard design system 112 may be used to create a dashboard layout. Building the dashboard includes placing components on the canvas and configuring the properties associated with those components. As discussed above, the components may be among other components, a chart or graph. At step 156, the dashboard design user may determine and specify using a graphical user interface the data ranges for the dashboard. After creating the dashboard, at step 158, the dashboard may be exported automatically or by input from the dashboard design user to a SWF file format. Steps 154, 156 and 158 may be performed by the dashboard design user using the dashboard configuration system 112.
[0125]A business user may perform the other steps of FIG. 13 by using the display computer system 114. In an example embodiment, the business user's steps may be performed during runtime. In this embodiment, runtime includes displaying of the dashboard in a business application using data from business application data sources. In another embodiment, the business user may perform the steps described above with regard to the dashboard design user. At step 160, the business user may open the context viewer system where the business user may select a chart view 198 as shown in FIG. 17. In the chart view tab, the business user may assign the dashboard or SWF® file to a query view by specifying the location of the file. At step 162, the dashboard data ranges that were determined at step 156 may be mapped to query view fields. In an example embodiment, the data from the data source 136 (or 116) is placed in the mapped location in the dashboard. In another example embodiment, the mapping between application data and graphical interface data may identify which application data may be shown in the reserved placeholder of the dashboard. After mapping the data ranges, at step 164 the dashboard may be displayed in the business application. In one embodiment the business application may be software applications that provide various functionalities such as, customer relationship management, enterprise resource management, product lifecycle management, supply chain management and supplier relationship management. In another embodiment, the dashboard may be configured to receive data from the data system 116 after the mapping has occurred or the data may be accessed during runtime.
[0126]FIG. 14 is an example software architecture that may be implemented using the system in FIG. 12. The software architecture diagram shown in FIG. 14, shows various software layers, such as, graphic player 166, component Dynamic HTML or Java® Script 168, and Server (Java® or Java® based or other high level programming language based) 170 layers. In particular, the generic adapter 172 may be built with the Flash Island library, which may facilitate the client-side communication between HTML and JavaScript® The Dynamic HTML 168 may load the generated dashboard in a graphic file, or Flash/SWF representation. The generic adapter 172 may convert the Java® context into structures that match the dashboard's external interface format or the dashboard format. The generic adapter 172 allows the business user to generate a dashboard in a business analytic software using the most updated data from a data source without writing any customized software. The generic adapter 172 may load dashboard data ranges and convert the associated data into an XML® string that may be used for further conversion into an ABAP® string, which may be used by the business analytic software.
[0127]In another embodiment, the generic adapter 172 may convert the Flash Island properties into dashboard structures. In an example embodiment, the generic adapter 172 may be used to load external dashboard ranges during the configuration stage, at step 162. In this embodiment, the generic adapter 172 may push application data to the data ranges defined in step 162. In another embodiment, the generic adapter 172 may provide an application programming interface between the graphic player 166 and the server 170. The generic adapter 172 may load dashboard ranges automatically and the dashboard data ranges may be converted into XML strings. The XML string may be converted into Java® or ABAP® code which may be executed by the business application 174, to display a dashboard. The server 170 may include NetWeaver®, ABAP® or Java® language programming and the server may include various systems that are supported in the business software suit, the runtime 382, application 174, database 176 and business intelligence application 178. In another embodiment, the functionality of the server 170 may be implemented by the display computing system 114. In yet another embodiment the functionality of server 170 may be divided between the display computing system 114 and data system 116. In another embodiment, the graphic player 166 may be implemented on the dashboard design system 112. Additionally or alternatively, the functionality of the graphic player 166 may be implemented on the display computing system 114.
[0128]FIG. 15 shows a screen display 180 of the dashboard designer that may be used to design a dashboard display according to the system shown in FIG. 12. The dashboard designer may be executed by the dashboard design system 112. The dashboard may be created on the canvas 182. A dashboard design user may place the components from the component panel on the canvas 182. As shown in FIG. 15, the canvas 182 has a bar graph 184 and a pie chart 186 that are displayed in this example dashboard. The dashboard 180 shown in FIG. 15 is using example data from the spreadsheet shown at the bottom of FIG. 15. For example, the labels of the bar graph “Incorrect labeling”, “Wrong component” and “Material defects” are from the spreadsheet shown below. In particular, the cell range from B4 to D5440 was selected as input into the properties of the bar graph and the pie chart. Next, the data in the bar graph and the pie chart is received from cell range B5 to D5. In order to generate this dashboard the dashboard design user may associate various data fields with particular component properties.
[0129]FIG. 16 is a screen display of the dashboard external interface that can permit another software program to access the dashboard controls and display. The external interface connection 188 may allow data from the application system to be passed to a cell range of the dashboard or SWF file, using push technology. During the execution of the dashboard or runtime, data may be pushed or sent from the data source, based on the mapping, to the dashboard. In this embodiment, the data may be transferred in tabular form across an interface. In another embodiment the external interface connection 188 may allow the use of pull technology, where the data is pulled by the context viewer system 138. In another embodiment, during the configuration of the dashboard when the “Generate XC Fields” button is clicked, the defined data ranges will be pulled to the system 150, for example in FIG. 16. The external interface connection 188 may be configured using a definition tab 190, range name 192, range type, range 194 and access type properties. External interface connections allow a dashboard design user to expose selected data ranges relating to the dashboard display. The range name 192 in FIG. 16 is shown as Labels and the range 194 being assigned, “Table 1!$B$4:$D$4” which is the cell range from B4 to D4. In this example embodiment, the labels from B4 to D4 will be used for mapping the Labels field. After specifying the data range, the dashboard design user may export the dashboard as a file, the file may be executed by various software program including business software.
[0130]FIG. 17 is a screen display that allows a user to choose a chart view in order to display a dashboard. In particular, the query view 196 is part of the context viewer application and includes various data types from a business analytics database. If the user chooses to view a chart, the user may select the chart view 198. After a user selects the chart view 198 then the user may be presented with a screen shown in FIG. 18.
[0131]FIG. 18 is an example screen display showing the data mapping for the dashboard configuration screen. Screen 210 shows a user interface where the user may select (using a pull down menu) the type of technology 212 the user plans to use for the chart view display. Here, the user may select the type of dashboard file that was created as the technology. Next, the file path 214 of the exported dashboard or SWF file may be specified. After choosing a SWF file, the user may select the “Upload file to repository” button 730 in order to save a graphic file (SWF file) in the system 138. After selecting button 740“Generate XC Fields”, may be the name of the dashboard external data ranges (e.g. “Damages” and “Labels” in FIG. 16). In the mapping shown in FIG. 18, the user may enter or browse for the name of data source (Query ID). For example, the Query ID shown in this example is “ZOK_QN”. This entry is mapped against the data source that may be stored in the application data 146. The user may search for the Query Field ID, which is a specific field of data source Query ID (e.g. field “CODE TEXT” of Query ID “ZOK_QN” in the provided example). Creating this mapping allows the dashboard to utilize the data in the application data 146 or 130. As can be appreciated that programming in a textual or visual manner is not required and the user may create the dashboard, export the dashboard, map the fields and display the dashboard as shown in FIG. 19 using a graphical user interface that responds to a pointing device (e.g. mouse, pen or display device that is sensitive to touch or ocular movement).
[0132]FIG. 19 is an example screen display showing the graphical display of the data using the dashboard configuration from FIGS. 15-18. FIG. 19 shows a dashboard 216 that includes the bar graph 218 and pie chart 220. The labels and the value data in the bar and the pie charts 218 and 220 are from the business software and are different than the data used in FIG. 15. Therefore, the user can create a display of a dashboard in another application by using an external connection that may expose data fields to permit the visualization of any type of data.
[0133]The embodiments refer to a dashboard that may be a web-based or other technology based display on which real time data is collated, processed and displayed from multiple data sources that belong to one or more businesses. Other terms that may be used to describe a dashboard, include, digital dashboard, enterprise dashboard, business dashboard, executive dashboard, operational dashboard, BI dashboard, database dashboard, Web dashboard, performance dashboard, score card, KPI dashboard, metrics dashboard and so on. Dashboards may be designed to help any user monitor what's happening or has happened in the past visually or at a glance. Dashboards may provide the user a means to rapidly monitor the current status. Accordingly, dashboards must be designed to take advantage of the strengths of visual perception, cognition and work around or augment the user's weaknesses.
[0134]Embodiments can include a system for displaying data stored on computer readable non-transitory media. The system configured to access one or more data fields within a file. The file having been configured using an external connection adapter. The system may include a display computer system configured to map the accessed one or more data fields to data from one or more data sources, the mapping being performed based on a user input via a graphical user interface. In this embodiment, the system may be configured to display on the display computer system a dashboard according to the configuration setting stored in the file, the dashboard may show a graphical representation of the data from the one or more data sources and information from the one or more data fields.
[0135]In another embodiment, the dashboard includes dashboard display system that processes the data from the one or more data sources and displays a visual representation of the data in a graph or chart form. Alternatively or additionally, the dashboard includes a component that is modified by using a graphical user interface such that the dashboard display or components are modified.
[0136]In another embodiment, the file is generated by a first software program located in the dashboard design system that is configured to generate the dashboard. The display computing system may further comprise executing a second software program on the display computer system to retrieve the data from the one or more data sources and displaying the dashboard. The display computing system may include converting, using a generic adapter, the data from the one or more data sources into data structures that are compatible with a format of the graphic file.
[0137]In another embodiment the data is converted from the one or more data sources into data structures that are compatible with a format of the file using the external connection adapter. The file can be a short web format file that exposes one or more data fields that may be mapped to fields in one or more data sources. In another embodiment, the mapping may occur via a graphical user interface free of receiving textual programming code from the user.
[0138]In another embodiment, a computer-implemented method is stored on a computer readable media. Visualization software is integrated with a data processing application that includes configuring a dashboard display using a dashboard design system. The dashboard display can use one or more first data ranges from a spreadsheet as example data. An external connection adapter can be used to provide access to one or more first data ranges that are to be displayed in the dashboard display.
[0139]In other embodiments, the dashboard display is exported in a graphic file format. In certain embodiments, one or more first data ranges are accessed from the dashboard display using a display computing system. In one embodiment, one or more first data ranges are connected to one or more second data ranges from one or more data sources. The dashboard can display using data from the one or more second data ranges.
[0140]In one embodiment, the dashboard displays with the problem walls from clustering messages received from infrastructure 14 data can use a graphical user interface that is free from receiving textual or textual programming code from the client. In this embodiment the method may include processing place problem walls from clustering messages received from managed infrastructure 14 from the one or more data sources and displaying a visual representation of the data in a graph or chart form. This can include a method that includes a component that may be modified by using a graphical user interface that results in a modification of the dashboard display.
[0141]In one embodiment, a method is provided that includes a dashboard display generated by a first software program that generates a visual display. This can include, executing a second software program on the display computer system to retrieve the data from the one or more data sources and displaying the dashboard and the method may include converting, using a generic adapter, the data from the one or more data sources into data structures that are compatible with a format of the file.
[0142]In one embodiment, the exporting can include converting the place problem walls from clustering messages received from infrastructure 14 data from the one or more second data sources into data structures that are compatible with the graphic file format. In one embodiment, this can include converting using an external interface adapter. A graphic file format can be a short web format that allows a software to access the one or more first data ranges.
[0143]In another embodiment, a user interface system has an external connection adapter configured to provide access to one or more data fields within a file. As a non-limiting example, this can include a display computer system that maps using a graphical user interface the one or more data fields to data from one or more data sources. The display computer system can generate a dashboard display from a configuration in the file. In one embodiment, the display includes place problem walls from clustering messages received from infrastructure 14 data from one or more data sources and information from one or more data fields. A graphical user interface can be provided that is free of receiving textual programming code from the user.
[0144]In one embodiment, a first software executed on a display computer system that generates the dashboard in a visual graphic display. A second software program can be included to execute on the display computer system and retrieve the data from the one or more data sources and display the dashboard display. A generic adapter can be utilized to convert the data from the one or more data sources into one or more data structures that are compatible with a format of the file.
[0145]In one embodiment, a graphical user interface can modify a component and this can be used to modify the dashboard display.
[0146]In one embodiment, an external connection adapter converts the data from the one or more data sources into data structures that are compatible with a format of the file using the external connection adapter.
[0147]The logics can be machine-readable media for carrying or have machine-executable instructions or data structures stored thereon. The machine-readable media can be any available media that may be accessed by a general purpose or special purpose computer or other machine with a processor. As a non-limiting example, a variety of machine-readable media can be utilized, including but not limited to: RAM, ROM, EPROM, EEPROM, CD-ROM or other optical disk storage, magnetic disk storage or other magnetic storage devices, non-transitory computer readable media or non-transmissible computer-readable media or any other medium which may be used to carry or store desired program code in the form of machine-executable instructions or data structures and which may be accessed by a general purpose or special purpose computer or other machine with a processor. With the dashboard system, any such type of connection is termed a machine-readable medium. It will be appreciated that the machine-readable medium can include combinations of the preceding.
[0148]As non-limiting examples, with the dashboard system, machine-executable instructions can be: instructions and data which cause a general purpose computer, special purpose computer, or special purpose processing machines to perform a certain function or group of functions, and the like.
[0149]The dashboard system can be implemented by a program product including machine-executable instructions, such as program code. As a non-limiting example, this can be program modules executed by machines in networked environments. As non-limiting examples, the program modules can include routines, programs, objects, components, data structures, and the like, that perform particular tasks or implement particular abstract data types. As non-limiting examples the dashboard system can utilize, machine-executable instructions, associated data structures, and program modules as program code for executing steps of the methods disclosed herein.
[0150]As non-limiting examples, the dashboard system can be executed in a networked environment using logical connections to one or more remote computers having processors. AS non-limiting examples, suitable network computing environments can be, computers, including personal computers, mobile devices, multi-processor systems, microprocessor-based or programmable consumer electronics, network PCs, minicomputers, mainframe computers, and the like.
[0151]In certain embodiments, the dashboard system can be executed in distributed computing environments where tasks are performed by local and remote processing devices that are linked. As non-limiting examples, the linking can be by, hardwired links, wireless links, combination of hardwired or wireless links, and the like, through a communications network. In one embodiment, computing environment, program modules may be located in both local and remote memory storage devices.
[0152]As a non-limiting example, one embodiment of a system for implementing the overall system or portions of the embodiments can include a general purpose computing computers in the form of computers, including a processing unit, a system memory or database, and a system bus that couples various system components including the system memory to the processing unit. The database or system memory cam include read only memory (ROM) and random access memory (RAM).
[0153]As a non-limiting example, the database can be a magnetic hard disk drive for reading from and writing to a magnetic hard disk, a magnetic disk drive for reading from or writing to a removable magnetic disk, and an optical disk drive for reading from or writing to a removable optical disk such as a CD ROM or other optical media, and the like.
[0154]As a non-limiting example, the drives and their associated machine-readable media can be used to provide nonvolatile storage of machine-executable instructions, data structures, program modules and other data for the computer. It should also be noted that the word “terminal” as used herein is intended to encompass computer input and output devices. User interfaces, as described herein may include a computer with monitor, keyboard, a keypad, a mouse, joystick or other input devices performing a similar function.
[0155]Referring now to FIGS. 20 through 22, diagrams are provided illustrating embodiments of a mobile or computing device that can be used as infrastructure 14 with system 10.
[0156]Referring to FIGS. 20-22, the mobile or computing device can include a display that can be a touch sensitive display. The touch-sensitive display is sometimes called a “touch screen” for convenience, and may also be known as or called a touch-sensitive display system. The mobile or computing device may include a memory (which may include one or more computer readable storage mediums), a memory controller, one or more processing units (CPU's), a peripherals interface, Network Systems circuitry, including but not limited to RF circuitry, audio circuitry, a speaker, a microphone, an input/output (I/O) subsystem, other input or control devices, and an external port. The mobile or computing device may include one or more optical sensors. These components may communicate over one or more communication buses or signal lines.
[0157]It should be appreciated that the mobile or computing device is only one example of a portable multifunction mobile or computing device, and that the mobile or computing device may have more or fewer components than shown, may combine two or more components, or a may have a different configuration or arrangement of the components. The various components shown in FIG. 21 may be implemented in hardware, software or a combination of hardware and software, including one or more signal processing and/or application specific integrated circuits.
[0158]Memory may include high-speed random access memory and may also include non-volatile memory, such as one or more magnetic disk storage devices, flash memory devices, or other non-volatile solid-state memory devices. Access to memory by other components of the mobile or computing device, such as the CPU and the peripherals interface, may be controlled by the memory controller.
[0159]The peripherals interface couples the input and output peripherals of the device to the CPU and memory. The one or more processors run or execute various software programs and/or sets of instructions stored in memory to perform various functions for the mobile or computing device and to process data.
[0160]In some embodiments, the peripherals interface, the CPU, and the memory controller may be implemented on a single chip, such as a chip. In some other embodiments, they may be implemented on separate chips.
[0161]The Network System circuitry receives and sends signals, including but not limited to RF, also called electromagnetic signals. The Network System circuitry converts electrical signals to/from electromagnetic signals and communicates with communications networks and other communications devices via the electromagnetic signals. The Network Systems circuitry may include well-known circuitry for performing these functions, including but not limited to an antenna system, an RF transceiver, one or more amplifiers, a tuner, one or more oscillators, a digital signal processor, a CODEC chipset, a subscriber identity module (SIM) card, memory, and so forth. The Network Systems circuitry may communicate with networks, such as the Internet, also referred to as the World Wide Web (WWW), an intranet and/or a wireless network, such as a cellular telephone network, a wireless local area network (LAN) and/or a metropolitan area network (MAN), and other devices by wireless communication.
[0162]The wireless communication may use any of a plurality of communications standards, protocols and technologies, including but not limited to Global System for Mobile Communications (GSM), Enhanced Data GSM Environment (EDGE), high-speed downlink packet access (HSDPA), wideband code division multiple access (W-CDMA), code division multiple access (CDMA), time division multiple access (TDMA), BLUETOOTH®, Wireless Fidelity (Wi-Fi) (e.g., IEEE 802.11a, IEEE 802.11b, IEEE 802.11g and/or IEEE 802.11n), voice over Internet Protocol (VoIP), Wi-MAX, a protocol for email (e.g., Internet message access protocol (IMAP) and/or post office protocol (POP)), instant messaging (e.g., extensible messaging and presence protocol (XMPP), Session Initiation Protocol for Instant Messaging and Presence Leveraging Extensions (SIMPLE), and/or Instant Messaging and Presence Service (IMPS)), and/or Short Message Service (SMS)), or any other suitable communication protocol, including communication protocols not yet developed as of the filing date of this document.
[0163]The audio circuitry, the speaker, and the microphone provide an audio interface between a user and the mobile or computing device. The audio circuitry receives audio data from the peripherals interface, converts the audio data to an electrical signal, and transmits the electrical signal to the speaker. The speaker converts the electrical signal to human-audible sound waves. The audio circuitry also receives electrical signals converted by the microphone from sound waves. The audio circuitry converts the electrical signal to audio data and transmits the audio data to the peripherals interface for processing. Audio data may be retrieved from and/or transmitted to memory and/or the Network Systems circuitry by the peripherals interface. In some embodiments, the audio circuitry also includes a headset jack (FIG. 20). The headset jack provides an interface between the audio circuitry and removable audio input/output peripherals, such as output-only headphones or a headset with both output (e.g., a headphone for one or both ears) and input (e.g., a microphone).
[0164]The I/O subsystem couples input/output peripherals on the mobile or computing device, such as the touch screen and other input/control devices, to the peripherals interface. The I/O subsystem may include a display controller and one or more input controllers for other input or control devices. The one or more input controllers 1 receive/send electrical signals from/to other input or control devices. The other input/control devices may include physical buttons (e.g., push buttons, rocker buttons, etc.), dials, slider switches, and joysticks, click wheels, and so forth. In some alternate embodiments, input controller(s) may be coupled to any (or none) of the following: a keyboard, infrared port, USB port, and a pointer device such as a mouse. The one or more buttons may include an up/down button for volume control of the speaker and/or the microphone. The one or more buttons may include a push button. A quick press of the push button may disengage a lock of the touch screen or begin a process that uses gestures on the touch screen to unlock the device, as described in U.S. patent application Ser. No. 11/322,549, “Unlocking a Device by Performing Gestures on an Unlock Image,” filed Dec. 23, 2005, which is hereby incorporated by reference in its entirety. A longer press of the push button may turn power to the mobile or computing device on or off. The user may be able to customize a functionality of one or more of the buttons. The touch screen is used to implement virtual or soft buttons and one or more soft keyboards.
[0165]The touch-sensitive touch screen provides an input interface and an output interface between the device and a user. The display controller receives and/or sends electrical signals from/to the touch screen. The touch screen displays visual output to the user. The visual output may include graphics, text, icons, video, and any combination thereof (collectively termed “graphics”). In some embodiments, some or all of the visual output may correspond to user-interface objects, further details of which are described below.
[0166]A touch screen has a touch-sensitive surface, sensor or set of sensors that accepts input from the user based on haptic and/or tactile contact. The touch screen and the display controller (along with any associated modules and/or sets of instructions in memory) detect contact (and any movement or breaking of the contact) on the touch screen and converts the detected contact into interaction with user-interface objects (e.g., one or more soft keys, icons, web pages or images) that are displayed on the touch screen. In an exemplary embodiment, a point of contact between a touch screen and the user corresponds to a finger of the user.
[0167]The touch screen may use LCD (liquid crystal display) technology, or LPD (light emitting polymer display) technology, although other display technologies may be used in other embodiments. The touch screen and the display controller may detect contact and any movement or breaking thereof using any of a plurality of touch sensing technologies now known or later developed, including but not limited to capacitive, resistive, infrared, and surface acoustic wave technologies, as well as other proximity sensor arrays or other elements for determining one or more points of contact with a touch screen.
[0168]A touch-sensitive display in some embodiments of the touch screen may be analogous to the multi-touch sensitive tablets described in the following U.S. Pat. No. 6,323,846 (Westerman et al.), U.S. Pat. No. 6,570,557 (Westerman et al.), and/or U.S. Pat. No. 6,677,932 (Westerman), and/or U.S. Patent Publication 2002/0015024A1, each of which is hereby incorporated by reference in their entirety. However, a touch screen displays visual output from the portable mobile or computing device, whereas touch sensitive tablets do not provide visual output.
[0169]A touch-sensitive display in some embodiments of the touch screen may be as described in the following applications: (1) U.S. patent application Ser. No. 11/381,313, “Multipoint Touch Surface Controller,” filed May 12, 2006; (2) U.S. patent application Ser. No. 10/840,862, “Multipoint Touchscreen,” filed May 6, 2004; (3) U.S. patent application Ser. No. 10/903,964, “Gestures For Touch Sensitive Input Devices,” filed Jul. 30, 2004; (4) U.S. patent application Ser. No. 11/048,264, “Gestures For Touch Sensitive Input Devices,” filed Jan. 31, 2005; (5) U.S. patent application Ser. No. 11/038,590, “Mode-Based Graphical User Interfaces For Touch Sensitive Input Devices,” filed Jan. 18, 2005; (6) U.S. patent application Ser. No. 11/228,758, “Virtual Input Device Placement On A Touch Screen User Interface,” filed Sep. 16, 2005; (7) U.S. patent application Ser. No. 11/228,700, “Operation Of A Computer With A Touch Screen Interface,” filed Sep. 16, 2005; (8) U.S. patent application Ser. No. 11/228,737, “Activating Virtual Keys Of A Touch-Screen Virtual Keyboard,” filed Sep. 16, 2005; and (9) U.S. patent application Ser. No. 11/367,749, “Multi-Functional Hand-Held Device,” filed Mar. 3, 2006. All of these applications are incorporated by reference herein in their entirety.
[0170]The touch screen may have a resolution in excess of 1000 dpi. In an exemplary embodiment, the touch screen has a resolution of approximately 1060 dpi. The user may make contact with the touch screen using any suitable object or appendage, such as a stylus, a finger, and so forth. In some embodiments, the user interface is designed to work primarily with finger-based contacts and gestures, which are much less precise than stylus-based input due to the larger area of contact of a finger on the touch screen. In some embodiments, the device translates the rough finger-based input into a precise pointer/cursor position or command for performing the actions desired by the user.
[0171]In some embodiments, in addition to the touch screen, the mobile or computing device may include a touchpad (not shown) for activating or deactivating particular functions. In some embodiments, the touchpad is a touch-sensitive area of the device that, unlike the touch screen, does not display visual output. The touchpad may be a touch-sensitive surface that is separate from the touch screen or an extension of the touch-sensitive surface formed by the touch screen.
[0172]In some embodiments, the mobile or computing device may include a physical or virtual click wheel as an input control device. A user may navigate among and interact with one or more graphical objects (henceforth referred to as icons) displayed in the touch screen by rotating the click wheel or by moving a point of contact with the click wheel (e.g., where the amount of movement of the point of contact is measured by its angular displacement with respect to a center point of the click wheel). The click wheel may also be used to select one or more of the displayed icons. For example, the user may press down on at least a portion of the click wheel or an associated button. User commands and navigation commands provided by the user via the click wheel may be processed by an input controller as well as one or more of the modules and/or sets of instructions in memory. For a virtual click wheel, the click wheel and click wheel controller may be part of the touch screen and the display controller, respectively. For a virtual click wheel, the click wheel may be either an opaque or semitransparent object that appears and disappears on the touch screen display in response to user interaction with the device. In some embodiments, a virtual click wheel is displayed on the touch screen of a portable multifunction device and operated by user contact with the touch screen.
[0173]The mobile or computing device also includes a power system for powering the various components. The power system may include a power management system, one or more power sources (e.g., battery, alternating current (AC)), a recharging system, a power failure detection circuit, a power converter or inverter, a power status indicator (e.g., a light-emitting diode (LED)) and any other components associated with the generation, management and distribution of power in portable devices.
[0174]The mobile or computing device may also include one or more sensors, including not limited to optical sensors. FIG. 30 illustrates how an optical sensor coupled to an optical sensor controller in I/O subsystem. The optical sensor may include charge-coupled device (CCD) or complementary metal-oxide semiconductor (CMOS) phototransistors. The optical sensor receives light from the environment, projected through one or more lens, and converts the light to data representing an image. In conjunction with an imaging module 58 (also called a camera module); the optical sensor may capture still images or video. In some embodiments, an optical sensor is located on the back of the mobile or computing device, opposite the touch screen display on the front of the device, so that the touch screen display may be used as a viewfinder for either still and/or video image acquisition. In some embodiments, an optical sensor is located on the front of the device so that the user's image may be obtained for videoconferencing while the user views the other video conference participants on the touch screen display. In some embodiments, the position of the optical sensor can be changed by the user (e.g., by rotating the lens and the sensor in the device housing) so that a single optical sensor may be used along with the touch screen display for both video conferencing and still and/or video image acquisition.
[0175]The mobile or computing device may also include one or more proximity sensors. In one embodiment, the proximity sensor is coupled to the peripherals interface. Alternately, the proximity sensor may be coupled to an input controller in the I/O subsystem. The proximity sensor may perform as described in U.S. patent application Ser. No. 11/241,839, “Proximity Detector In Handheld Device,” filed Sep. 30, 2005; Ser. No. 11/240,788, “Proximity Detector In Handheld Device,” filed Sep. 30, 2005; Ser. No. 13/096,386, “Using Ambient Light Sensor To Augment Proximity Sensor Output”; Ser. No. 13/096,386, “Automated Response To And Sensing Of User Activity In Portable Devices,” filed Oct. 24, 2006; and Ser. No. 11/638,251, “Methods And Systems For Automatic Configuration Of Peripherals,” which are hereby incorporated by reference in their entirety. In some embodiments, the proximity sensor turns off and disables the touch screen when the multifunction device is placed near the user's ear (e.g., when the user is making a phone call). In some embodiments, the proximity sensor keeps the screen off when the device is in the user's pocket, purse, or other dark area to prevent unnecessary battery drainage when the device is a locked state.
[0176]In some embodiments, the software components stored in memory may include an operating system, a communication module (or set of instructions), a contact/motion module (or set of instructions), a graphics module (or set of instructions), a text input module (or set of instructions), a Global Positioning System (GPS) module (or set of instructions), and applications (or set of instructions).
[0177]The operating system (e.g., Darwin, RTXC, LINUX, UNIX, OS X, WINDOWS, or an embedded operating system such as VxWorks) includes various software components and/or drivers for controlling and managing general system tasks (e.g., memory management, storage device control, power management, etc.) and facilitates communication between various hardware and software components.
[0178]The communication module facilitates communication with other devices over one or more external ports and also includes various software components for handling data received by the Network Systems circuitry and/or the external port. The external port (e.g., Universal Serial Bus (USB), FIREWIRE, etc.) is adapted for coupling directly to other devices or indirectly over a network (e.g., the Internet, wireless LAN, etc.). In some embodiments, the external port is a multi-pin (e.g., 30-pin) connector that is the same as, or similar to and/or compatible with the 30-pin connector used on iPod (trademark of Apple Computer, Inc.) devices.
[0179]The contact/motion module may detect contact with the touch screen (in conjunction with the display controller) and other touch sensitive devices (e.g., a touchpad or physical click wheel). The contact/motion module includes various software components for performing various operations related to detection of contact, such as determining if contact has occurred, determining if there is movement of the contact and tracking the movement across the touch screen, and determining if the contact has been broken (i.e., if the contact has ceased). Determining movement of the point of contact may include determining speed (magnitude), velocity (magnitude and direction), and/or an acceleration (a change in magnitude and/or direction) of the point of contact. These operations may be applied to single contacts (e.g., one finger contacts) or to multiple simultaneous contacts (e.g., “multitouch”/multiple finger contacts). In some embodiments, the contact/motion module and the display controller also detect contact on a touchpad. In some embodiments, the contact/motion module and the controller detects contact on a click wheel.
[0180]Examples of other applications that may be stored in memory include other word processing applications, JAVA-enabled applications, encryption, digital rights management, voice recognition, and voice replication.
[0181]In conjunction with touch screen, display controller, contact module, graphics module, and text input module, a contacts module may be used to manage an address book or contact list, including: adding name(s) to the address book; deleting name(s) from the address book; associating telephone number(s), e-mail address(es), physical address(es) or other information with a name; associating an image with a name; categorizing and sorting names; providing telephone numbers or e-mail addresses to initiate and/or facilitate communications by telephone, video conference, e-mail, or IM; and so forth.
[0182]The foregoing description of various embodiments of the claimed subject matter has been provided for the purposes of illustration and description. It is not intended to be exhaustive or to limit the claimed subject matter to the precise forms disclosed. Many modifications and variations will be apparent to the practitioner skilled in the art. Particularly, while the concept “component” is used in the embodiments of the systems and methods described above, it will be evident that such concept can be interchangeably used with equivalent concepts such as, class, method, type, interface, module, object model, and other suitable concepts. Embodiments were chosen and described in order to best describe the principles of the invention and its practical application, thereby enabling others skilled in the relevant art to understand the claimed subject matter, the various embodiments and with various modifications that are suited to the particular use contemplated.

PUM

no PUM

Description & Claims & Application Information

We can also present the details of the Description, Claims and Application information to help users get a comprehensive understanding of the technical details of the patent, such as background art, summary of invention, brief description of drawings, description of embodiments, and other original content. On the other hand, users can also determine the specific scope of protection of the technology through the list of claims; as well as understand the changes in the life cycle of the technology with the presentation of the patent timeline. Login to view more.
Why Eureka
Try Eureka