Suggesting Sensor Placements for Improving Emission Inventory

a technology of emission inventory and sensor placement, applied in the field of information technology, can solve the problems of time-consuming and expensive processes, and achieve the effect of improving emission inventory and increasing emission inventory accuracy

Active Publication Date: 2018-08-02
IBM CORP
View PDF0 Cites 5 Cited by
  • Summary
  • Abstract
  • Description
  • Claims
  • Application Information

AI Technical Summary

Benefits of technology

[0003]In one embodiment of the present invention, techniques for suggesting sensor placements for improving emission inventory are provided. An exemplary computer-implemented method can include simulating the concentration of each of one or more pollutants over a given geographic area for a given temporal period, wherein the given geographic area is covered by a sensor network grid, and wherein the simulating step comprises applying one or more pre-determined models to a first version of an emission inventory corresponding to the given geographic area, wherein the emission inventory comprises a pre-determined estimation of the amount of each of the one or more pollutants discharged into the given geographic area within the given temporal period. Such a method can also include computing any discrepancy between the simulated concentration of each of the one or more pollutants and historical data pertaining to the one or more pollutants, and applying multiple scaling vectors to the first version of the emission inventory to generate multiple scaled versions of the emission inventory, wherein each of the scaling vectors comprises a correction factor that is multiplied with the first version of the emission inventory to generate a distinct scaled version of the emission inventory. Additionally, for each of the scaled versions of the emission inventory, such a method can include simulating the concentration of each of the one or more pollutants over the given geographic area for the given temporal period by applying the one or more pre-determined models to the scaled version of the emission inventory, and computing any discrepancy between the simulated concentration of each of the one or more pollutants and the historical data. Further, such a method can include identifying each of the scaling vectors that corresponds with a discrepancy that is within a pre-determined range, and applying the identified scaling vectors to an emission inventory value attributed to each of multiple grid blocks within the sensor network grid, to generate a set of scaled emission inventory values for each of the multiple grid blocks. Also, such a method can include determining one or more of the grid blocks having greater variability within its set of scaled emission inventory values, relative to the other grid blocks, wherein greater variability within a set of scaled emission inventory values corresponds to less confidence in the set of scaled emission inventory values, and outputting a sensor placement suggestion to a user, wherein the sensor placement suggestion identifies each of the one or more determined grid blocks as a candidate for placement of a sensor to increase emission inventory accuracy for the given geographic area.

Problems solved by technology

Such a process, however, is commonly time-consuming and expensive.

Method used


Image

  • Suggesting Sensor Placements for Improving Emission Inventory
  • Suggesting Sensor Placements for Improving Emission Inventory
  • Suggesting Sensor Placements for Improving Emission Inventory

Examples


Embodiment Construction

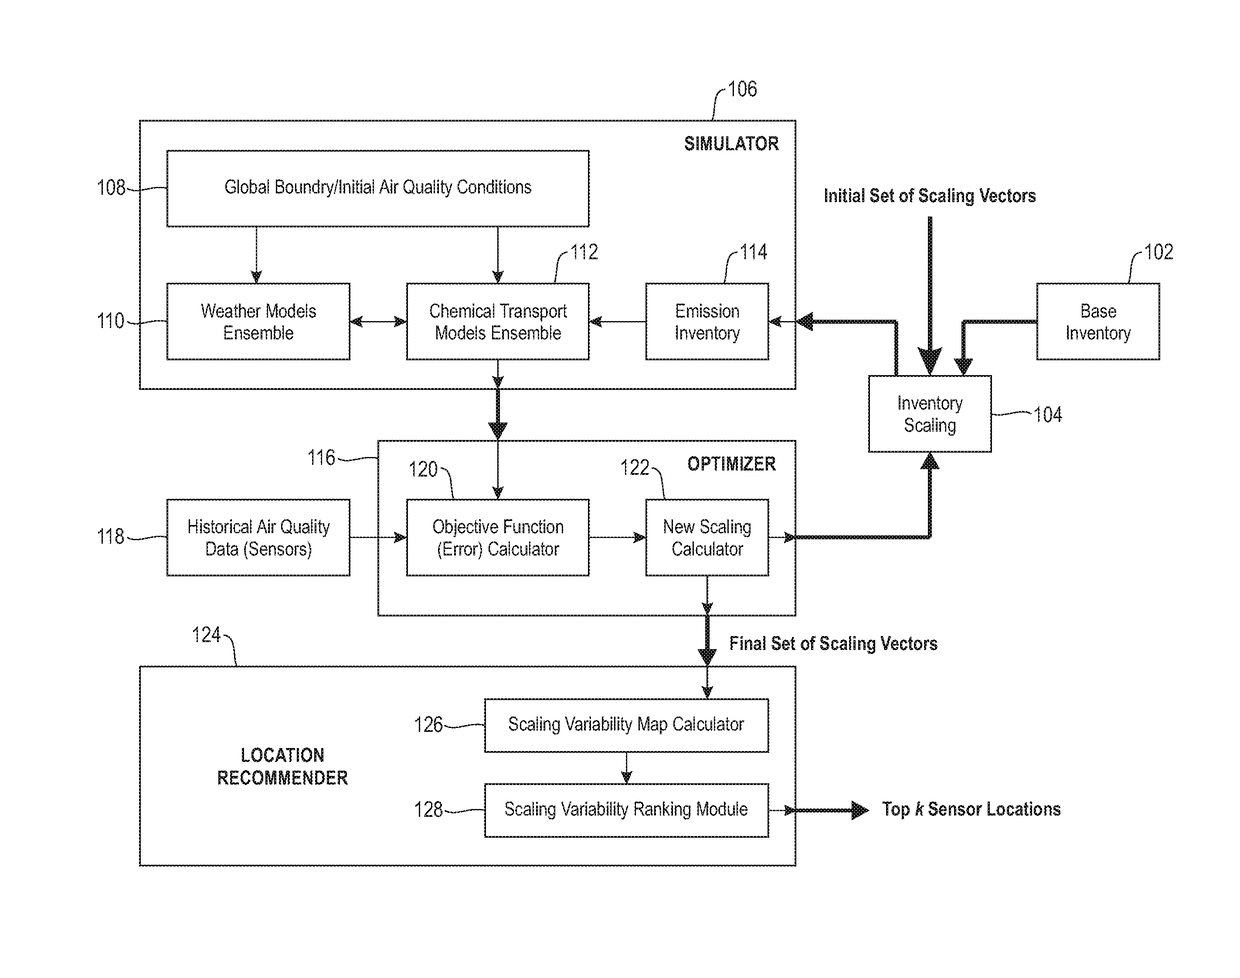
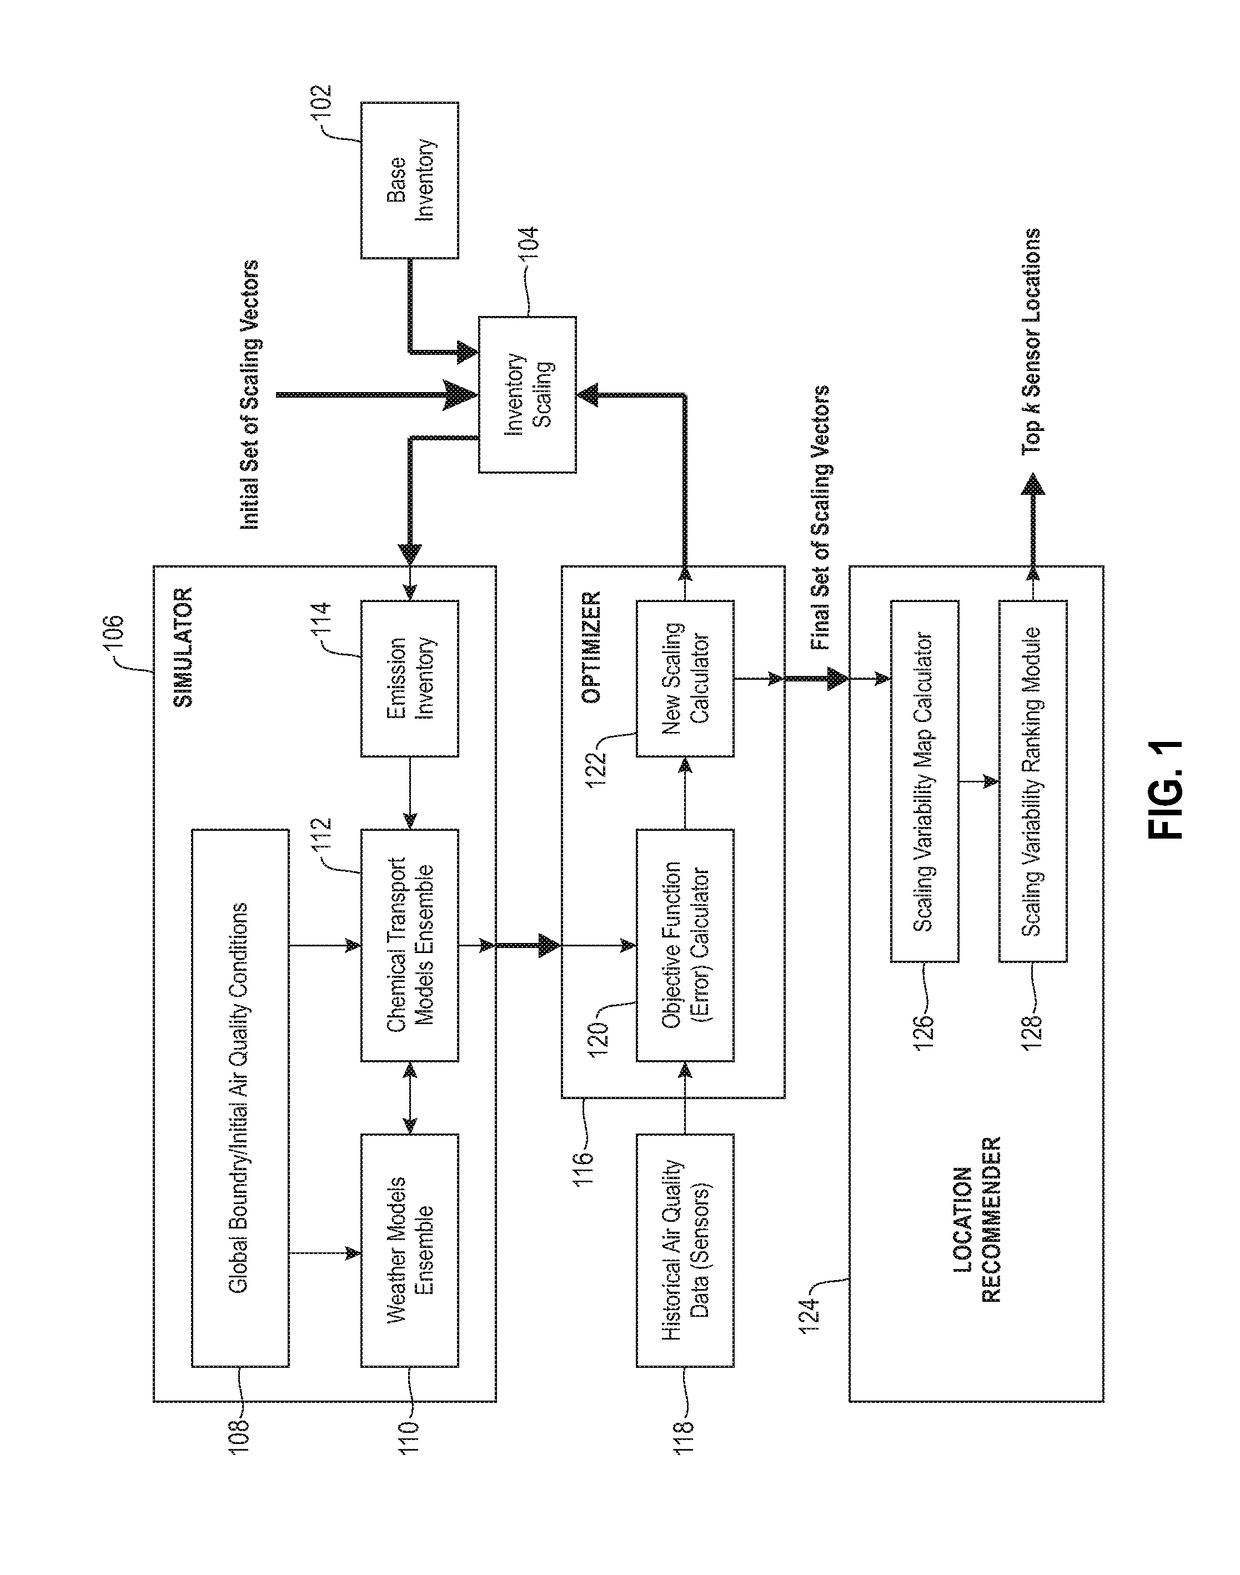
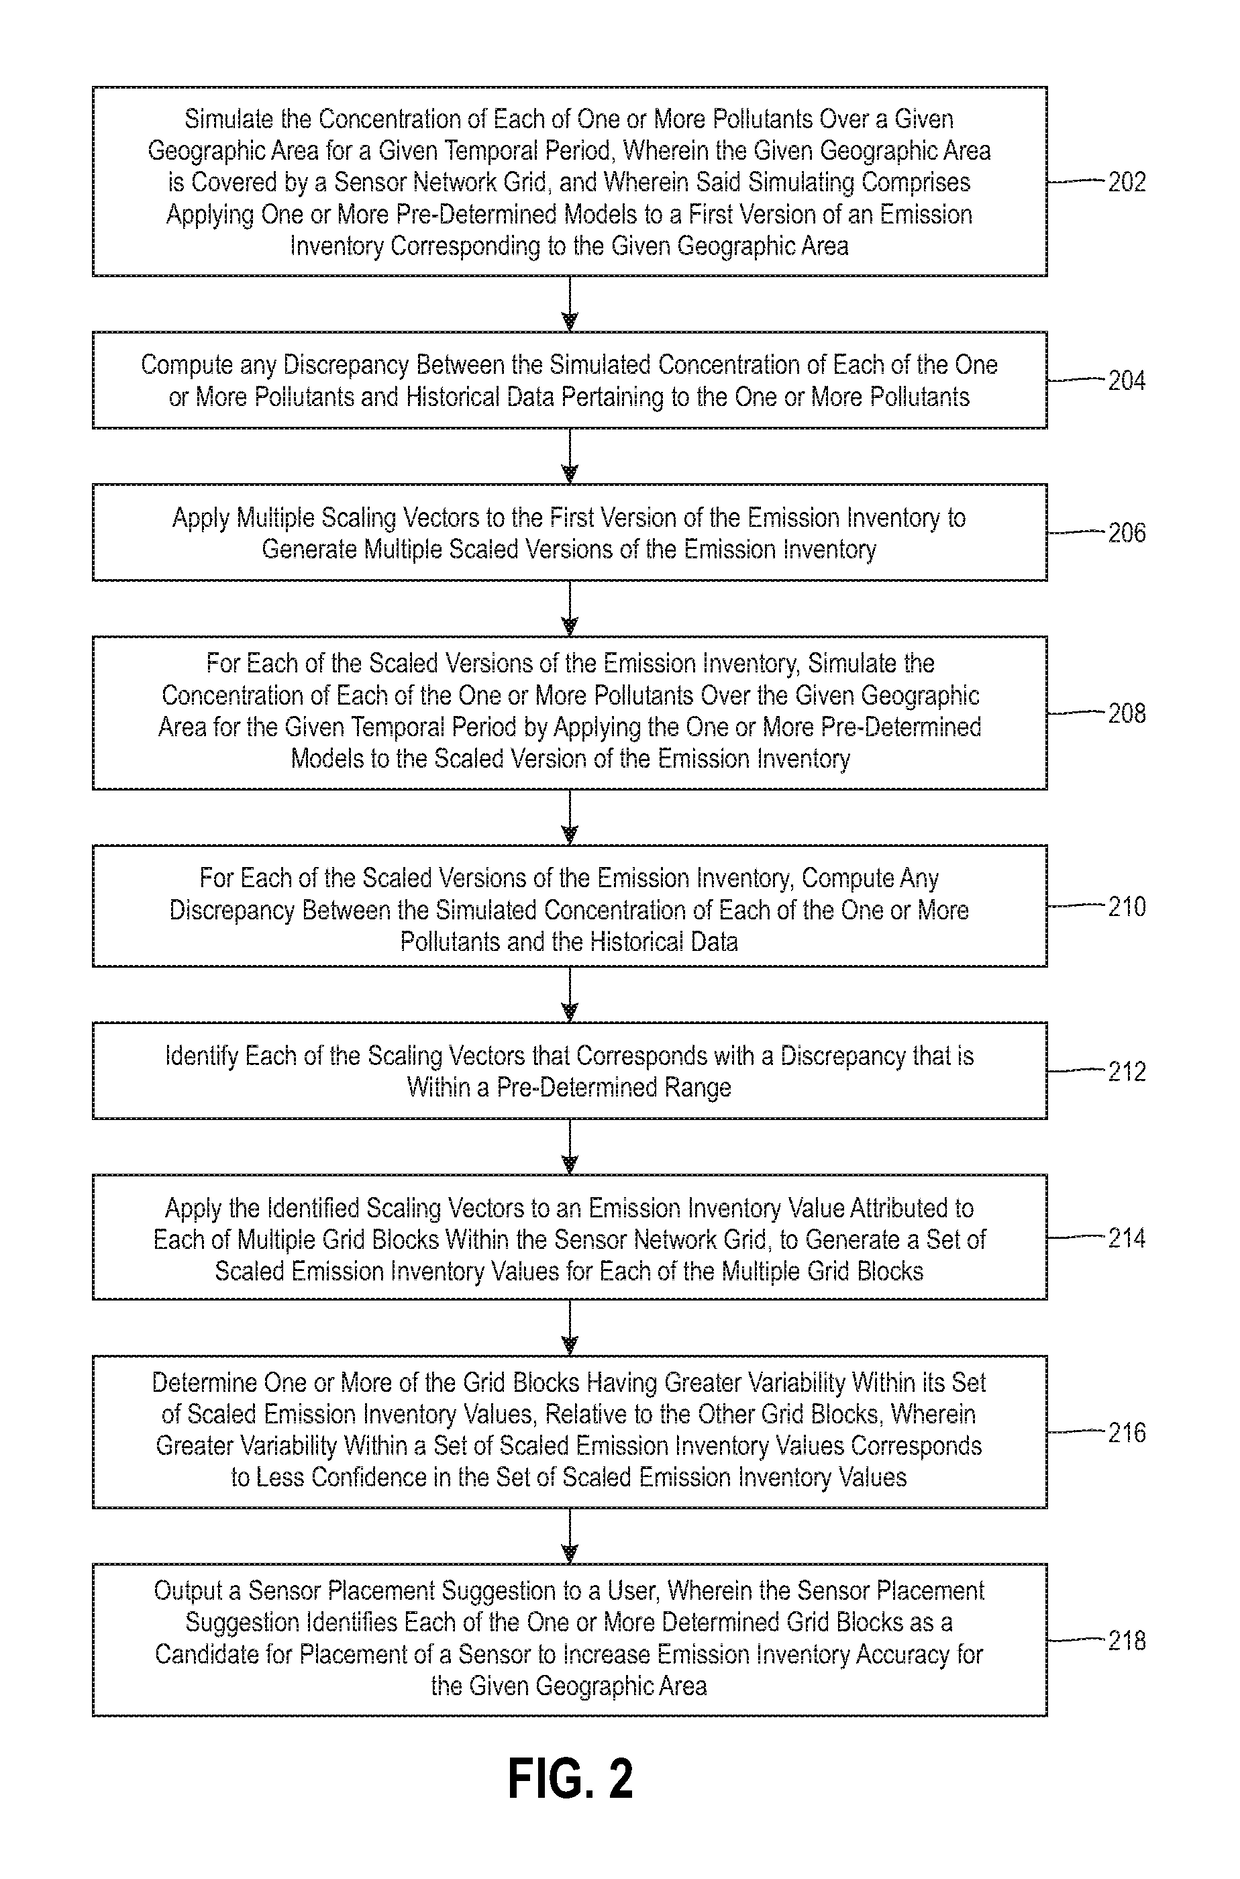
[0012]As described herein, an embodiment of the present invention includes suggesting sensor placements for improving the confidence in a calculated emission inventory. As also detailed herein, air pollution sensor networks can provide real-time information regarding the ambient air pollution concentration that results from transformation of emitted pollutants through various physical and chemical processes. Using such sensors, one or more embodiments of the invention can include estimating shortcomings in the identifiability of a given inventory and improving confidence in the calculated inventory based on any identified shortcomings.

[0013]At least one embodiment of the invention includes recommending and / or suggesting a placement and / or location of one or more sensors to be added to a sensor network to improve the confidence in the corresponding estimated emission inventory. Further, such an embodiment can include identifying an emission grid with high sensitivity with respect to ...


PUM


Abstract

Methods, systems, and computer program products for suggesting sensor placements are provided herein. A method includes simulating the concentration of a pollutant over an area covered by a sensor network grid by applying models to an emission inventory corresponding to the area; computing any discrepancy between the simulated concentration and historical data; applying scaling vectors to the first version to generate scaled versions of the emission inventory; re-simulating the concentration of the pollutant by applying the models to the scaled versions, and computing any discrepancy between the re-simulated concentrations and the historical data; identifying each scaling vector that corresponds with a discrepancy within a pre-determined range; applying the identified scaling vectors to an emission inventory value of each of the grid blocks to generate scaled emission inventory values; determining the grid blocks having high variability within scaled emission inventory values; and suggesting a sensor placement at the determined grid blocks.

Description

FIELD[0001]The present application generally relates to information technology, and, more particularly, to emission grid technology.BACKGROUND[0002]Emission inventories are utilized for a wide range of environmental measures related to the prevention and / or reduction of air pollution. As used herein, an emissions inventory can include a comprehensive estimate of air emissions of criteria pollutants, criteria precursors, and hazardous air pollutants from air emissions sources. Also, emission inventories are typically prepared by collecting the data from government and / or commercial agencies and blending such data with additional data from one or more other sources that can include demography, energy consumption, vehicle information, etc. Such a process, however, is commonly time-consuming and expensive.SUMMARY[0003]In one embodiment of the present invention, techniques for suggesting sensor placements for improving emission inventory are provided. An exemplary computer-implemented me...

Claims


Application Information

Patent Timeline
Patent Type & Authority Applications(United States)
IPC IPC(8): G06F17/50G06F17/30G06Q50/26
CPCG06F17/5009G06Q50/26G06F17/30241Y02P90/845G06F16/29G06F30/20
Inventor BASU, SAURAVGEORGE, THOMASMITTAL, RASHMIRADHAKRISHNAN, CHANDRASEKARSABHARWAL, YOGISHVERMA, ASHISH
Owner IBM CORP
Why Eureka
Try Eureka