Allocation method and system for atmospheric non-point source emission list

A distribution method and non-point source technology, applied in the fields of instruments, electrical digital data processing, technical management, etc., can solve the problems of inability to transmit air quality model data, and achieve the effect of reducing the difficulty of work and improving the efficiency of forecasting.

Pending Publication Date: 2020-11-10
JINAN UNIVERSITY
View PDF1 Cites 6 Cited by
  • Summary
  • Abstract
  • Description
  • Claims
  • Application Information

AI Technical Summary

Problems solved by technology

[0004] In order to solve the technical defect that the establishment and distribution of the existing atmospheric surface source emission list does not have the function of compiling NetCDF files, resulting in the inability to carry out data transmission with the air quality model running under the Linux system, the present invention provides a method for atmospheric surface source emission List distribution method and system

Method used


Image

  • Allocation method and system for atmospheric non-point source emission list
  • Allocation method and system for atmospheric non-point source emission list
  • Allocation method and system for atmospheric non-point source emission list

Examples


Embodiment 1

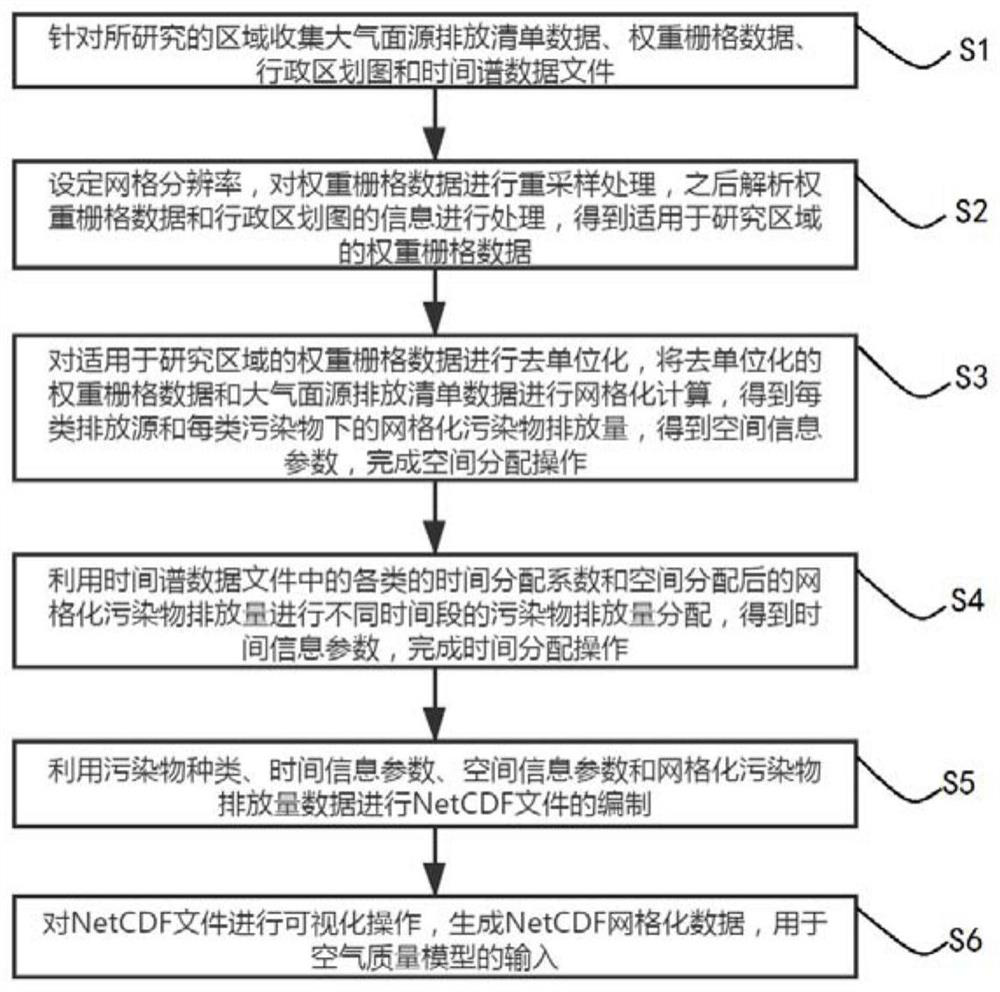
[0035] like figure 1 As shown, an allocation method for the emission inventory of atmospheric surface sources includes the following steps:

[0036] S1: Collect atmospheric non-point source emission inventory data, weight grid data, administrative division map and time spectrum data files for the studied area;

[0037] S2: Set the grid resolution, resample the weighted raster data, and then analyze the weighted raster data and the information of the administrative division map for processing to obtain the weighted raster data suitable for the research area;

[0038] S3: Deunitize the weighted raster data applicable to the study area, perform grid calculation on the deunitized weighted raster data and atmospheric surface source emission inventory data, and obtain each type of emission source and each type of pollutant. The grid pollutant discharge amount is obtained, the spatial information parameters are obtained, and the spatial allocation operation is completed;

[0039] S...

Embodiment 2

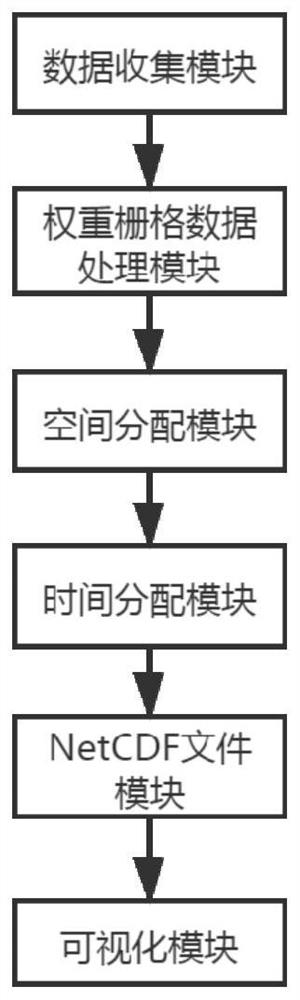
[0050] like figure 2 As shown, an allocation system for atmospheric surface source emission inventory applies a distribution method for atmospheric surface source emission inventory, including data collection module, weight raster data processing module, spatial allocation module, time allocation module, NetCDF A file module and a visualization module; the output end of the data collection module is electrically connected to the input end of the weight raster data processing module, and the output end of the weight raster data processing module is electrically connected to the input end of the space allocation module, The output end of the space allocation module is electrically connected to the input end of the time allocation module, the output end of the time allocation module is electrically connected to the input end of the NetCDF file module, and the output end of the NetCDF file module is connected to the visualization module The input end is electrically connected; th...

Embodiment 3

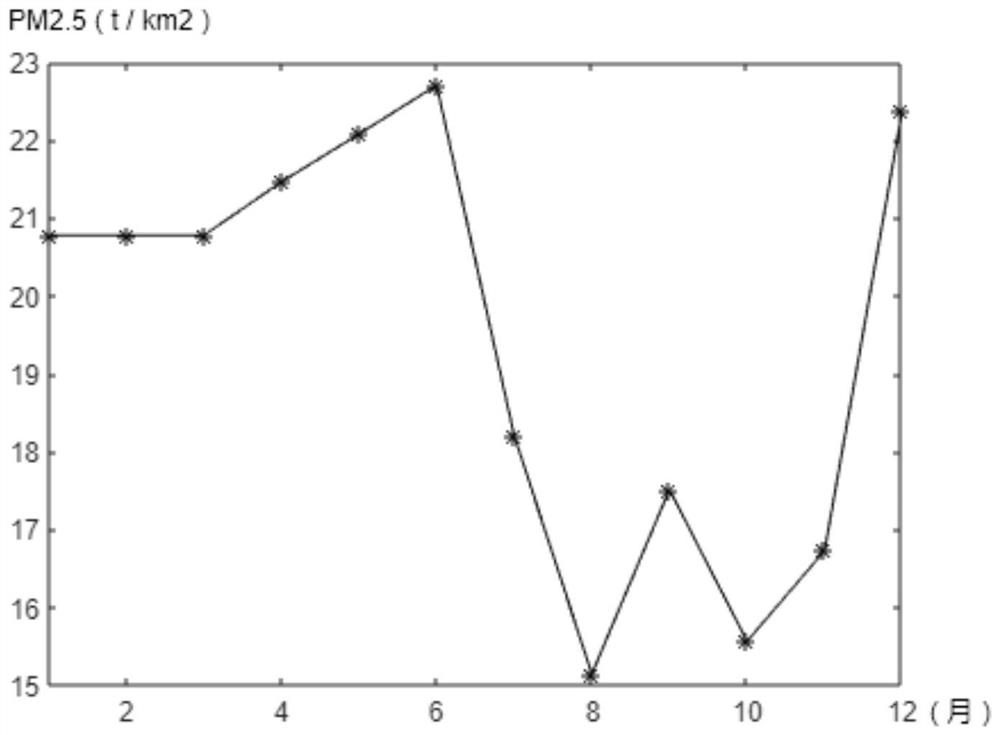
[0054] like image 3 , Figure 4 , Figure 5 , Figure 6 and Figure 7 As shown, taking the spatio-temporal distribution of the 2012 Atmospheric Non-point Source Emissions Inventory in the Pearl River Delta Region of China as an example:

[0055] (1) Data preparation:

[0056] Extract the 2012 population distribution raster map from the LandScan Asian population distribution raster data, the format is .tif, and the coordinates are Lambert projection;

[0057] Obtain the administrative map of the Pearl River Delta city, the research area includes Guangzhou, Shenzhen, Zhuhai, Foshan, Jiangmen, Dongguan, Zhongshan, Huizhou and Zhaoqing 9 cities in the Pearl River Delta region, the format is .shp, and the coordinates are Lambert projection;

[0058] According to the data collected in the literature, SO in the Pearl River Delta region in 2012 from living sources (all kinds of domestic emission sources) and dust sources (road dust, storage yard dust and construction dust) 2 , ...


PUM


Abstract

The invention provides an allocation method and system for an atmospheric non-point source emission list. The allocation method comprises the following steps: firstly, collecting atmospheric non-pointsource emission list data, weight raster data, an administrative map and a time spectrum data file for a researched area; performing grid division operation on the administrative map, and loading theweight grid data to the gridded administrative map to obtain new weight grid data; performing de-unitization operation on the new weight raster data, and performing gridding calculation on the weightraster data and the atmospheric non-point source emission data to obtain gridding pollutant emission amount and complete space allocation operation; performing pollutant discharge distribution in different time periods by utilizing various time distribution coefficients in the time spectrum file and the gridding discharge after space distribution to finish time distribution operation; compiling aNetCDF file by utilizing the time-space information parameters and the gridding emission data; and finally, the manufactured NetCDF gridding data can be used for the input of an air quality model andthe visual operation of the NetCDF.

Description

technical field [0001] The invention relates to the technical field of environmental protection, and more specifically, to a distribution method and system for atmospheric surface source emission inventory. Background technique [0002] Recent studies have shown that domestic urban agglomerations show the characteristics of regional air pollution, and the pollutants emitted by atmospheric non-point sources have an important contribution to the total amount of air pollutants in the region. The spatial distribution of pollutant emissions from air pollution sources is one of the key steps in the preprocessing models of air quality models such as CMAQ. In the existing technology, the researchers mainly use the related GIS software under the Windows system to establish the emission inventory, but the GIS software does not have the function of compiling NetCDF files, so it is difficult to compare the emission inventory data established by themselves with the Linux system. Running...

Claims


Application Information

Patent Timeline
Patent Type & Authority Applications(China)
IPC IPC(8): G06Q50/26G06Q10/04G06F40/151
CPCG06Q10/04G06Q50/26G06F40/151Y02P90/845
Inventor 黄青柴源
Owner JINAN UNIVERSITY
Why Eureka
Try Eureka