
Data analysis system and analysis method therefor

Active Publication Date: 2018-11-08
ZHANG HAN WEI
View PDF0 Cites 0 Cited by
  • Summary
  • Abstract
  • Description
  • Claims
  • Application Information

AI Technical Summary

Benefits of technology

The present invention provides a data analysis system and method that allows users to quickly understand the relevance between different events and explore various possibilities between them. The system displays integration information that can help users quickly learn about the relevance between different parameters in the research data. This helps improve research efficiency and results.

Problems solved by technology

In recent years, an issue of big data (big data) is often mentioned, and big data refers to information that involves a huge amount of data and cannot be manually acquired, managed, processed, and arranged within a proper time in a form that can be interpreted by human beings.
However, if there are different particular items, the foregoing analysis needs to be performed repeatedly, to respectively obtain analysis results that belong to the different particular items, but it is difficult to find out relevance between two different particular items.

Method used


Image

  • Data analysis system and analysis method therefor
  • Data analysis system and analysis method therefor
  • Data analysis system and analysis method therefor

Examples


first embodiment

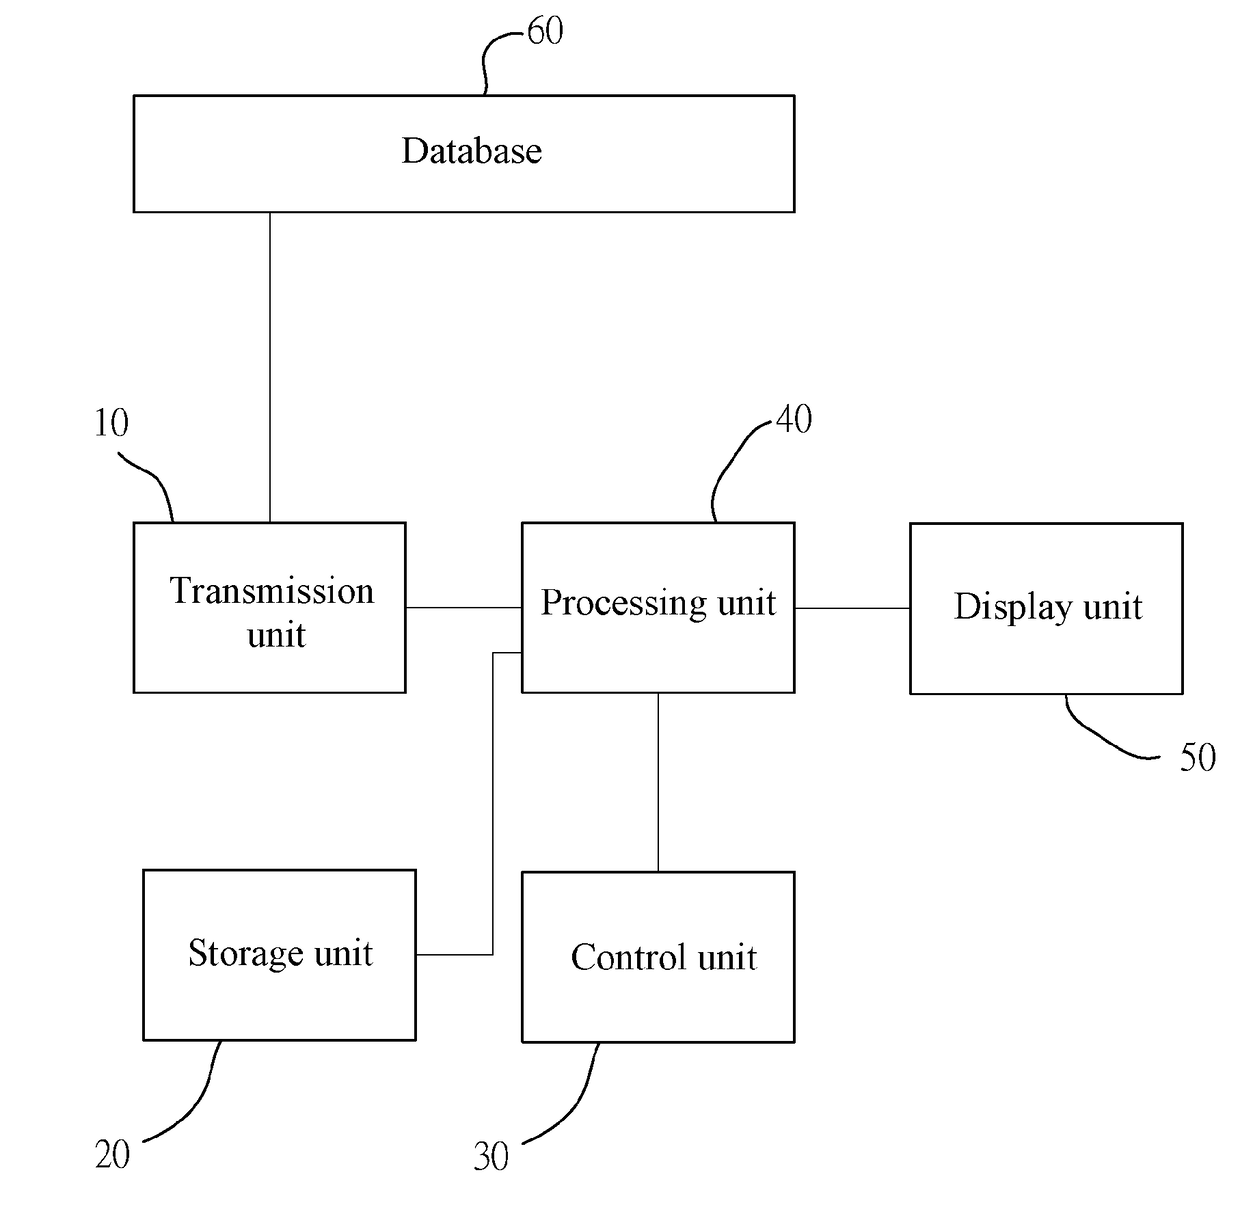
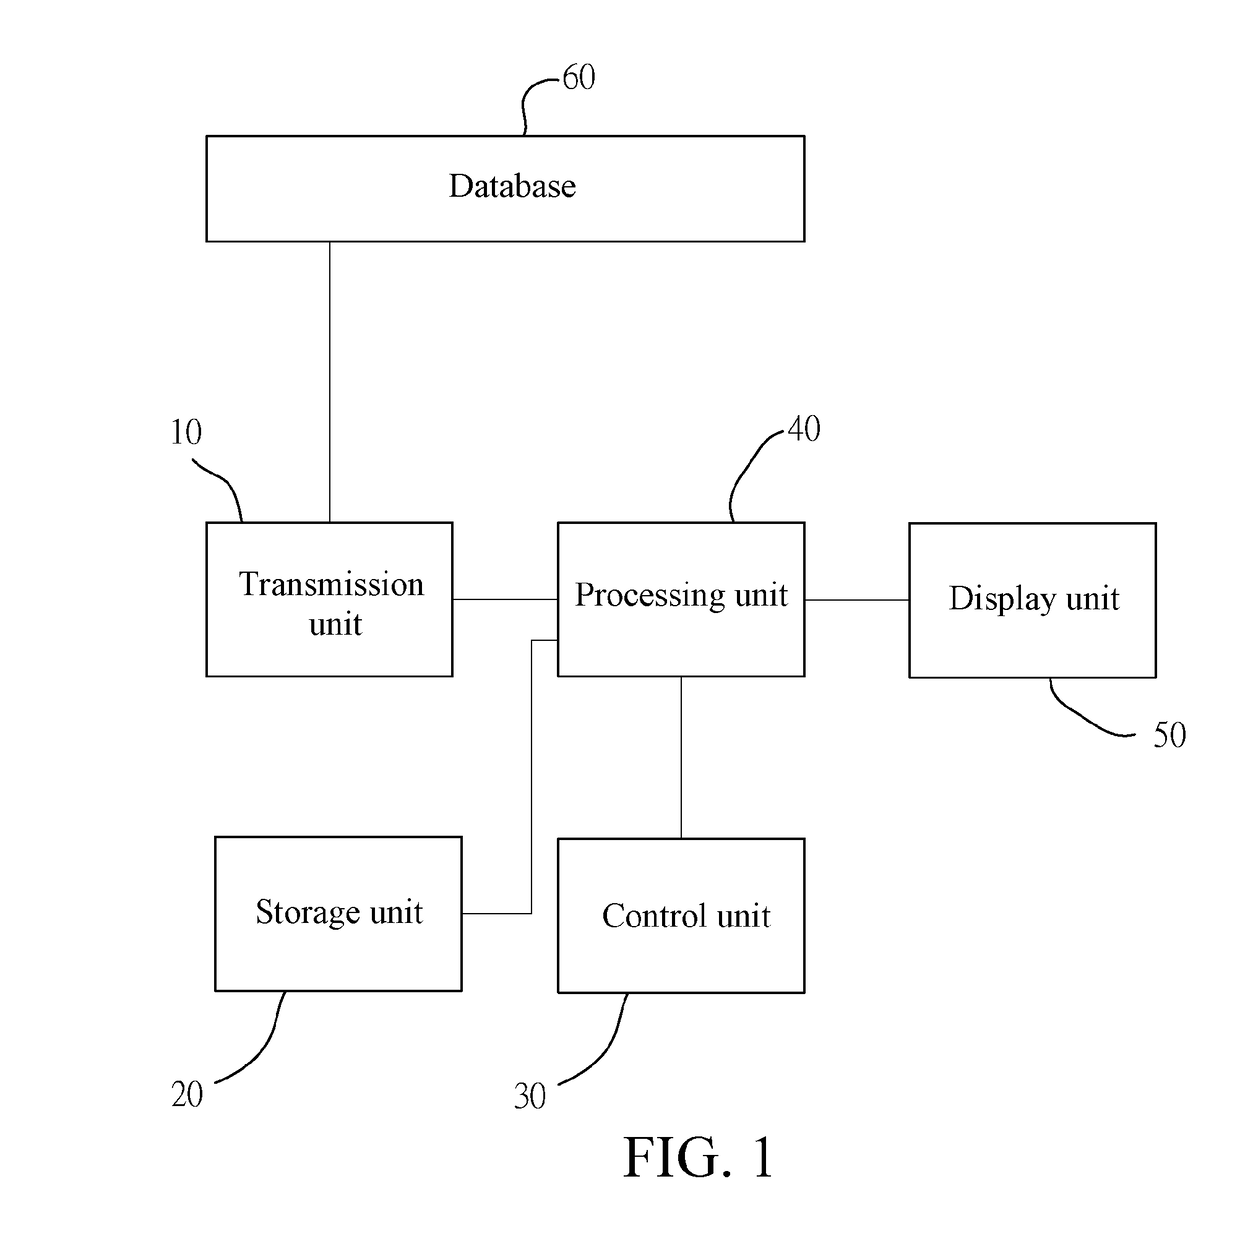
[0036]In a first embodiment, the researcher is intended to research whether occupational exposure to styrene increases a risk of developing leukemia. First, 70,000 employees in 1,000 small and mid-size entities in 1990 to 2012 as research objects (to-be-analyzed data) are already stored in the database 60. Therefore, the researcher (that is, the user) can operate the control unit 30 to select the first research approach, and select the first parameter as whether an employee is occupationally exposed to styrene, and select the second parameter as whether an employee is a patient with leukemia (that is, step S01).

TABLE 1Relative secondSecond parameterparameter (no(leukemia)leukemia)TotalFirst parameter12029,88030,000(occupational exposureto styrene)Relative first parameter8039,92040,000(no occupationalexposure to styrene)Total20069,80070,000

[0037]Table 1 is a statistical table of the first research approach in the first embodiment. Referring to Table 1, the processing unit 40 receives...

second embodiment

[0064]Table 10 is a descriptive and inferential statistical table corresponding to the second research approach in the The processing unit 40 separately performs analysis according to a test algorithm, to obtain statistical tests that separately correspond to the second parameter and that are in the first research data and the second research data. That is, based on the statistical tests obtained by the processing unit 40 by performing analysis and calculation by using the test algorithm, relevance between the first research data and the second research data corresponding to the second parameter can be derived.

TABLE 10Case number (%)Case studyControl groupgroup(no(leukemia)leukemia)p-Item(n = 200)(n = 500)valueGenderMale99(49.5)200 (40.0)0.11 aFemale101(50.5)300 (60.0)Age42.51 ± 8.6338.38 ± 10.550.04 bM ± SDHabit ofYes95(47.5)230 (46.0)0.03 acigaretteNo105(52.5)270 (54.0)smokingHabit ofGroup of high90(45.0)180 (36.0)0.09 aalcoholalcoholdrinkingconsumptionGroup of low110(55.0)320 (6...

third embodiment

[0072]Table 12 is a statistical table related to the third research data in the third research approach in the Referring to Table 12, in the third research data, during observation for 23 years (a research period starts from 1990, and tracking is performed until 2012), if a research case is diagnosed with leukemia, it is considered that an event occurs; otherwise, if the disease is not detected until the end of 2012, it is considered that an event does not occur.

TABLE 12Case studyControlgroupgroupPerson-(leukemia)(no leukemia)TotalyearExposure to styrene13022035020,000(occupationalexposure tostyrene)No exposure to styrene7028035022,000(no occupationalexposure tostyrene)Total20050070042,000

[0073]According to the third research data, the processing unit 40 can obtain through calculation according to a statistical algorithm (such as the occurrence rate algorithm) that a leukemia occurrence rate=(200 / 700)×1000% o=285.71‰ (that is, step S03), indicating that among every thousand persons...


PUM


Abstract

A data analysis system includes: a transmission unit receiving research data; a storage unit saving the research data; a control unit generating a research approach, a first parameter, and a second parameter according to an operation instruction; a processing unit obtains research data from to-be-analyzed data by using the transmission unit according to the research approach, and the parameters; the processing unit analyzes the parameters and the research data by using a statistical algorithm, to generate statistical information; and then analyzes the related first parameter, second parameter, and various pieces of research data according to a test algorithm, to generate a statistical test; and a display unit, connected to the processing unit and used to display integration information, where the integration information is obtained by the processing unit by integrating the related first parameter, second parameter, statistical information, and statistical test according to an integration algorithm.

Description

CROSS-REFERENCE TO RELATED APPLICATION[0001]This non-provisional application claims priority under 35 U.S.C. § 119(a) to Patent Application No. 201710312459.9 filed in China, P.R.C. on May 5, 2017, the entire contents of which are hereby incorporated by reference.BACKGROUNDTechnical Field[0002]The present invention relates to a data analysis system, and in particular, to a data analysis system capable of exploring relevance between events in data.Related Art[0003]In recent years, an issue of big data (big data) is often mentioned, and big data refers to information that involves a huge amount of data and cannot be manually acquired, managed, processed, and arranged within a proper time in a form that can be interpreted by human beings. Therefore, how to process big data and analyze and research the big data and then arrange the big data into information that can be rapidly understood by human beings is a very important subject.[0004]There are multiple analysis methods for big data a...

Claims


Application Information

Patent Timeline
IPC IPC(8): G06F17/18G06F17/30G16H50/70G06N7/00
CPCG06F17/18G06F17/30994G16H50/70G06N7/00G06F17/30964G06F2216/03G06F16/26G06F16/2465G16H50/30G06F16/903G06F16/904
Inventor ZHANG, HAN-WEI
Owner ZHANG HAN WEI
Features
  • Generate Ideas
  • Intellectual Property
  • Life Sciences
  • Materials
  • Tech Scout
  • Unparalleled Data Quality
  • Higher Quality Content
  • 60% Fewer Hallucinations
Learn More