Coated bite-sized snacks
a technology of bite-sized snacks and coatings, which is applied in the field of coatings and bite-sized snacks, can solve the problems that convenience foods can also be disappointing to a consumer
- Summary
- Abstract
- Description
- Claims
- Application Information
AI Technical Summary
Benefits of technology
Problems solved by technology
Method used
Image
Examples
example 1
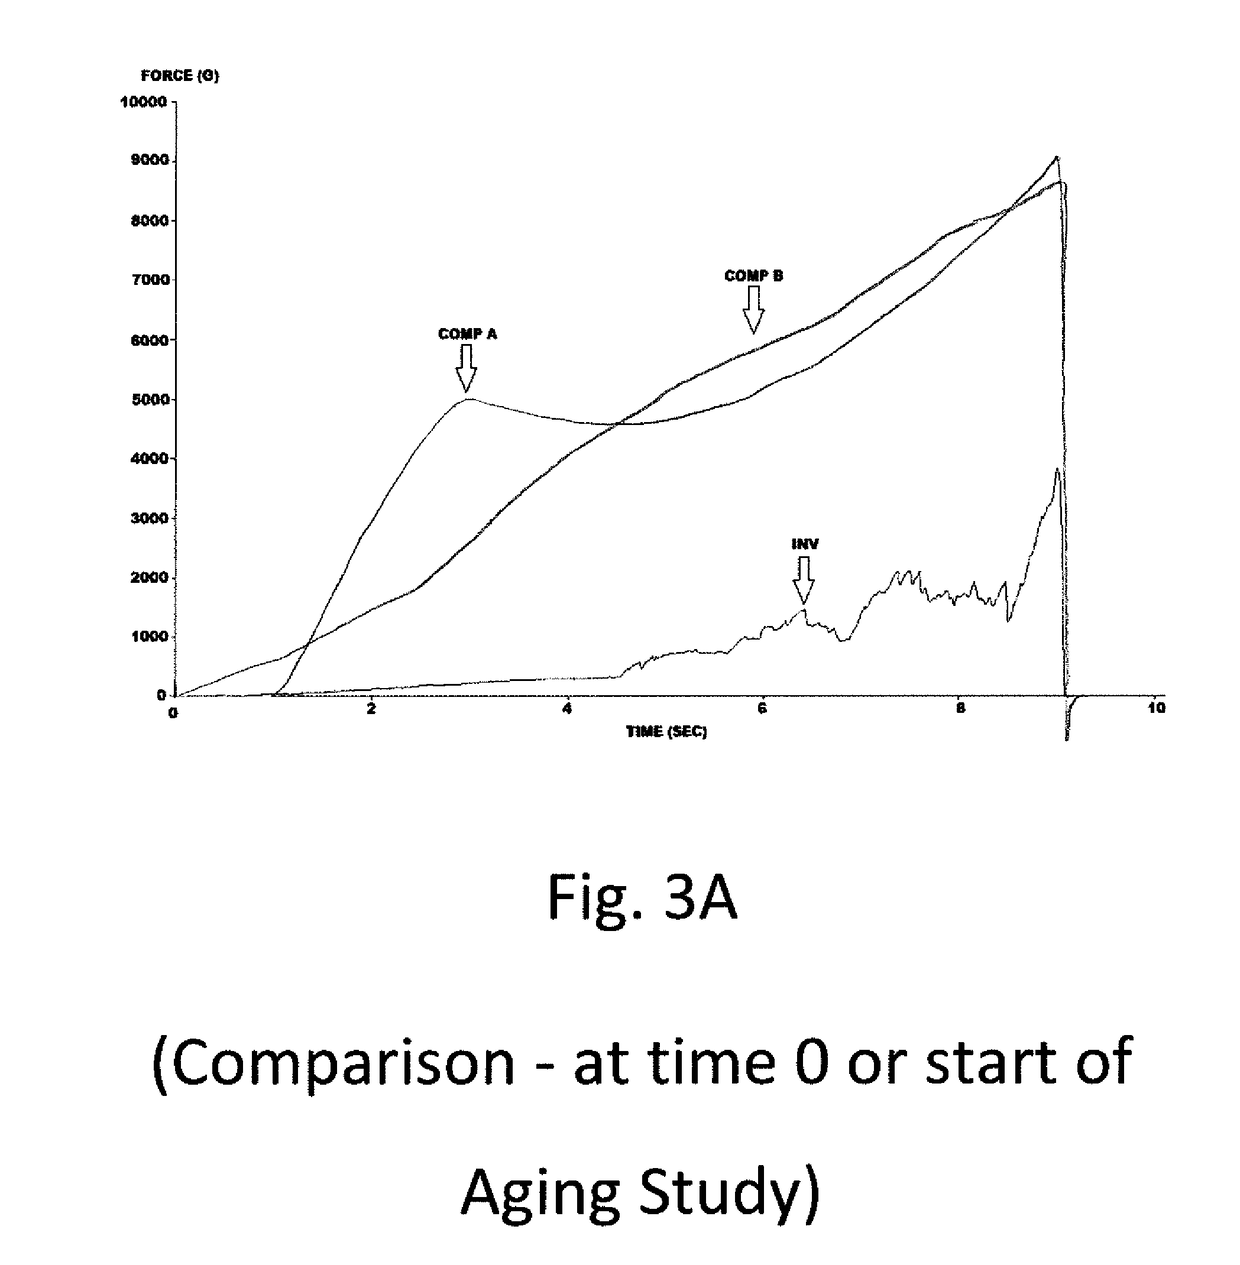
[0091]The inventive samples and comparative samples were tested using a TA-XTplus Texture Analyzer with a 10 kg load cell, using the 1.1 inch diameter crunchiness fixture from the TA-25C set. Compression tests were run at a test speed of 1.00 mm / sec to a depth of 9 mm into each test sample. At least 3 replicates of each inventive and comparative sample were analyzed. FIG. 3 shows a representative plot of the force versus time curves generated for each sample at time zero or the start of the aging study. The results are shown in Table 1.
TABLE 1Texture Analysis, Fresh SamplesINVCOMP ACOMP BAvg. Peak Force (g)319384539183Avg. Positive Area (g*s)85063729141984Avg. Crunchiness46135(No. of Peaks)
[0092]As can be seen, the inventive INV sample had a substantially lower peak force and positive area, when compared to the COMP A and COMP B comparative samples. These values, which reflect the biting force and work required to chew each sample bite, show that the inventive sample is much softer ...
example 2-5
[0093]The inventive sample and comparative samples were also tested after aging for 4-weeks at a series of different elevated (i.e., above ambient) temperatures. The inventive samples in the accelerated aging studies were also tested using a TA-XTplus Texture Analyzer with a 10 kg load cell, using the 1.1 inch diameter crunchiness fixture from the TA-25C set. Compression tests were run at a test speed of 1.00 mm / sec to a depth of 9 mm into each test sample. Again, at least 3 replicates of each inventive and comparative sample were analyzed. FIGS. 3B-E shows representative plots of the force versus time curves generated for each sample after aging for 4-weeks at the elevated temperatures of 70, 90, 100, and 120° F. The results are shown in Tables 2-5. The TA.XTPlus texture analyzer is equipped with a 10 kg (10000 g) load cell, but the instrument continues to perform analysis until a peak positive force of 13425 g is reached. Once 13425 g peak positive force is reached the instrument ...
example 6-8
[0094]The inventive samples and the two comparative samples were tested for oil loss, moisture loss, and total weight loss, as described above. At least 3 replicates of each inventive and comparative sample was analyzed. The test samples were stored at four testing temperatures: 70° F. (21° C.), 90° F. (32° C.), 100° F. (38° C.), and 120° F. (49° C.). After four weeks, the average cumulative oil loss, moisture loss, and average cumulative total weight loss for each group of samples were compared.
[0095]The graph of the cumulative oil loss, shown in FIGS. 6A-D, shows that the INV lost oil comprising about 1.23 to 4.39% of the sample weight at temperature ranges from 70° F. (21° C.)-120° F. (49° C.) over a 4 week aging study, which is lower than COMP A lost. While the INV samples did not lose less oil than Comp B, it is generally comparable up to a temperature of 100 F. More specifically: at 70° F. (21° C.) INV lost about1.34% of oil, whereas COMP A lost about 0.69% oil and COMP B lost...
PUM
 Abstract
Description
Claims
Application Information
 - R&D
- Intellectual Property
- Life Sciences
- Materials
- Tech Scout
- Unparalleled Data Quality
- Higher Quality Content
- 60% Fewer Hallucinations
Browse by: Latest US Patents, China's latest patents, Technical Efficacy Thesaurus, Application Domain, Technology Topic, Popular Technical Reports.
© 2025 PatSnap. All rights reserved.Legal|Privacy policy|Modern Slavery Act Transparency Statement|Sitemap|About US| Contact US: help@patsnap.com


