Method for selecting leading associated parameter and method for combining critical parameter and leading associated parameter for equipment prognostics and health management

Inactive Publication Date: 2019-06-27
MARKETECH INT
3 Cites 6 Cited by

AI-Extracted Technical Summary

Problems solved by technology

For example, when an abnormality such as bearing damage and short circuitry occurs in equipment, it is frequent that the temperature of the equipment rises abnormally.
However, there are damages that are too minute to be detectable by a device, and a failure has often already taken place when an abnormality is detected.
In a...

Benefits of technology

[0015]In the method for selecting a leading associated parameter provided by the present invention, the leading associated parameter is, from all associated parameters, a factor before the critical parameter and reacting earliest in time to the critical parameter. Thus, by using the combinatio...

Abstract

The present invention provides a method for selecting a leading associated parameter. Selection is performed on data collected by a sensor, and the data is divided into a critical parameter set and another feature parameter set. From the feature parameter set, one parameter that affects beforehand in time the critical parameter is identified as a leading associated parameter. The present invention further uses the critical parameter set and the leading associated parameter to construct an equipment prognostic and health management model that effectively enhances an early warning capability.

Application Domain

Programme controlData processing applications +5

Technology Topic

Critical parameterPrognostics +3

Image

  • Method for selecting leading associated parameter and method for combining critical parameter and leading associated parameter for equipment prognostics and  health management
  • Method for selecting leading associated parameter and method for combining critical parameter and leading associated parameter for equipment prognostics and  health management
  • Method for selecting leading associated parameter and method for combining critical parameter and leading associated parameter for equipment prognostics and  health management

Examples

  • Experimental program(1)

Example

[0019]Details and technical contents of the present invention are given with the accompanying drawings below.
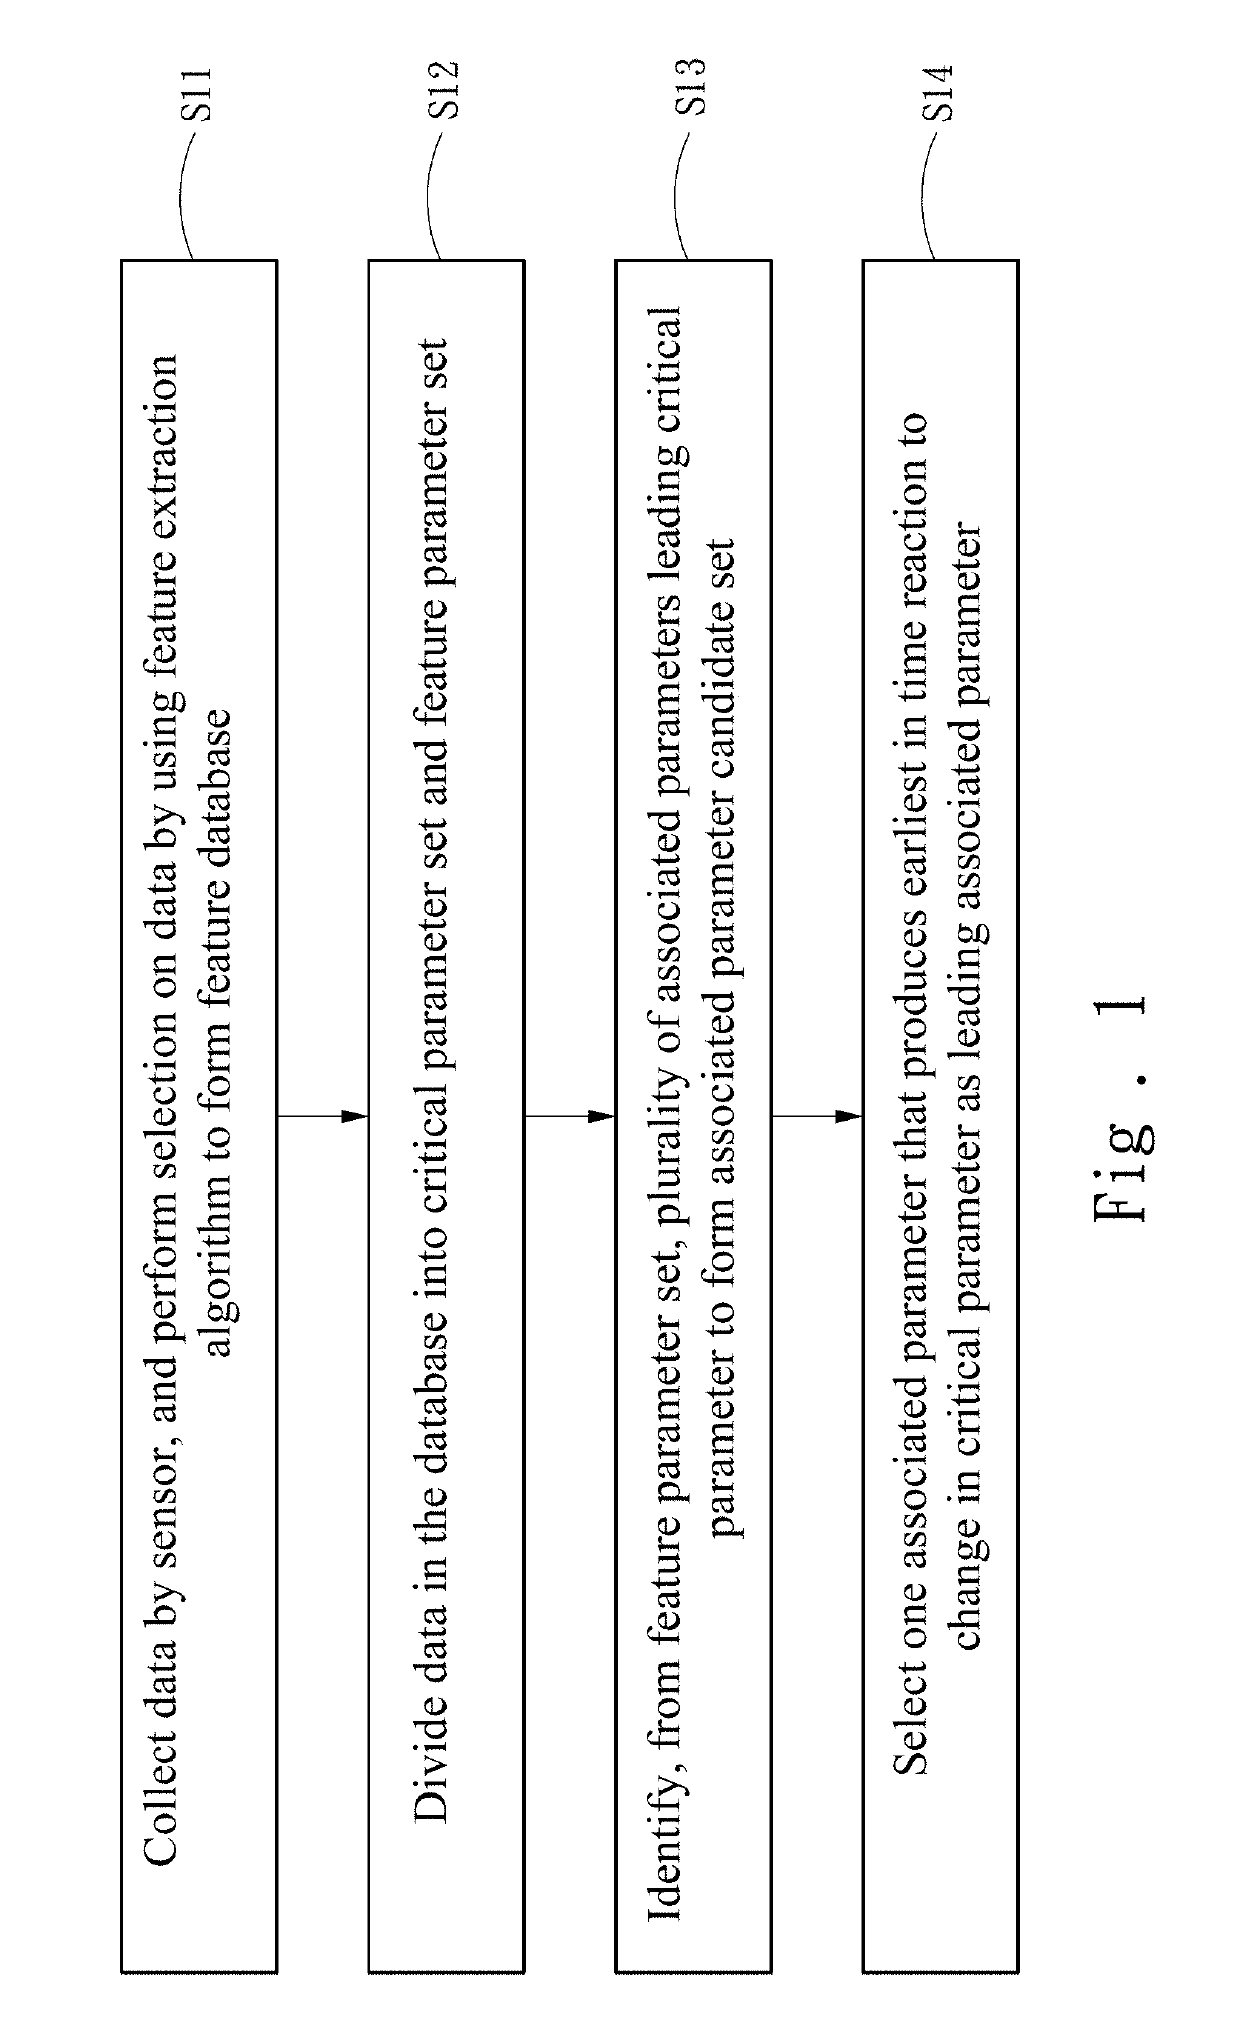
[0020]Referring to FIG. 1, according to an embodiment of the present invention, a method for selecting a leading associated parameter includes steps (S11) to (S14) below. The leading associated parameter is associated with an operation output from an operating system, a hardware device or a machine.
[0021]Along with the development of the Internet of Things (IoT), most new-model devices including an operating system, a hardware device or a machine are capable of executing a real-time data outputting function through a sensor provided therein. Accordingly, a large amount of sensor data is collected, and may be stored in, e.g., a memory including a database.
[0022]Thus, in step (S11), data pre-processing may be performed, by a processor, on the sensor data stored in the database. That is, in the sensor data, incorrect data is removed and missing data is filled, and data frequencies of the sensor data are aligned, so as to accordingly convert the sensor data to feature data that can be used by a statistical model.
[0023]Selection is performed on the feature data by using a feature extraction algorithm. In this embodiment, the feature extraction algorithm includes two parts, statistical features and compound features. The statistical features include, for example but not limited to, a maximum value, a minimum value, an average value, a variance, a kurtosis, a skewness, a median value, a range, a mode value, an initial value, an ending value, a data difference level, or any combination of the above statistical features. The compound features include a composite feature created from, for example but not limited to, a principal component analysis, an independent component analysis, a neural network, or any combination of the above models. The feature data selected by the above feature extraction algorithm is collected to form a feature database.
[0024]In step (S12), the data in the feature database is divided into two sets, which are a critical parameter set and a feature parameter set. The critical parameter set includes at least one critical parameter. Means for selecting the “critical parameter” may be comparing a selection reference on the basis of a “critical parameter” defined by a field domain expert or any conventional mathematical models (e.g., a correlation model), or may be a factor conventionally most correlated with the equipment failure. Parameters other than the critical parameter are categorized to the feature parameter set.
[0025]In step (S13), a plurality of associated parameters leading the critical parameter are identified from the feature parameter set by using a causality algorithm. In this embodiment, the selection for the associated parameters is performed by using a Granger causality test, with a process as below.
[0026]First of all, it is assumed that the critical parameter (CP) and a selected associated parameter (AP) are a stationary times series, and a null hypothesis is “the associated parameter is not a Granger cause of the critical parameter”.
[0027]Next, an autoregressive (AR) model of the critical parameter is constructed, as equation (1) below:
CPt=CPt-1+ . . . +CPt-m+errort (1)
[0028]In equation (1), CPt represents a value of the critical parameter observed at a time point. According to an F-test, if the explanatory power of the autoregressive model is increased after adding a lag period of CPt, the lag period is preserved in the model. Further, in equation (1), m represents one among lag periods of the critical parameter that is tested as apparently being the earliest in time, and errort represents an estimated error.
[0029]By adding the lag period of the associated parameter, a model is constructed according to equation (2) below:
CPt=CPt-1+ . . . +CPt-m+APt-p+APt-p-1+ . . . +APt-q+errort (2)
[0030]Similarly, according to an F-test, if the explanatory power of the autoregressive model is increased after adding a lag period of the associated parameter, the lag period is preserved in the model. In equation (2), p represents one among the lag periods of the associated parameter that is tested as apparently being the earliest in time, and q represents one among the lag periods of the associated parameter that is tested as significantly being the closest in time.
[0031]If no lag periods of any associated parameter are preserved in the model, the null hypothesis of no Granger causality holds true.
[0032]If a causality exists between the associated parameter and the critical parameter, the associated parameter is incorporated into an associated parameter candidate set.
[0033]In step (S14), an F-test is performed again on all of the associated parameters in the associated parameter candidate set by using the two models (equations (3) and (4)) below, so as to determine how much earlier the associated parameter is able to produce a reaction to a change in the critical parameter. Compared to equation (4), equation (3) additionally contains data APt-q of one period. Thus, by comparing results of equation (3) and equation (4), it can be determined whether the data of the additional period is different. If so, it means that the data of the additional period is usable data.
CPt=CPt-1+ . . . +CPt-m+APt-p+APt-2+ . . . +APt-(q-1)+APt-q+errort (3)
CPt=CPt-1+ . . . +CPt-m+APt-p+APt-2+ . . . +APt-(q-1)+errort (4)
[0034]The associated parameter that reacts earliest in time to the change in the critical parameter is selected as a leading associated parameter.
[0035]With the above method, a leading associated parameter can be selected. If the leading associated parameter is further combined with the critical parameter set, an equipment prognostic and health management model effectively enhancing an early warning capability can be constructed. Therefore, a method for equipment PHM is further provided according to an embodiment of the present invention. The equipment may be an operating system, a hardware device or a machine. Referring to FIG. 2, the method for equipment PHM includes steps of:
[0036](S21) collecting a plurality of sets of data by at least one sensor, and performing selection on the data by using a feature extraction algorithm to form a feature database;
[0037](S22) identifying, from the feature database, a leading associated parameter that produces beforehand a reaction to a change in a critical parameter; and
[0038](S23) constructing an equipment prognostic and health management model based on the critical parameter and the leading associated parameter.
[0039]In step S21, the data collected by the sensor provided in the equipment needs to be converted to feature data by a first processor. Further, in one embodiment, the feature data may be stored in a memory to form a feature database. In step S22, from the feature database, a leading associated parameter that produces beforehand a reaction to a change in a critical parameter may be identified by a second processor. Details of identifying the leading associated parameter are given in the above description, and shall be omitted herein. In step S23, the equipment prognostic and health management model may be constructed by a third processor, by using, e.g., a regression model or an autoregressive integrated moving average module (ARIMA). However, a characteristic of the present invention is combining the critical parameter and the leading associated parameter that produces beforehand a reaction to a change in the critical parameter, and the model is a tool for analysis. Therefore, any appropriate model is applicable to the present invention, and the type of model applied is not limited.
[0040]It should be noted that, the first processor for identifying the critical parameter in step S21, the second processor for converting the collected data to the feature data in step S22, and the third processor for constructing the equipment prognostic and health management model in step S23 may be independent and identical processors or independent and different processors.
[0041]For better understanding, a dry pump is given as an example for further illustration.
[0042]The dry pump provides sensor data such as a booster pump speed (BP_Speed), a booster pump power (BP_Power), a master pump power (MP_Power), a master pump temperature (MP_Temperature), and nitrogen flow (N2_Flow). A user may determine a health status of the dry pump by frequently observing the temperature of the dry pump. An abnormally high temperature may be a signal of a potential failure of the dry pump, and thus “temperature” may be defined as a critical parameter. In the prior art, a failure predictive model for the dry pump is commonly constructed also based on the parameter “temperature”.
[0043]In this embodiment, the sensor data is first collected to a database, and converted to feature data by data pre-processing.
[0044]A time interval for calculating the parameter feature is designated. Within this interval, for each set of feature data, thirteen statistical features, including a maximum value, a minimum value, an average value, an median value, a range, a standard deviation, a mode value, an initial value, an ending value, a kurtosis, a skewness, and histogram distance (which may be “a difference from the histogram of first time interval” and “a difference from a histogram of previous time interval), are calculated.
[0045]In the same time interval, multiple compound features are calculated based on all of the parameters. For example, a first principal component is generated after performing a principal component analysis (PCA) and an independent component analysis (ICA), and a feature representing the time interval can be identified by using a neural network (NN), so as to generate three compound features. In this embodiment, four parameters including the booster pump speed (BP_Speed), the booster pump power (BP_Power), the master pump power (MP_Power), and nitrogen flow (N2_Flow) are used to generate 52 statistical features and three compound features, providing a total of 55 features to form a feature database.
[0046]Next, the feature that is most correlated with the critical parameter in the time interval is selected, i.e., the average value of the master pump power (MP_Power), the standard deviation of the master pump power (MP_power), and the histogram distance of the master pump power (MP_Power) from the first time interval. By using the Granger causality test, it is calculated that, in this time interval, the three features including the average value of the master pump power (MP_Power), the standard deviation of the master pump power (MP_power) and the difference of the master pump power (MP_Power) from the first time interval can lead the average values of the critical value respectively by periods of 7 hours, 1 hour and 5 hours. Thus, the average value of the associated parameter, i.e., the master pump power (MP_Power), which produces earliest in time a reaction to a change in the critical parameter is selected as the leading associated parameter (LAP).
[0047]After the leading associated parameter is selected, the leading associated parameter is combined with the critical parameter to construct an equipment health indicator model. Referring to FIG. 3, using one hour as the time interval, respective histogram distance of the critical parameter and the leading associated parameter from the first hour are calculated.
[0048]It is seen from FIG. 3 that, the model constructed on the basis of the leading associated parameter is capable of discovering an abnormality in the dry pump earlier in time than the model constructed on the basis of the critical parameter. For example, when the critical parameter becomes abnormal at the 537th hour of operation of the dry pump, the level rises from 0 to 0.94 at the 547th hour. However, the abnormality level of the leading associated parameter starts rising gradually from 0.1 as early as the 434th hour. Further, in a situation of a sudden abnormality, the leading associated parameter also reacts earlier in time than the critical parameter. For example, the abnormality level of the critical parameter rises rapidly from 0 to 1 between the 254th hour to the 259th hour of operation, whereas the abnormality level of the leading associated parameter starts rising rapidly from 0.02 to 0.82 between the 251st hour to the 256th hour.
[0049]It is demonstrated by the above embodiments that, compared to an equipment prognostic and health management model constructed solely based on the critical parameter, if the leading associated parameter is added to the construction of the model, the early warning capability of the model can be effectively enhanced.

PUM

no PUM

Description & Claims & Application Information

We can also present the details of the Description, Claims and Application information to help users get a comprehensive understanding of the technical details of the patent, such as background art, summary of invention, brief description of drawings, description of embodiments, and other original content. On the other hand, users can also determine the specific scope of protection of the technology through the list of claims; as well as understand the changes in the life cycle of the technology with the presentation of the patent timeline. Login to view more.

Similar technology patents

Stablization of oxidation-sensitive or UV-sensitive active ingredients

ActiveUS7214365B2good sensory and cosmetic propertygood effectiveness
Owner:BEIERSDORF AG

System and Methods for Geographically-Driven Downstream Distribution of Mobile Content

InactiveUS20140164125A1good effectivenessmore time
Owner:CONTAINER MEDIA

Halogen-substituted phenoxyphenylamidines and the use thereof as fungicides

ActiveUS10506807B2good effectiveness
Owner:SYNGENTA PARTICIATIONS AG

Classification and recommendation of technical efficacy words

  • good effectiveness

System and Methods for Geographically-Driven Downstream Distribution of Mobile Content

InactiveUS20140164125A1good effectivenessmore time
Owner:CONTAINER MEDIA

Stablization of oxidation-sensitive or UV-sensitive active ingredients

ActiveUS7214365B2good sensory and cosmetic propertygood effectiveness
Owner:BEIERSDORF AG

Halogen-substituted phenoxyphenylamidines and the use thereof as fungicides

ActiveUS10506807B2good effectiveness
Owner:SYNGENTA PARTICIATIONS AG
Why Eureka
Try Eureka