System Event Analyzer and Outlier Visualization

an event analyzer and system technology, applied in the field of system event analysis, can solve the problems of affecting the revenue and reputation of a company, affecting the detection of outliers, and affecting the timely detection of outliers, so as to increase the weight of alert levels, increase or decrease the notification threshold, and reduce the notification threshold

Active Publication Date: 2019-07-18
UBER TECH INC
View PDF0 Cites 5 Cited by
  • Summary
  • Abstract
  • Description
  • Claims
  • Application Information

AI Technical Summary

Benefits of technology

[0007]Using the alert threshold values, a set of subject events is compared against the alert threshold values to determine an alert level for the event type. The alert level identifies whether the event data for the event is within a normal range for the event type based on the alert threshold values, or whether the event data is above or below a normal range. The alert levels may be analyzed to determine whether to alert an operator to outliers in the event data, particularly when those outliers may represent a system outage or other severe problem. To analyze the separate events, the alert levels are analyzed to determine a system health score. The system health score summarizes the alert levels from the various events, and may increase the weight of alert levels for events that are highly correlated with other events, and when the highly-correlated events also show an alert. The system health score may be compared against a notification threshold to determine whether to alert an operator to the status of the system. In one embodiment, the threshold is adjusted based on asynchronous actions that may affect the events, which may increase or decrease the notification threshold. For example, known updates to the system's software may decrease the notification threshold to increase the sensitivity to outliers and ensure there were no problems with the software update.
[0008]Using the identified alert levels for the variety of event types, a display is generated to indicate the alert levels for the various event types, indicating for each event type whether it is above or below the threshold by a glance. In the display, the event types are clustered according to the correlation between the event data for the event types. When the correlation exceeds a threshold, a link may be generated between the event types to indicate a correlation to a user viewing the display. The event types and the related alert levels are displayed to the user along with the generated link. This permits a user to determine at a glance what event types are outliers from the data and permit investigation of the related event types to investigate possible sources of the outlying data.
[0009]In these ways, the generated alert levels assist detection of outliers in the event data, while that data is analyzed to determine a notification and may be visualized to assist in analysis and identification of a root cause.

Problems solved by technology

When problems develop with these systems, these problems can greatly impact the revenue and reputation of a company.
These underlying problems may present themselves in the underlying data stream, but are challenging to identify, making timely detection difficult and delaying an appropriate investigation and response.
Typically, the large data size of a continuous data stream prohibits disk storage, the large data volume influx prohibits passing over the data more than once, the continuous nature of streaming data results in an unbounded time series, and streaming data often evolves over time.
In addition, outliers may be caused by many reasons, only some of which may represent a problem with the monitored systems.
Without a thorough analysis of these outliers, there is a risk of over or under reporting outliers that are not related to system outages.

Method used


Image

  • System Event Analyzer and Outlier Visualization
  • System Event Analyzer and Outlier Visualization
  • System Event Analyzer and Outlier Visualization

Examples


Embodiment Construction

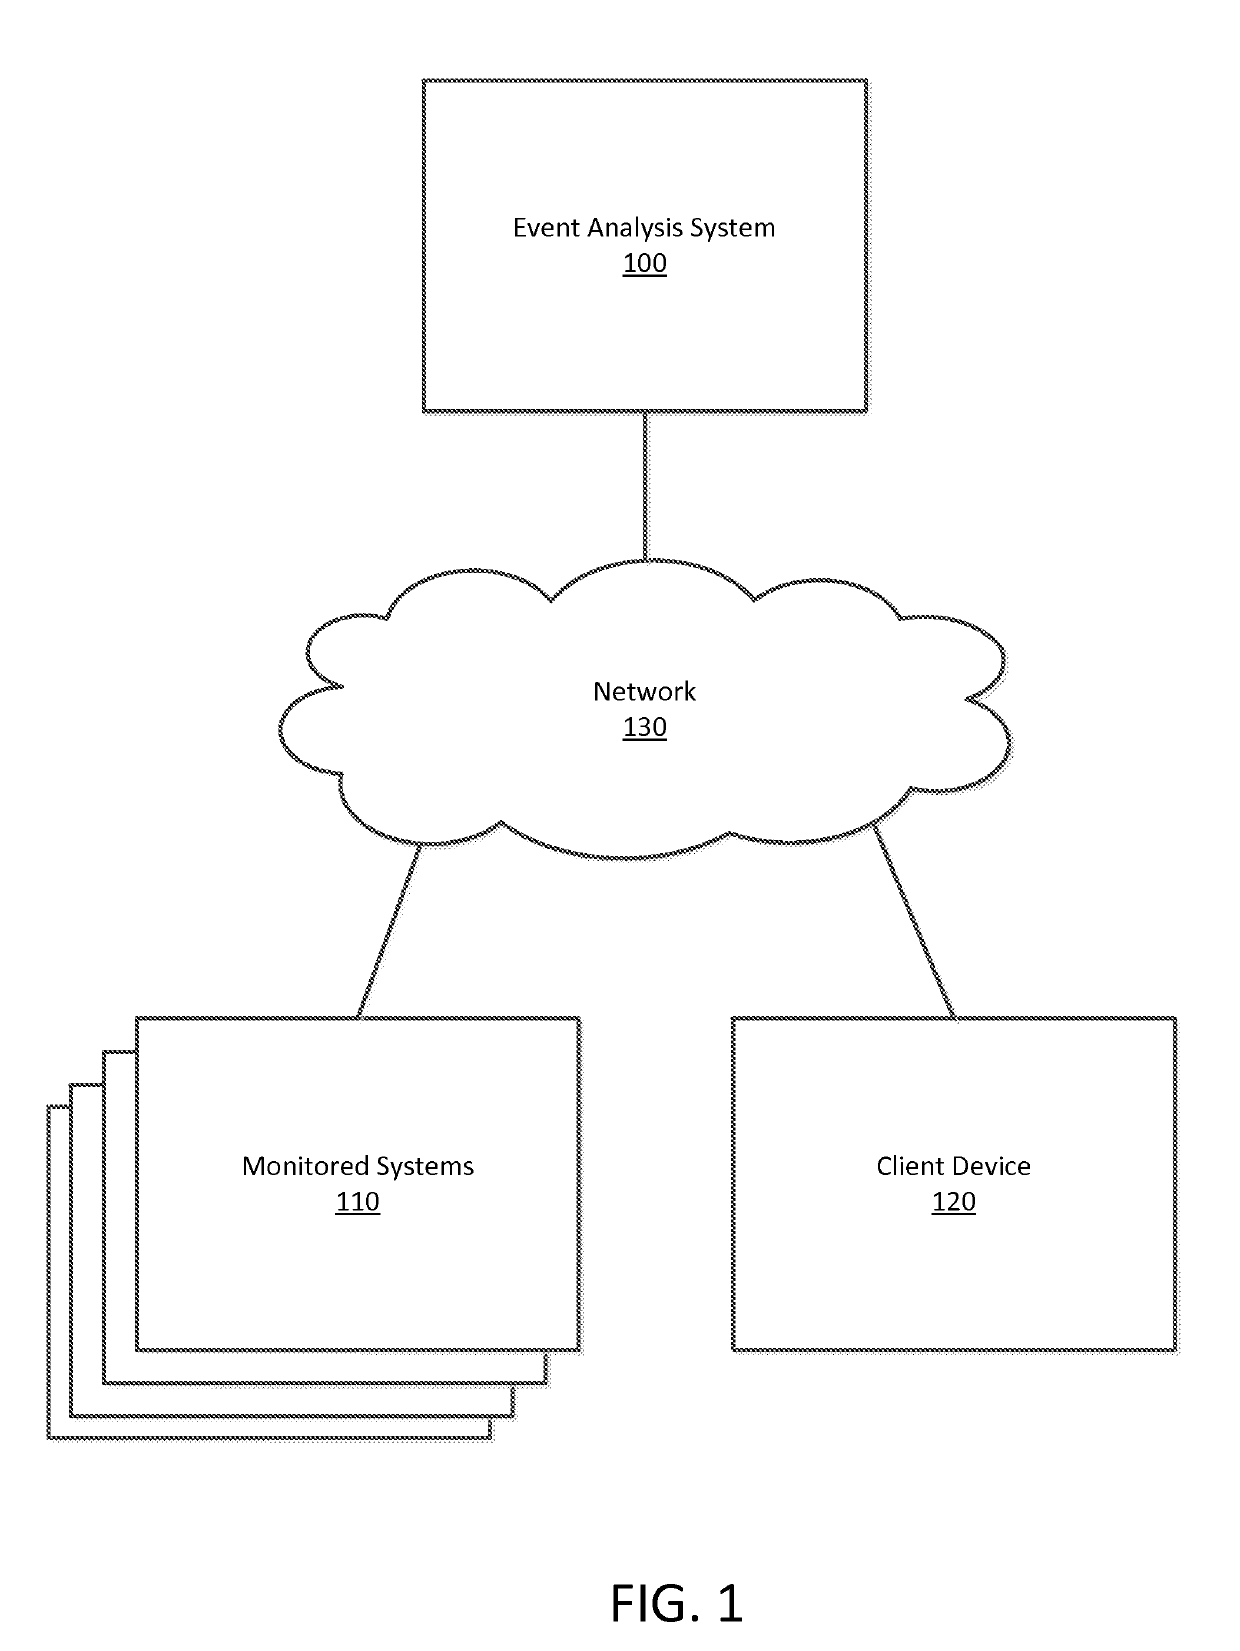
[0016]FIG. 1 shows an environment in which an event analysis system 100 operates, according to one embodiment. In this example, the event analysis system 100 receives event data from one or more monitored systems 110 and provides event analysis and outlier detection information to client device 120. These systems may be connected via a network 130, such as the internet, or another transmission channel for communication between these systems.

[0017]Monitored systems 110 provide streams of event data to the event analysis system 100 and are typically computing devices that report data regarding actions or status of the monitored system. The events generated by the monitored systems 110 can include asynchronously-generated events (e.g., those that occur on a user action), and may include reporting monitored data that is polled at specified time periods, such as CPU or memory utilization levels that are monitored and reported at a particular frequency.

[0018]According to some examples, su...


PUM


Abstract

An event analysis system receives events in a time-series from a set of monitored systems and identifies a set of alert threshold values for each of the types of events to identify outliers in the time-series at an evaluated time. Portions of historic event data is selected to identify windows of event data near the evaluated time at a set of seasonally-adjusted times to predict the value of the event type. The alert threshold value may also account for a prediction based on recent, higher-frequency events. Using the alert threshold values for a plurality of event types, the event data is compared with the alert threshold values to determine an alert level for the data. The event data types are also clustered and displayed with the alert levels to provide a visualization of the event data and identify outliers when the new event data is received.

Description

CROSS REFERENCE TO RELATED APPLICATIONS[0001]This application is a continuation of co-pending U.S. application Ser. No. 14 / 847,656, filed Sep. 8, 2015, which is incorporated by reference in its entirety.BACKGROUND[0002]This invention relates generally to analysis of events in a system, and more particularly to automated identification and visualization of event outliers and outage detection.[0003]Many different types of systems generate data streams that provide near-continuous event data describing events occurring on the systems. Examples include network monitoring, click streams, web server log records, packet flow data of internet providers, phone logs, sensor data streams, traffic monitoring, credit card transactions, financial tickers, video surveillance, and power usage. When problems develop with these systems, these problems can greatly impact the revenue and reputation of a company. These underlying problems may present themselves in the underlying data stream, but are cha...

Claims


Application Information

Patent Timeline
Patent Type & Authority Applications(United States)
IPC IPC(8): H04L12/26H04L12/24
CPCH04L43/16H04L41/064H04L41/069H04L41/0622
Inventor BELL, FRANZISKAPURDY, DAVIDKORSOS, LASZLOHE, SHAN
Owner UBER TECH INC
Why Eureka
Try Eureka