Method for obtaining conversion relationship between dynamic and static elastic parameters

Active Publication Date: 2019-08-29
PETROCHINA CO LTD
0 Cites 2 Cited by

AI-Extracted Technical Summary

Problems solved by technology

Dense reservoirs with low-permeability are becoming the focus and challenging field in oil and gas exploration.
Static elastic parameters are significant guidance for oil and gas formation fracturing transformation, but cannot be continuously applied downhole since they can only be obtained through measurements in laboratories.
The obvious deficiency present in the prior art lies in that the influence of continuous changes of formation stress and lithology possibly occurring in the same geologi...

Benefits of technology

[0040]The advantageous effects of the present invention are as follows:
[0041]1) in the technical solution provided by the invention, the dynamic and the static elastic parameters and the clay contents of the horizontal cores at different depths in the reservoir under different formation pressures are measured, and a functional relationship of the ratio between the dynamic and static elastic parameters with the formation pressure and clay content is established on the basis of the measurements results, and a conversion rule between the dynamic and static elast...

Abstract

A method for obtaining a conversion relationship between dynamic and static elastic parameters includes: Step S1, acquiring horizontal cores at different depths of the destination formation; Step S2, measuring the dynamic elastic parameters of the horizontal core under different pressures; Step S3, measuring the static elastic parameters of the horizontal core under different pressures; Step S4, measuring the clay content of the horizontal core; Step S5 establishing a function relationship of the ratio between the dynamic and static elastic parameters with the formation pressure and clay content; and completing the conversion between the dynamic and static elastic parameters. The technical solution provided by the present invention takes full account of the influence of the formation stress and the clay content on the conversion rule of dynamic and static elastic parameters and is of great significance for improving the logging evaluation accuracy of rock mechanical parameters.

Application Domain

Technology Topic

Petroleum engineeringRock mechanics

Image

  • Method for obtaining conversion relationship between dynamic and static elastic parameters
  • Method for obtaining conversion relationship between dynamic and static elastic parameters
  • Method for obtaining conversion relationship between dynamic and static elastic parameters

Examples

  • Experimental program(1)

Example

DESCRIPTION OF THE KEY REFERENCE NUMBERS IN THE DRAWINGS
[0049]1. displacement meter; 2: first probe; 3: second probe; 4. measuring tube; 5. pore fluid control unit; 6: temperature control unit; 7: confining pressure control unit; 8: data acquisition and analysis unit.
DETAILED DESCRIPTION OF THE INVENTION
[0050]For better understanding of the technical features, objects and advantageous effects of the present invention, the technical solutions of the present invention are now described in details below, which cannot be construed as limiting to the scope of the embodiments of the present invention.
EXAMPLES
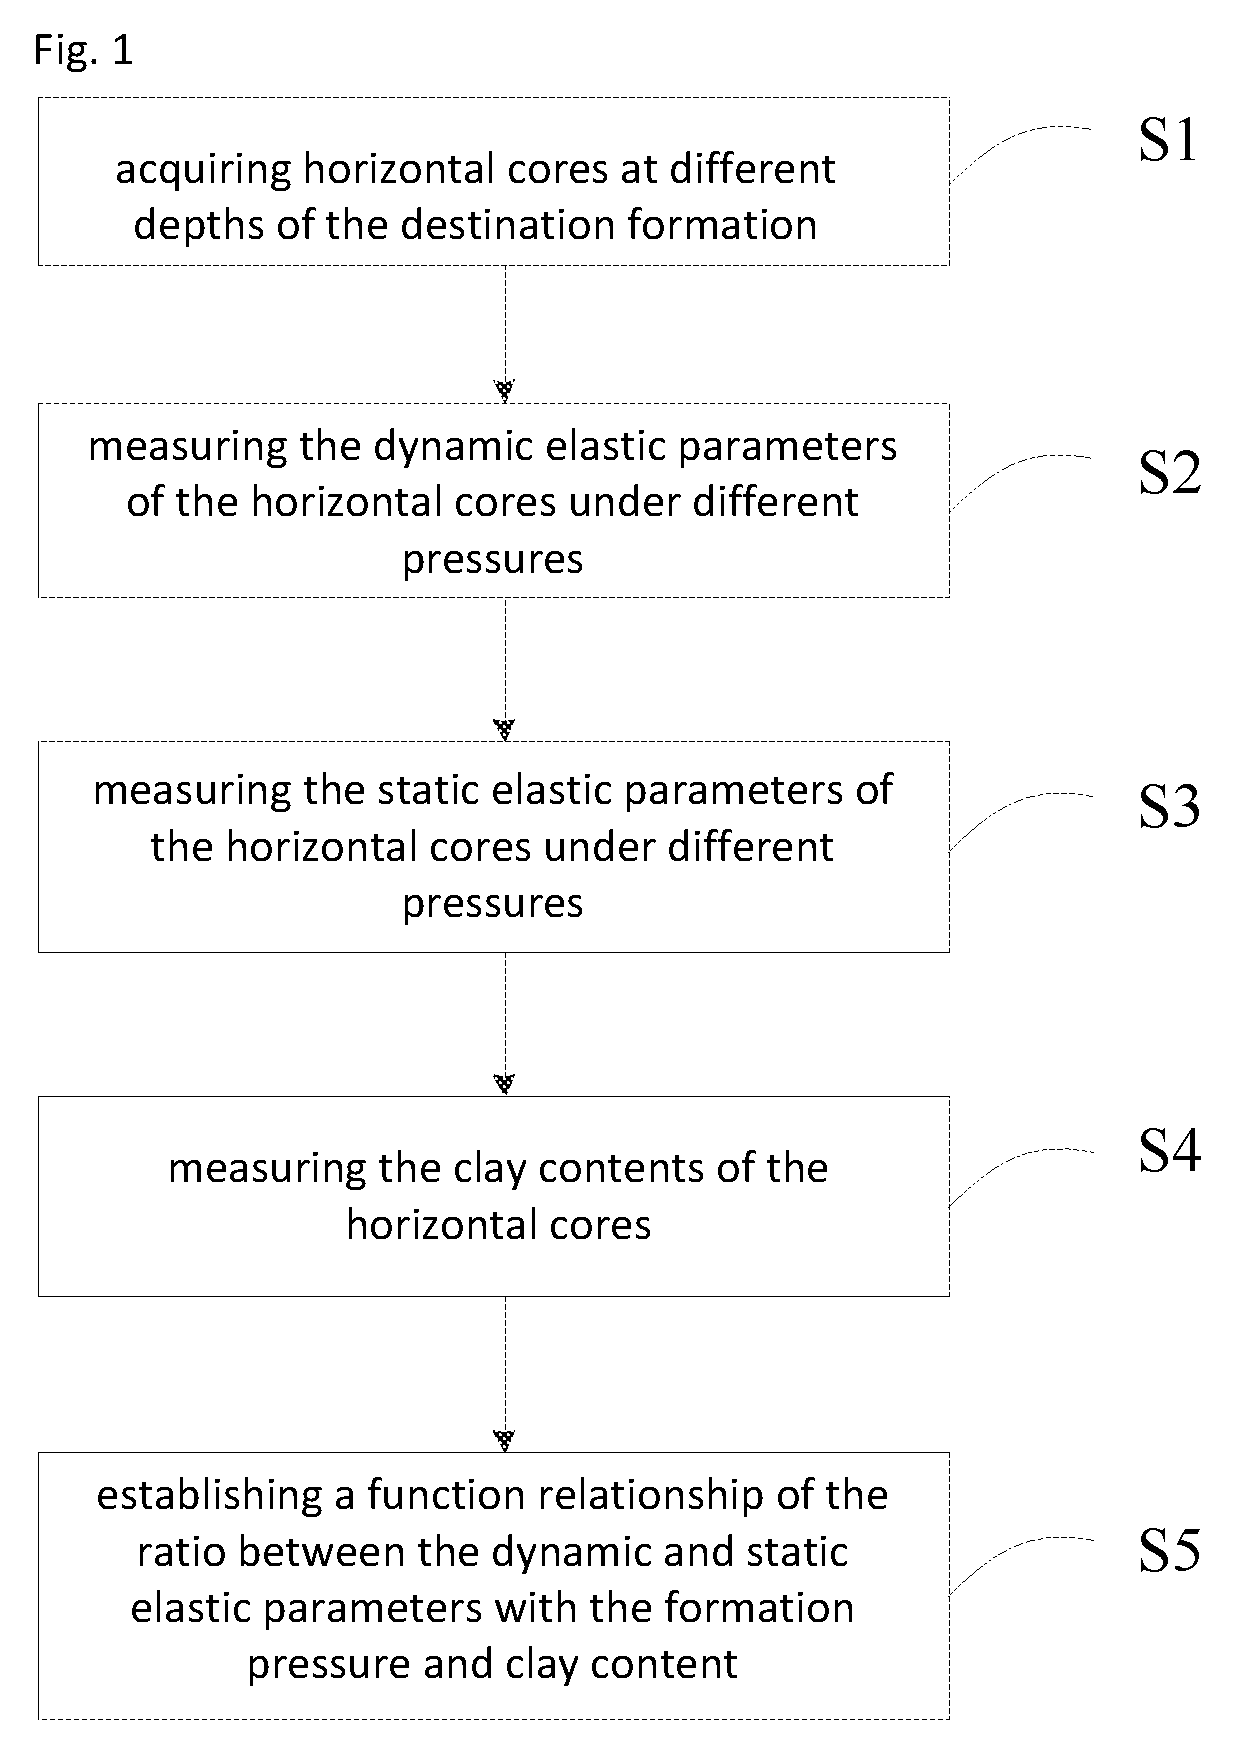
[0051]This example provides a method for obtaining a conversion relationship between dynamic and static elastic parameters (the flow of which is shown in FIG. 1), which includes the following steps:
[0052]Step S1, acquiring horizontal cores at different depths of the destination formation:
[0053]Horizontal plunger-like cores were obtained by drilling at different depths in the exploration area, with a set consisted of m=4 horizontal small cores obtained by drilling at the same formation depth; A total of n=8 sets of cores were obtained, denoted as D11, D12, D13, D14; D21, D22, D23, D24; . . . ; and D81, D82, D83, D84; wherein, each horizontal core was 2.5 cm in diameter and 8-10 cm in length.
[0054]The above cores were cut, respectively, with each divided into two smaller pieces and the cutting surface parallel to the bottom surface of the plunger-like core, and the location of cutting point must ensure that each of the two pieces after cutting was 4-5 cm in length; the cores satisfying such conditions after cutting were respectively denoted as D11A, D11B, D12A, D12B, . . . , D14A, D14B; D21A, D21B, D22A, D22B, . . . , D24A, D24B; . . . , and D81A, D81B, D82A, D82B, . . . , D84A, D84B; wherein, D11A, D11B indicated that after D11 was cut into two smaller pieces, one of them was denoted as D11A, and the other D11B, respectively; and so on.
[0055]Step S2, measuring the dynamic elastic parameters of the horizontal cores under different pressures:
[0056]Based on the formation pressure, four formation pressure values were set in an ascending order, denoted as P1, P2, P3, and P4 (unit: MPa), wherein, P1=20 MPa, P2=30 MPa, P3=40 MPa, and P4=60 MPa; the pressure range of 20 MPa-60 MPa encompassed the pressure across the entire exploration area.
[0057]Under the condition of a pressure of P1=20 MPa, the horizontal cores D11A, D21A, D31A, . . . , and D81A obtained in step S1 were subjected to density and longitudinal and shear wave velocity measurements under saturated brine conditions (for the longitudinal and transverse wave velocity measurements, reference was made to SY/T 6351-2012).
[0058]The device for measuring the longitudinal and shear wave velocities of the core was not particularly limited and could be a conventional measuring device in the art, such as the device shown in FIG. 2 (which was one of the conventional measurement devices in the art). The device included a displacement meter 1, a first probe 2, a second probe 3, a measuring tube 4, a pore fluid control unit 5, a temperature control unit 6, a confining pressure control unit 7, and a data acquisition and analysis unit 8. During the measurement, the measure conditions were regulated by the pore fluid control unit 5, the temperature control unit 6, and the confining pressure control unit 7. In this device, the displacement meter 1 could perform deformation measurement; the probes at both ends of the sample could allow the fluid passing through on one hand and allow energy being transmitted and received on the other hand, while the data resulted from the measurements could be sent to the data acquisition and analysis unit 8. This measuring device was only an exemplary device of the embodiment of the present invention. Other measuring devices having the same function or capable of fulfilling the same purpose could also be used for the measurement of the longitudinal and shear wave velocities of cores.
[0059]The measurement results are shown in Table 1, with their dynamic Young's moduli Ed11, Ed21, Ed31, . . . , and Ed81 calculated; wherein, the dynamic Young's moduli were calculated with an equation as shown in Equation 1:
E = ρ V s 2 ( 3 V p 2 - 4 V s 2 ) V p 2 - V 2 2 Equation 1
[0060]In Equation 1, E is dynamic Young's modulus, KPa; ρ is density, g/cm3, Vp is longitudinal wave velocity, m/s, Vs is shear wave velocity, m/s,
TABLE 1 Experimental shear Dynamic confining Longitudinal wave Young's Sample pressure Density wave velocity velocity modulus No. (MPa) g/cm3 (m/s) (m/s) (GPa) D11A 20 2.65 5663 3426 75.35 D12A 30 2.65 5704 3456 76.59 D13A 40 2.65 5728 3472 77.29 D14A 60 2.65 5742 3484 77.76 D21A 20 2.64 5641 3400 74.14 D22A 30 2.64 5674 3418 74.96 D23A 40 2.64 5688 3430 75.43 D24A 60 2.64 5697 3437 75.72 D31A 20 2.61 5186 2905 56.01 D32A 30 2.61 5243 2954 57.74 D33A 40 2.61 5272 2980 58.66 D34A 60 2.61 5309 3009 59.71 D41A 20 2.56 5138 2914 54.91 D42A 30 2.56 5225 2977 57.16 D43A 40 2.56 5279 3014 58.53 D44A 60 2.56 5314 3041 59.49 D51A 20 2.57 5045 2885 53.78 D52A 30 2.57 5087 2912 54.75 D53A 40 2.57 5110 2926 55.27 D54A 60 2.57 5126 2934 55.59 D61A 20 2.54 5048 2970 55.36 D62A 30 2.54 5164 3051 58.24 D63A 40 2.54 5224 3092 59.75 D64A 60 2.54 5273 3125 60.98 D71A 20 2.54 5030 2977 55.39 D72A 30 2.54 5108 3042 57.59 D73A 40 2.54 5163 3086 59.12 D74A 60 2.54 5201 3111 60.05 D81A 20 2.48 4764 2653 44.53 D82A 30 2.48 4841 2718 46.53 D83A 40 2.48 4895 2757 47.79 D84A 60 2.48 4935 2782 48.63
[0061]Then, under the condition of the pressure of P2=30 MPa, the horizontal cores D12A, D22A, D32A, . . . , and D82A obtained in Step S1 were subjected to density and longitudinal and shear wave velocity measurements under saturated brine conditions, and their dynamic Young's moduli Ed12, Ed22, Ed32, . . . , and Ed82 were calculated.
[0062]Similarly, under the condition of the pressure of P4=60 MPa, the horizontal cores D14A, D24A, D34A, . . . , and D84A obtained in the step S1 were subjected to density and longitudinal and shear wave velocity measurements under saturated brine conditions, and their dynamic Young's moduli Ed14, Ed24, Ed34, . . . , and Ed84 were calculated.
[0063]Step S3, measuring the static elastic parameters of the horizontal cores under different pressures:
[0064]Under the condition of the pressure of P1=20 MPa, the horizontal cores D11B, D21B, D31B, . . . , and D81B obtained in Step S1 were subjected to stress and strain measurements under saturated saline conditions (for the stress and strain measurements, reference was made to GBT23561.9-2009), and their static Young's moduli were calculated according to the measurement results (as shown in Table 2); wherein the static Young's moduli were calculated with an equation as shown in Equation 2:
E = σ ab ɛ ab Equation 2
[0065]In Equation 2:
[0066]σab—the stress difference between the end point and starting point of the straight line segment of the curve of stress vs. axial strain, in megapascals (MPa);
[0067]εab—the strain difference between the end point and starting point of the straight line segment of the curve of stress vs. axial strain, in percentage.
[0068]Similarly, under the conditions of pressure P2=30, 40 and 60 MPa, the horizontal cores D12B, D22B, D32B, . . . , D82B, . . . , D14B, D24B, D34B, . . . , D84B were subjected to stress and strain measurements under saturated saline conditions, and their static Young's moduli were calculated.
TABLE 2 Experimental Static confining Stress Strain Young's Sample pressure difference difference modulus No. (MPa) σab (MPa) εab (%) (GPa) D11B 20 106.1708 0.2095 50.6 D12B 30 104.3521 0.1904 54.9 D13B 40 157.5117 0.2544 61.8 D14B 60 141.2113 0.2132 66.2 D21B 20 134.5789 0.2666 50.5 D22B 30 119.5818 0.2121 56.3 D23B 40 163.8272 0.2579 63.6 D24B 60 227.4188 0.3252 70 D31B 20 99.0613 0.2811 35.3 D32B 30 80.4307 0.2162 37.2 D33B 40 112.8493 0.291 38.8 D34B 60 107.6294 0.263 40.9 D41B 20 63.0874 0.1874 33.7 D42B 30 68.5192 0.1944 35.3 D43B 40 83.4911 0.2185 38.2 D44B 60 97.2092 0.2513 38.7 D51B 20 91.0993 0.275 33.1 D52B 30 94.6616 0.279 33.9 D53B 40 121.111 0.347 34.9 D54B 60 128.4008 0.358 35.9 D61b 20 91.6754 0.2513 36.5 D62B 30 88.6596 0.2226 39.8 D63B 40 97.4503 0.2286 42.6 D64B 60 101.1177 0.2189 46.1 D71B 20 76.6523 0.2076 36.9 D72B 30 96.5619 0.2431 39.7 D73B 40 107.8026 0.238 45.3 D74B 60 108.8003 0.2155 50.5 D81B 20 51.78 0.1859 27.9 D82B 30 90.3 0.2986 30.2 D83B 40 141.08 0.441 32 D84B 60 187.13 0.6021 31.1
[0069]Step S4, measuring the clay contents of the horizontal cores;
[0070]The divided samples of the core D11B, D12B, . . . , D14B after the stress and strain measurement were collected and subjected to X-ray diffraction measurement, and the obtained clay content values represented the clay contents at the formation depth D1;
[0071]Similarly, the divided samples of the horizontal cores at other formation depths after the stress and strain measurement were respectively collected and subjected to X-ray diffraction measurement, and the obtained clay content values represented the clay contents at the corresponding formation depths, as shown in Table 3.
TABLE 3 Sample No. Total clay content D1 3.5 D2 2 D3 19.8 D4 20.8 D5 16.7 D6 12.5 D7 11.8 D8 14.2
[0072]Step S5, establishing a function relationship of the ratio between the dynamic and static elastic parameters with the formation pressure and clay contents:
[0073]On the basis of the measured results at different formation depths under different pressure values, a relationship of the ratio between the dynamic and static elastic parameters (the ratio between the dynamic and static elastic parameters here referred to the ratio between the dynamic and static Young's modulus) with the formation pressure was established (as shown in FIG. 3). Meanwhile, a relationship of the ratio between the dynamic and static elastic parameters under a fixed pressure with the clay content was established in connection with the results of clay content measurements at various formation depths (as shown in FIG. 4 and FIG. 5 which demonstrated the relationship of the ratio between the dynamic and static elastic parameters and the clay content when the formation pressure was 20 MPa and 40 MPa respectively).
[0074]According to the relationship of the ratio between the dynamic and static elastic parameters with the formation pressure, together with the relationship thereof with the clay content under different formation pressures, a function relationship of the ratio between the dynamic and static elastic parameters with the clay content and formation pressure was established, as shown in Equation 2:
E d E s = ( A + B · V clay ) · P eff C · V clay + D Equation 2
[0075]In Equation 2, Ed is dynamic elastic parameter (also referred to as dynamic Young's modulus), Es is static elastic parameter (also referred to as static Young's modulus), Vclay is clay content, Peff is formation pressure, and A, B, C, and D are empirical coefficients obtained from experimental results. In this example, A=3.5, B=−8.14, C=1.35, and D=−0.3.
[0076]FIG. 6 is a comparison diagram of the effect of application in a well in the exploration area. Here, a total of 11 pieces of information was included, with Esta in the 9th representing the static Young's modulus calculated by the method provided in the example of the present invention, Esta2 representing the static Young's modulus calculated by a traditional dynamic and static linear regression method, and Esta_Core representing the static Young's modulus obtained from core measurements. The comparison results suggested that the results calculated by the method provided in the example of the present invention were closest to the results from the core measurements. The average relative error at three data points was 18%, as oppose to the average relative error from the conventional method of up to 45%. The statistical results from seven data points in three wells in the area demonstrated that the relative error of the method provided by the present invention was 13% in comparison with the results from the core measurements, as oppose to the relative error from the conventional method of up to 28%.
[0077]The foregoing describes only the preferred embodiments of the present invention, but is not intended to limit the present invention. Various modifications and changes can be made to the embodiments of the present invention for those skilled in the art. Any modifications, equivalent substitutions, improvements and the like made within the spirit and principle of the present invention are intended to be included in the protection scope of the present invention.

PUM

no PUM

Description & Claims & Application Information

We can also present the details of the Description, Claims and Application information to help users get a comprehensive understanding of the technical details of the patent, such as background art, summary of invention, brief description of drawings, description of embodiments, and other original content. On the other hand, users can also determine the specific scope of protection of the technology through the list of claims; as well as understand the changes in the life cycle of the technology with the presentation of the patent timeline. Login to view more.

Similar technology patents

Capacitive level measurement and detection device

InactiveUS20060285212A1Accurate resultMirrorsResistance/reactance/impedenceLevel measurementSynchronous rectifier
Owner:IMF ELECTRONIC GMBH

Classification and recommendation of technical efficacy words

Why Eureka
Try Eureka