Aggregation and processing of hierarchical data for display of interactive user interface chart elements

a hierarchical data and interactive technology, applied in the field of hierarchical data aggregation and processing for display of interactive user interface chart elements, can solve the problems of not providing sufficient mechanisms for displaying easily ascertainable summaries, and difficulty in quickly ascertaining what components

Active Publication Date: 2019-10-03
MICROSOFT TECH LICENSING LLC
View PDF0 Cites 2 Cited by
  • Summary
  • Abstract
  • Description
  • Claims
  • Application Information

AI Technical Summary

Benefits of technology

[0003]This summary is provided to introduce a selection of concepts in a simplified form that are further described below in the Detailed Description section. This summary is not intended to identify key features or essential features of the claimed subject matter, nor is it intended to be used as an aid in determining the scope of the claimed subject matter. Additional aspects, features, and / or advantages of examples will be set forth in part in the description which follows and, in part, will be apparent from the description or may be learned by practice of the disclosure.

Problems solved by technology

However, it can be difficult to quickly ascertain what components were the basis for an arrived upon overall score for a review or assessment, as well as to ascertain what components were the basis for each sub-score for each category that feeds into an overall score for a review or assessment.
The problem arises because reviews and assessments generally include a plurality of category types that feed into an overall score, and each category type may include a plurality of data points, which each have an associated score and an associated weight.
Charts and graphs do a good job of conveying either the score, or the weight, associated with each data point to users, but they do not typically provide sufficient mechanisms for displaying easily ascertainable summaries of both the score and the weight of each data point in one visual presentation, or for how those scores and weights affect a hierarchical data structure composed of individual data points that feed into categories, and ultimately an overall score for a review or assessment.

Method used


Image

  • Aggregation and processing of hierarchical data for display of interactive user interface chart elements
  • Aggregation and processing of hierarchical data for display of interactive user interface chart elements
  • Aggregation and processing of hierarchical data for display of interactive user interface chart elements

Examples


Embodiment Construction

[0015]Various embodiments will be described in detail with reference to the drawings, wherein like reference numerals represent like parts and assemblies throughout the several views. Reference to various embodiments does not limit the scope of the claims attached hereto. Additionally, any examples set forth in this specification are not intended to be limiting and merely set forth some of the many possible embodiments for the appended claims.

[0016]The various embodiments and examples described above are provided by way of illustration only and should not be construed to limit the claims attached hereto. Those skilled in the art will readily recognize various modifications and changes that may be made without following the example embodiments and applications illustrated and described herein, and without departing from the true spirit and scope of the claims.

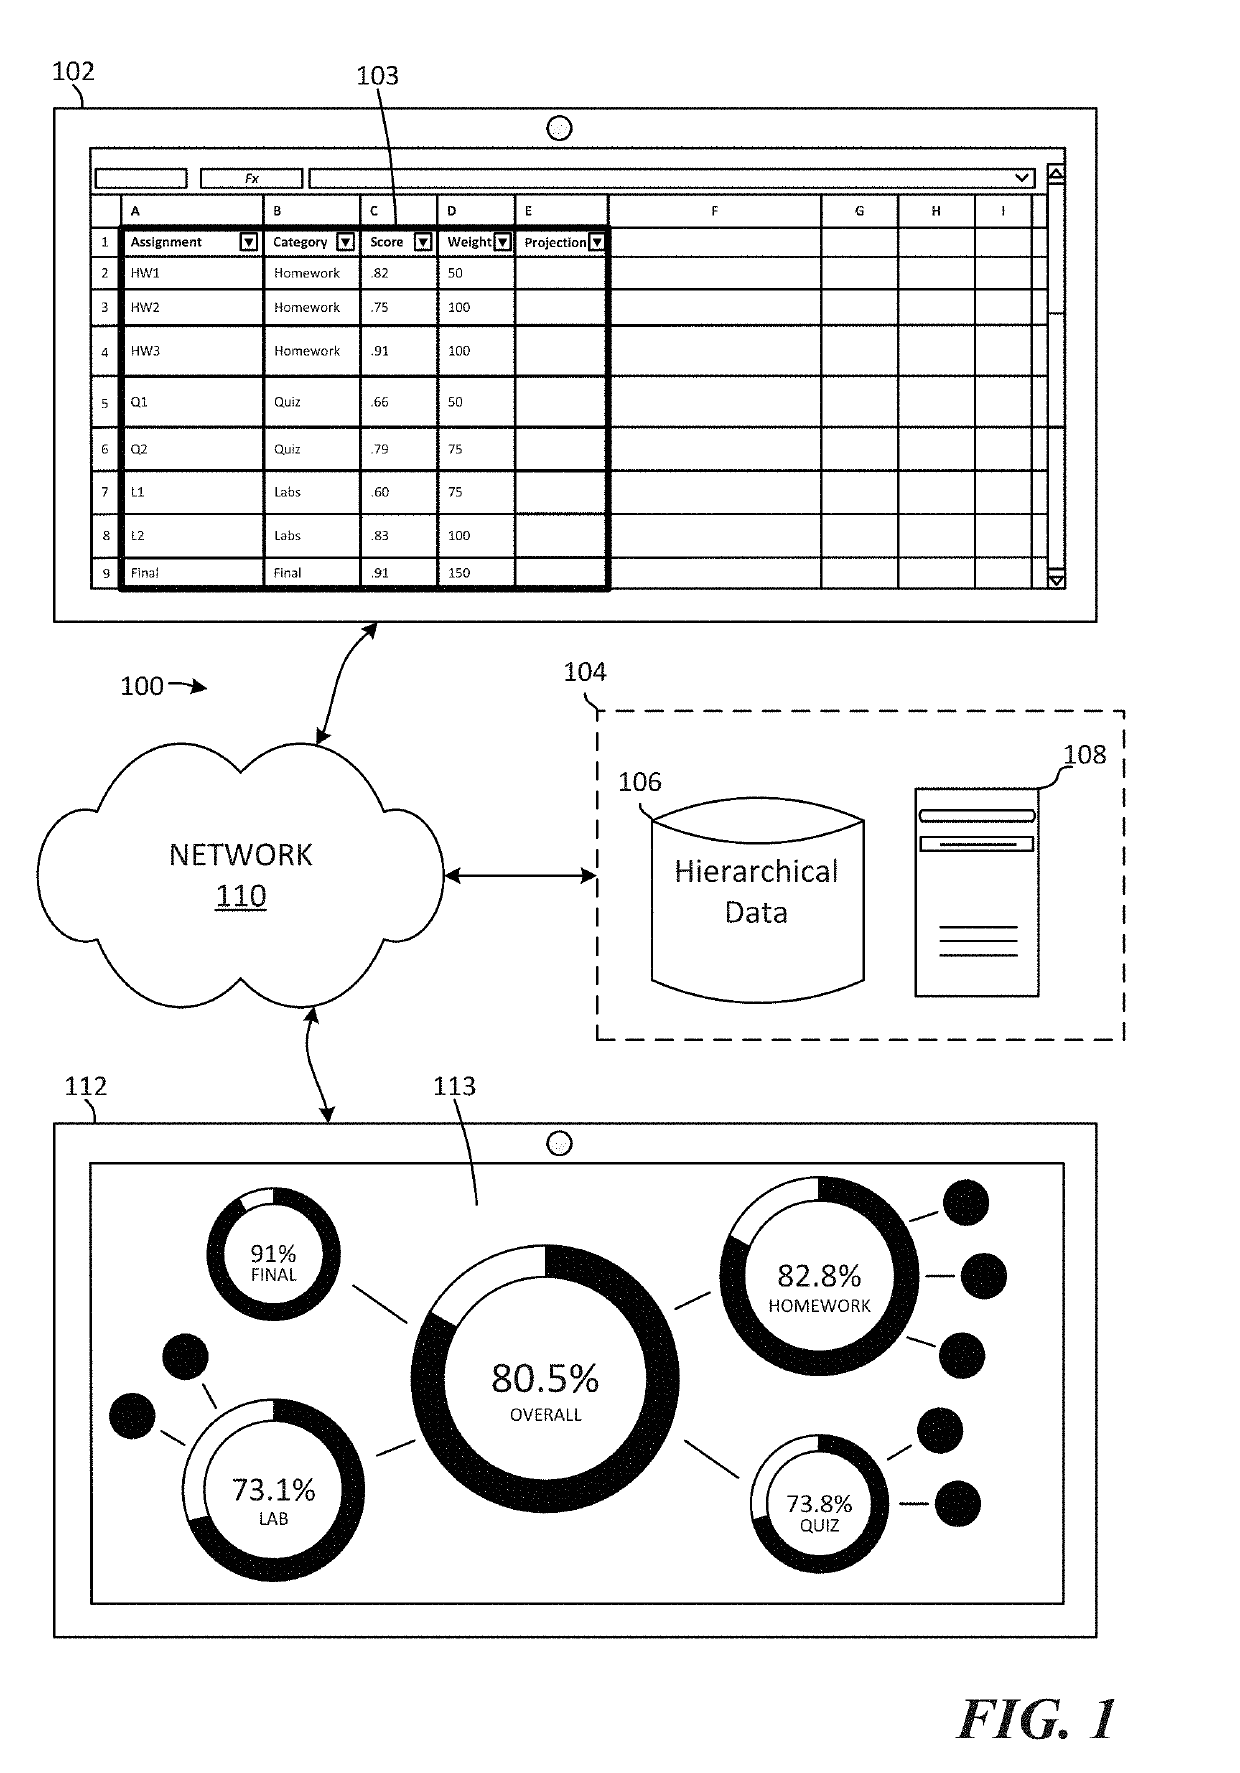
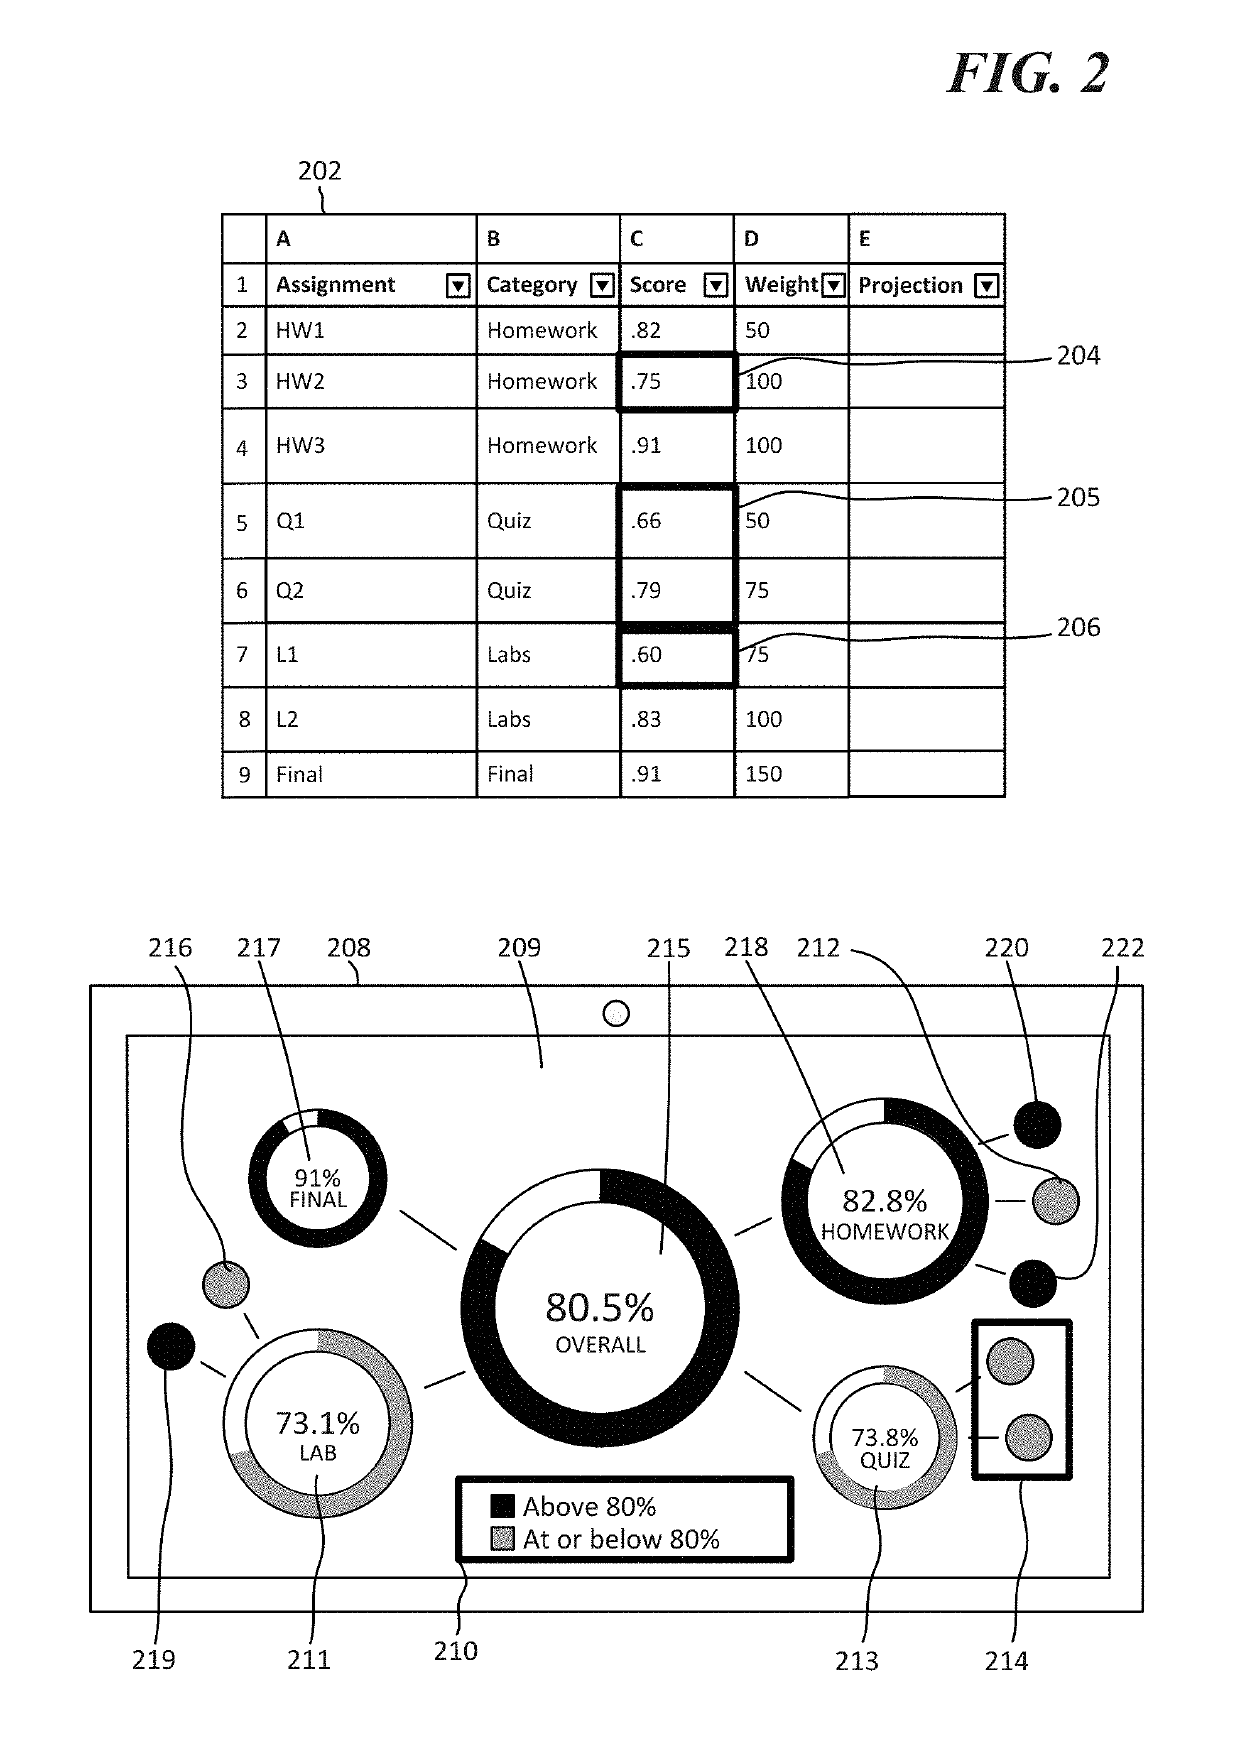
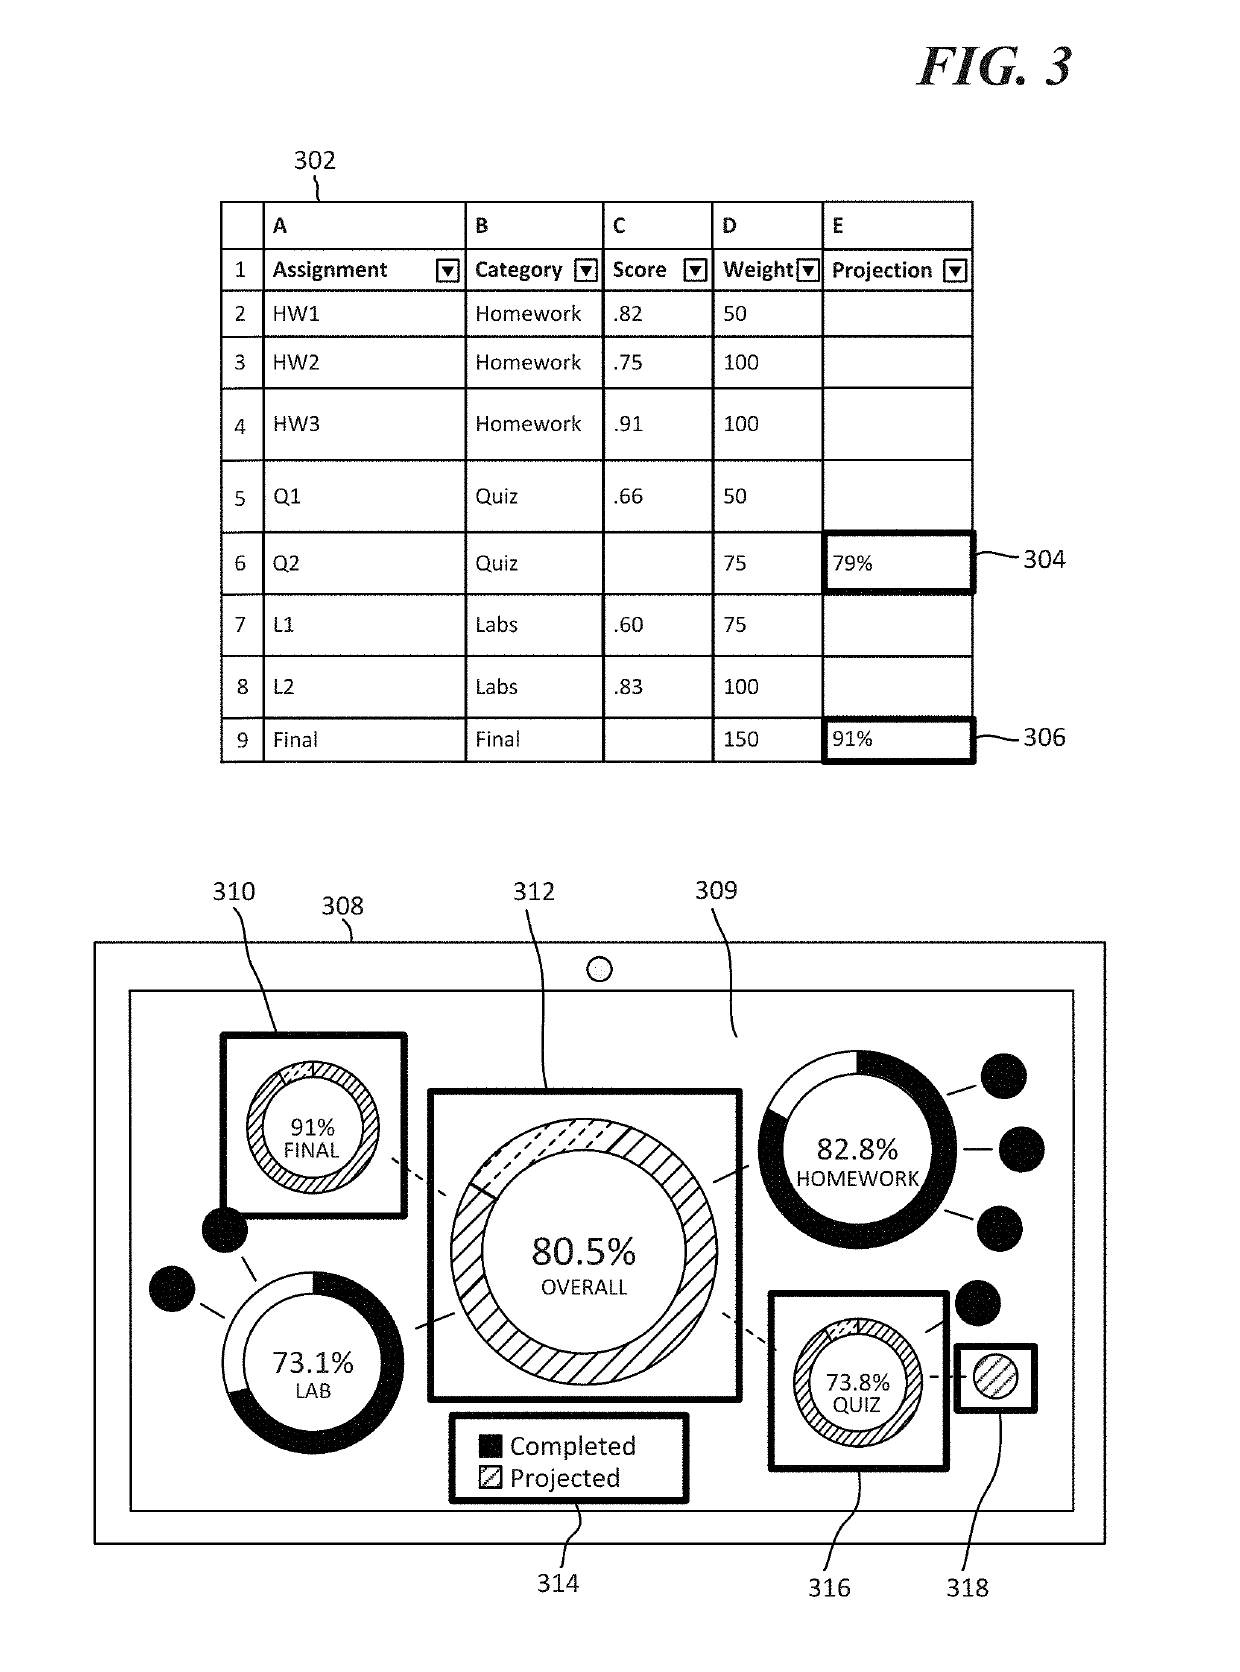
[0017]Generally, the present disclosure is directed to systems, methods and devices for aggregating and processing hierarchica...


PUM


Abstract

In non-limiting examples of the present disclosure, systems, methods and devices for generating and displaying interactive charts from hierarchical datasets are presented. A dataset comprising a plurality of data points may be received, wherein each of the data points has a score and a weight associated with it, and wherein each of the plurality of data points is a member of a hierarchical category type of the dataset. A weight value that each hierarchical category type contributes to the dataset, relative to each other category type, may be calculated. A score for each of the hierarchical category types may be calculated. A plurality of objects that each represent one of the hierarchical category types may be displayed in a hierarchical format in association with an indication of the calculated score for each of the objects.

Description

BACKGROUND[0001]The use of productivity applications in tracking data points and maintaining datasets for reviews and assessments has become nearly ubiquitous as the ability to store and search for data has become increasingly efficient. However, it can be difficult to quickly ascertain what components were the basis for an arrived upon overall score for a review or assessment, as well as to ascertain what components were the basis for each sub-score for each category that feeds into an overall score for a review or assessment. The problem arises because reviews and assessments generally include a plurality of category types that feed into an overall score, and each category type may include a plurality of data points, which each have an associated score and an associated weight. Charts and graphs do a good job of conveying either the score, or the weight, associated with each data point to users, but they do not typically provide sufficient mechanisms for displaying easily ascertai...

Claims


Application Information

Patent Timeline
Patent Type & Authority Applications(United States)
IPC IPC(8): G06F17/24G06F17/30G06T11/20
CPCG06F16/287G06F16/26G06T11/206G06F17/246G06F40/106G06F40/18
Inventor BRENNE, LEIF CHRISTIANMILNE, BRENTON AIHELEWIS, ELEANOR LILLIANJIANG, AMANDA GUANHUAASHOK, MAITREYI
Owner MICROSOFT TECH LICENSING LLC
Why Eureka
Try Eureka