System and method for characterizing liver perfusion of contrast agent flow

a contrast agent and flow technology, applied in the field of systems for characterizing liver perfusion of contrast agent flow, can solve the problems of difficult detection of liver lesions and inability to distinguish separate amounts, and achieve the effect of effective treatmen

Inactive Publication Date: 2019-12-05
KONINKLJIJKE PHILIPS NV
View PDF0 Cites 2 Cited by
  • Summary
  • Abstract
  • Description
  • Claims
  • Application Information

AI Technical Summary

Benefits of technology

[0004]Since liver lesions, like other cancers, are most effectively treated when detected early, high-risk patients should be monitored frequently for signs of these diseases. But in their early stages liver lesions are often difficult to detect through conventional diagnostic imaging due to their small size. Thus, clinicians often conduct their diagnoses to look for other signs that a lesion is developing. One of these signs is changes in the blood flow to the liver. The liver has a unique blood supply network. A primary source of fresh blood to the liver is the arterial inflow from th

Problems solved by technology

But in their early stages liver lesions are often difficult to detect through conventional diagnostic imaging due to their small size.

Method used


Image

  • System and method for characterizing liver perfusion of contrast agent flow
  • System and method for characterizing liver perfusion of contrast agent flow
  • System and method for characterizing liver perfusion of contrast agent flow

Examples


Embodiment Construction

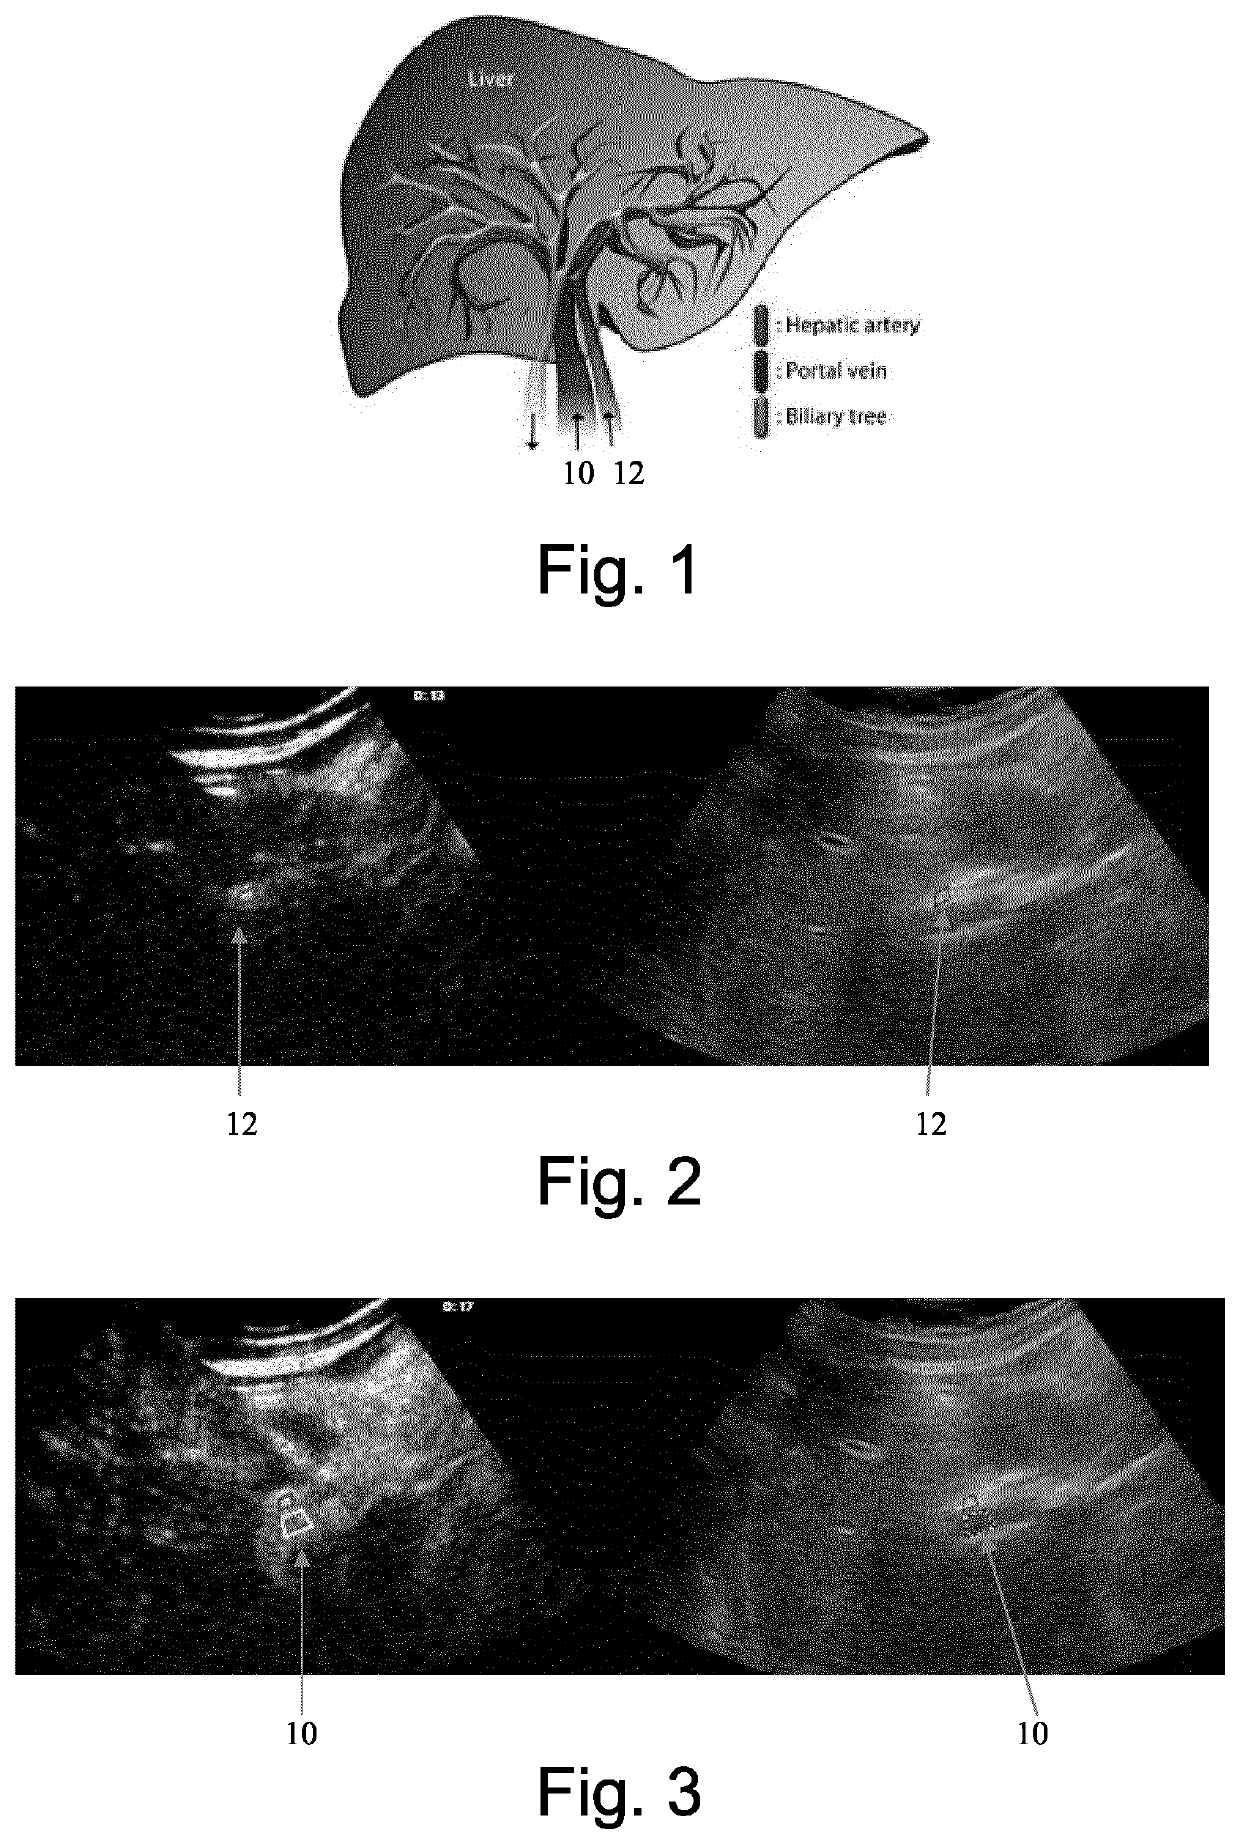
[0028]FIG. 1 is an illustration of the liver and its flow network. The liver contains vessel trees for three sources of flow: the biliary tree for the flow of liver bile, the portal vein 10 which provides a nourishing flow of blood from the abdomen, and the hepatic artery 12 which is a source of arterial blood flow. The capillary structures of these networks are intertwined throughout the parenchyma, causing liver tissue to be perfused with blood from both arterial and venous sources. The hepatic artery 12 and portal vein 10 can be accessed separately where they enter the organ at the bottom of the liver as shown in the illustration.

[0029]FIG. 2 shows two ultrasound images, a contrast image on the left and a B mode image on the right, illustrating the location of the hepatic artery 12 and its blood flow. The two images were acquired at the same time with the vascular system perfused with a microbubble contrast agent. The contrast image on the left was processed by enhancing the harm...


PUM


Abstract

An ultrasonic diagnostic imaging system and method acquire a sequence of image data as a bolus of contrast agent washes into and out of the liver. The image data of contrast intensity is used to compute time-intensity curves of contrast flow in the hepatic artery, the portal vein, and at one or more regions of interest in the liver. The time-intensity curve of contrast flow in the hepatic artery is scaled to the time-intensity curve of contrast flow in a region of interest to produce time-intensity curve data representing the flow of blood at the region of interest due to arterial flow. The time-intensity curve data representing the flow of blood at the region of interest due to arterial flow is subtracted from the time-intensity curve of contrast flow in the region of interest to produce time-intensity curve data representing the flow of blood at the region of interest due to venous flow.

Description

FIELD OF THE INVENTION[0001]This invention relates to systems for characterizing liver perfusion of contrast agent flow and, in particular, to systems which processes contrast-enhanced ultrasound image data. Contrast-enhanced ultrasound imaging is known to be able to assist the clinicians to identify and characterize lesions such as liver tumors.[0002]Hepatitis B and hepatitis C patients have been found to be at an increased risk of developing primary liver cancer, hepatocellular carcinoma (HCC). Due to the discovery that hepatitis C was being contracted by patients through blood transfusions in the early 1980's, there remain a significant number of hepatitis C patients who need to be examined regularly for the onset of HCC, as the lesions are best treated in their early stages. The usual progression of the disease is from hepatitis to liver cirrhosis to HCC. An easy-to-use monitoring technique for liver disease progression would have widespread application in assisting in the early...

Claims


Application Information

Patent Timeline
IPC IPC(8): A61B8/06A61B8/08A61B8/00
CPCA61B8/085A61B8/06A61B8/5246A61B8/5223A61B8/463A61B8/4488A61B8/481A61B8/08A61B8/469
Inventor GU, XIAOLINDENG, YINHUILI, XIAOMINSHAMDASANI, VIJAY THAKUR
Owner KONINKLJIJKE PHILIPS NV
Why Eureka
Try Eureka