Method to provide sensitivity information for (R,s,S) inventory systems with back-ordered demand

a technology of back-ordered demand and sensitivity information, applied in the field of computer software for business management, can solve the problems of excessive complexity in the determination of these values, the use of simulation to do sensitivity analysis to changes in s and s values becomes a time-consuming task, and the use of simulation

Inactive Publication Date: 2000-02-01
IBM CORP
View PDF2 Cites 45 Cited by
  • Summary
  • Abstract
  • Description
  • Claims
  • Application Information

AI Technical Summary

Problems solved by technology

The determination of these values becomes exceedingly complicated in the general case due to a number of factors.
Due to the requirement that several replications of the simulation have to be done to obtain meaningful estimates of performance, and the fact that a typical manufactur...

Method used


Image

  • Method to provide sensitivity information for (R,s,S) inventory systems with back-ordered demand
  • Method to provide sensitivity information for (R,s,S) inventory systems with back-ordered demand
  • Method to provide sensitivity information for (R,s,S) inventory systems with back-ordered demand

Examples


Embodiment Construction

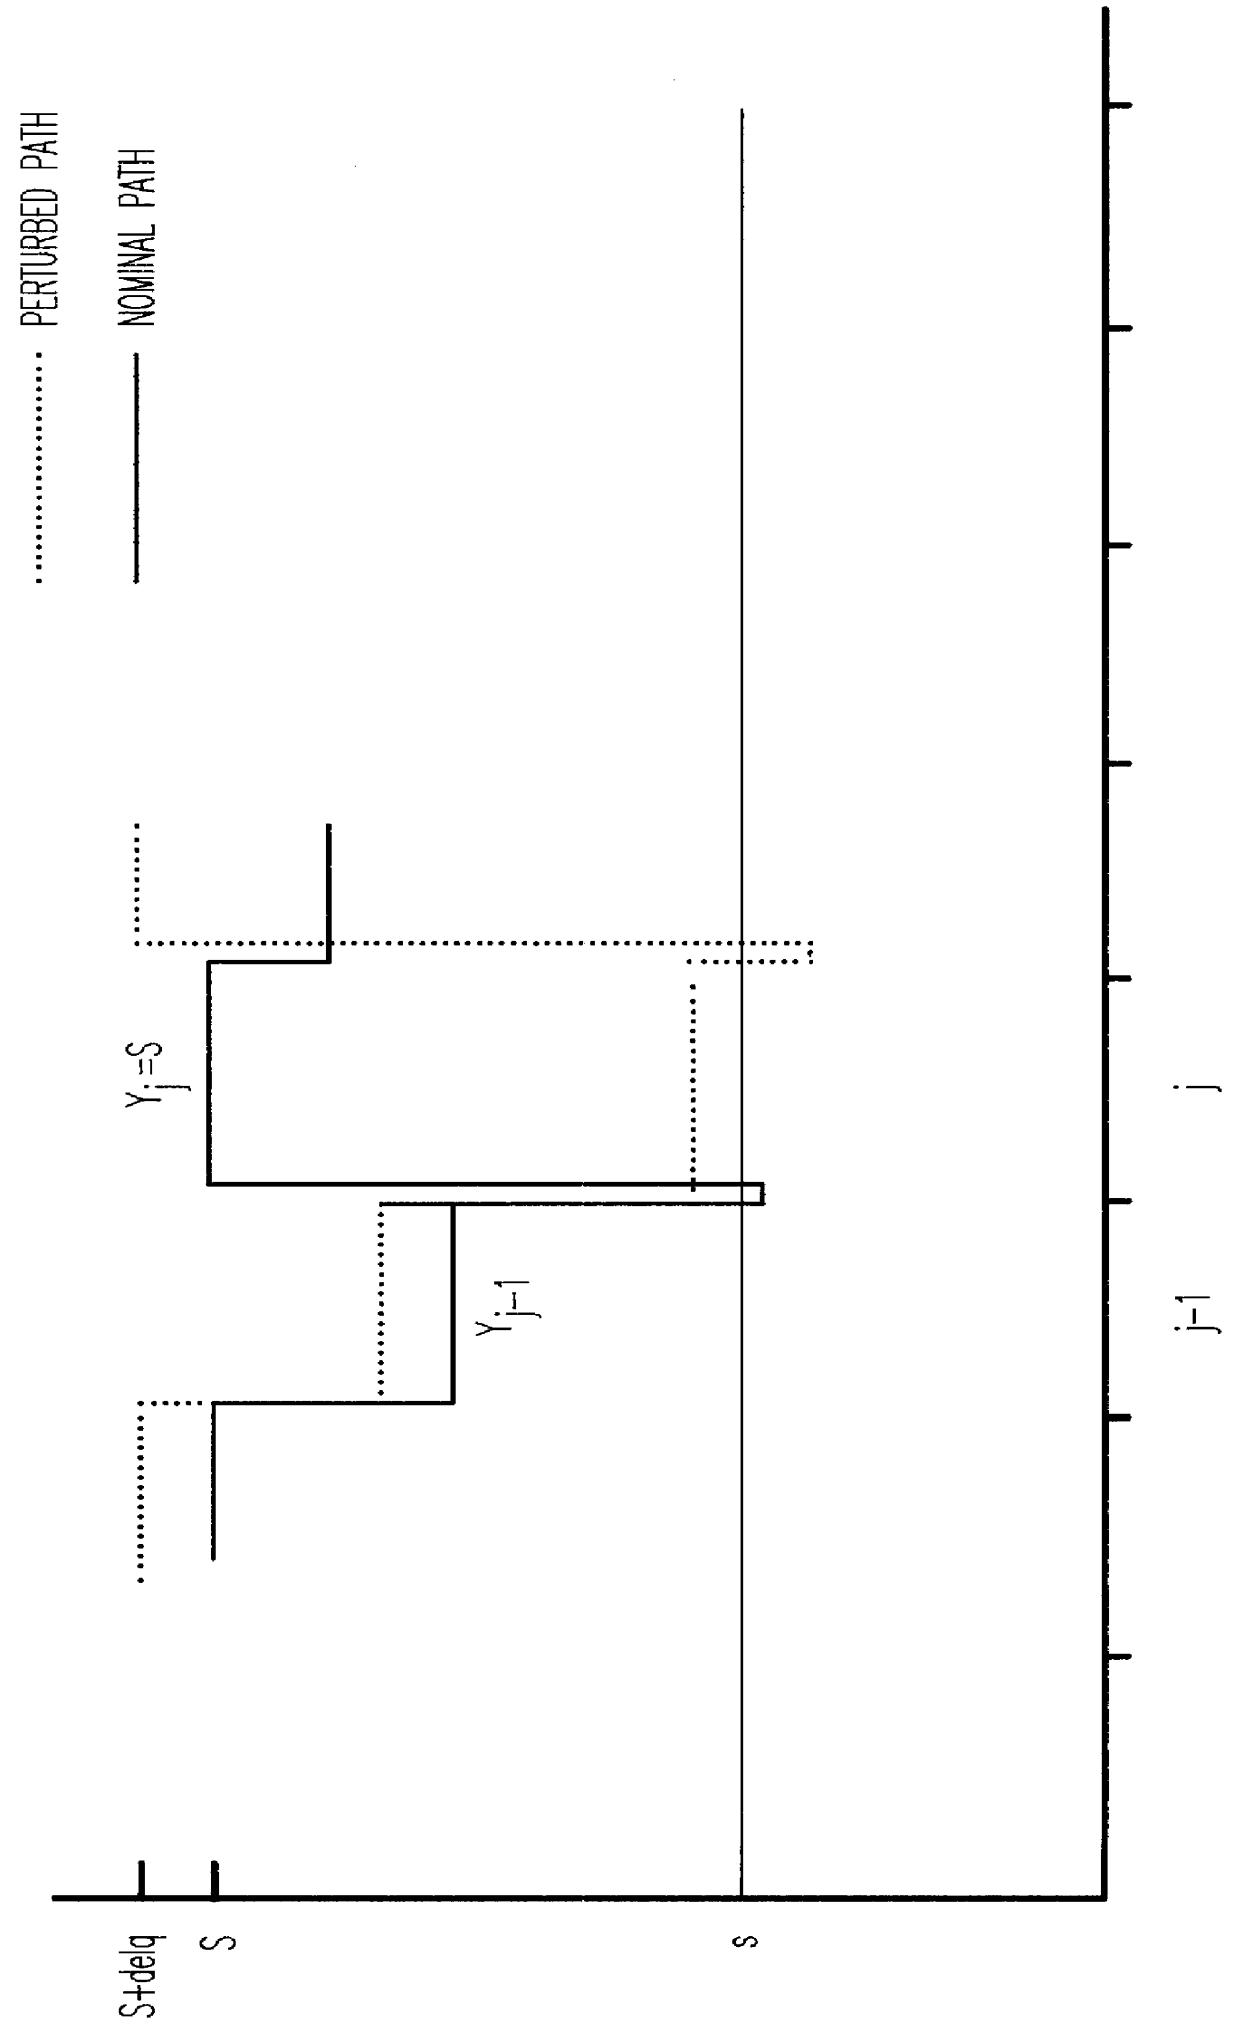
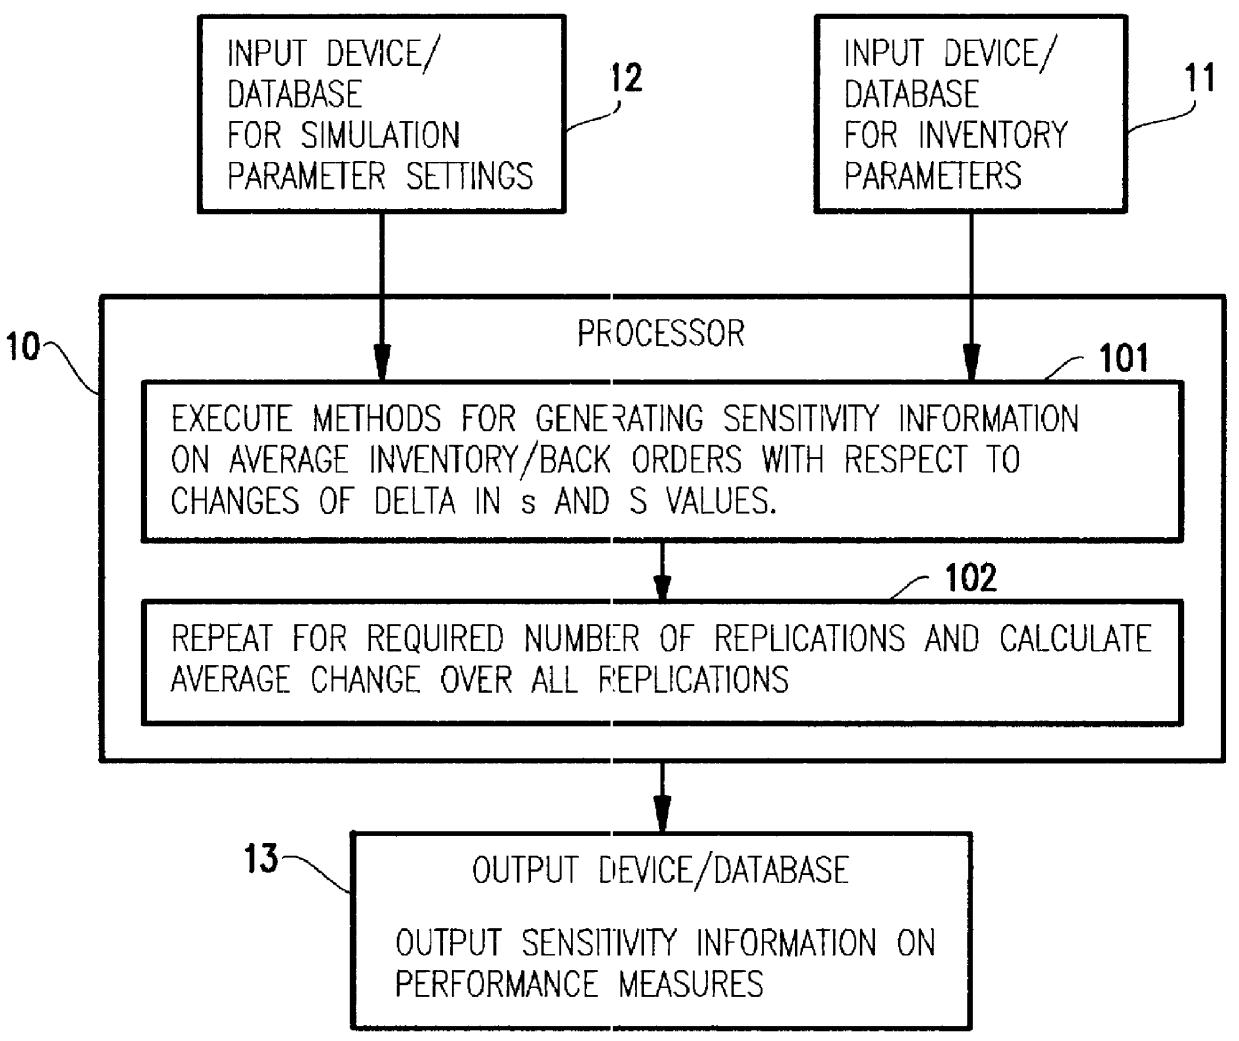
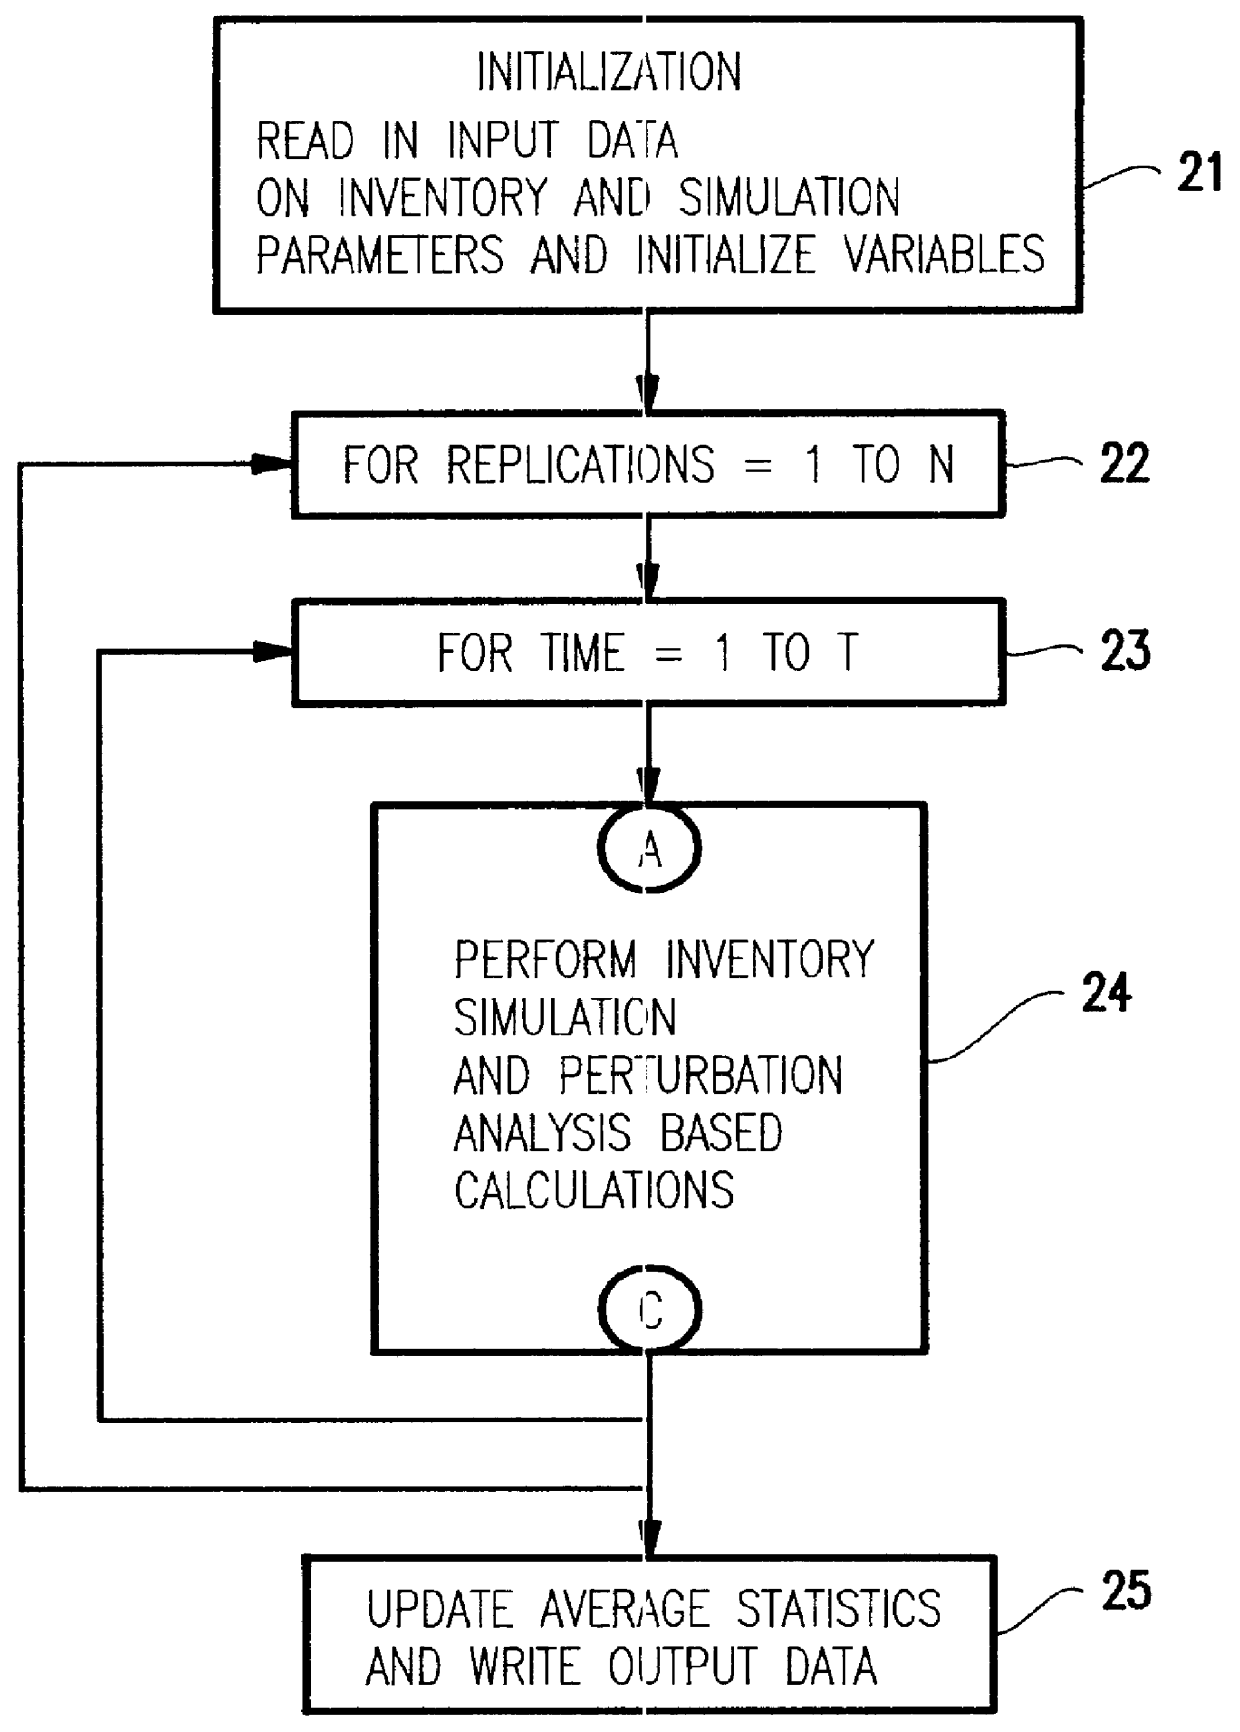
This invention will be described by first defining terms to be used, and describing the general method referring to FIG. 1, and then presenting a detailed embodiment by reference to the other drawings.

Problem Statement:

Let

T=time horizon under consideration.

i=1,2, . . . , T be the index of time.

Y.sub.i =inventory position in period i, where inventory position refers to stock on hand plus on order minus back order.

W.sub.i =inventory level in period i, refers to physical stock on hand.

O.sub.i =incoming orders in period i.

B.sub.i =Back Orders in period i.

D.sub.i =randomly realized demand in period i.

L=order lead time, the time between placement of an order and its arrival.

s=Specified reorder point.

S=Specified order up to level.

R=inventory is reviewed every R periods of time.

Consider an inventory system where at discrete and periodic time intervals, first incoming orders are received and back-orders satisfied, the inventory position is reviewed, and then an ordering decision is made acco...


PUM


Abstract

Sensitivity information about the average back-ordered sales and inventory levels of a back-order (R,s,S) inventory system is generated with respect to the two decision variables s and S. This information is used for what-if analysis and optimization of the decision variables s and S. The computer implemented algorithm provides sensitivity of both average inventory levels and average back orders with respect to changes in s and q (where q=S-s), for a back-order inventory simulation for any specified demand distribution. Further, the sensitivity information provided by the algorithm is exact when compared to a finite-difference simulation for the case of both discrete and continuous, stationary and non-stationary demands. A finite difference estimate of the sensitivity is obtained by running two simulations where the parameter in question (s or S) differ by a chosen small number, and then calculating the resulting difference in the performance measure of interest, in this case average inventory and back orders.

Description

1. Field of the InventionThe present invention generally relates to computer software for business management and, more particularly, to a computer implemented method for providing sensitivity information about average back-ordered sales and inventory levels of a back-order (R,s,S) inventory system with respect to the two decision variables s and S for what-if analysis and optimization of the decision variables.2. Background DescriptionThe system under consideration manages the inventory level of an item where, once every period or at regular intervals, the inventory level is reviewed and if necessary purchase orders are placed to replenish depleted inventory, in accordance with a pre-specified decision rule. An (R,s,S) inventory policy is one such decision rule that specifies that inventory be relieved every R periods of time, and that an order be placed when the level of inventory on hand plus on order falls below the level s (a specified number), and the amount of order be the di...

Claims


Application Information

Patent Timeline
IPC IPC(8): G06Q10/00G06Q10/06G06Q10/08
CPCG06Q10/063G06Q10/087
Inventor RAMASWAMY, SANJAY ELATHURLEUNG, YING TAT
Owner IBM CORP
Why Eureka
Try Eureka