Method for determining the performance components of a manufacturing line

Inactive Publication Date: 2001-07-10
IBM CORP
View PDF7 Cites 88 Cited by
  • Summary
  • Abstract
  • Description
  • Claims
  • Application Information

AI Technical Summary

Problems solved by technology

Semiconductor manufacturing is faced with significant investment and cost challenges.
The result is a limit on the amount of work in progress (WIP) in front of each toolset.
In addition, the impact of mix and volume with a cycle time

Method used


Image

  • Method for determining the performance components of a manufacturing line
  • Method for determining the performance components of a manufacturing line
  • Method for determining the performance components of a manufacturing line

Examples


Example

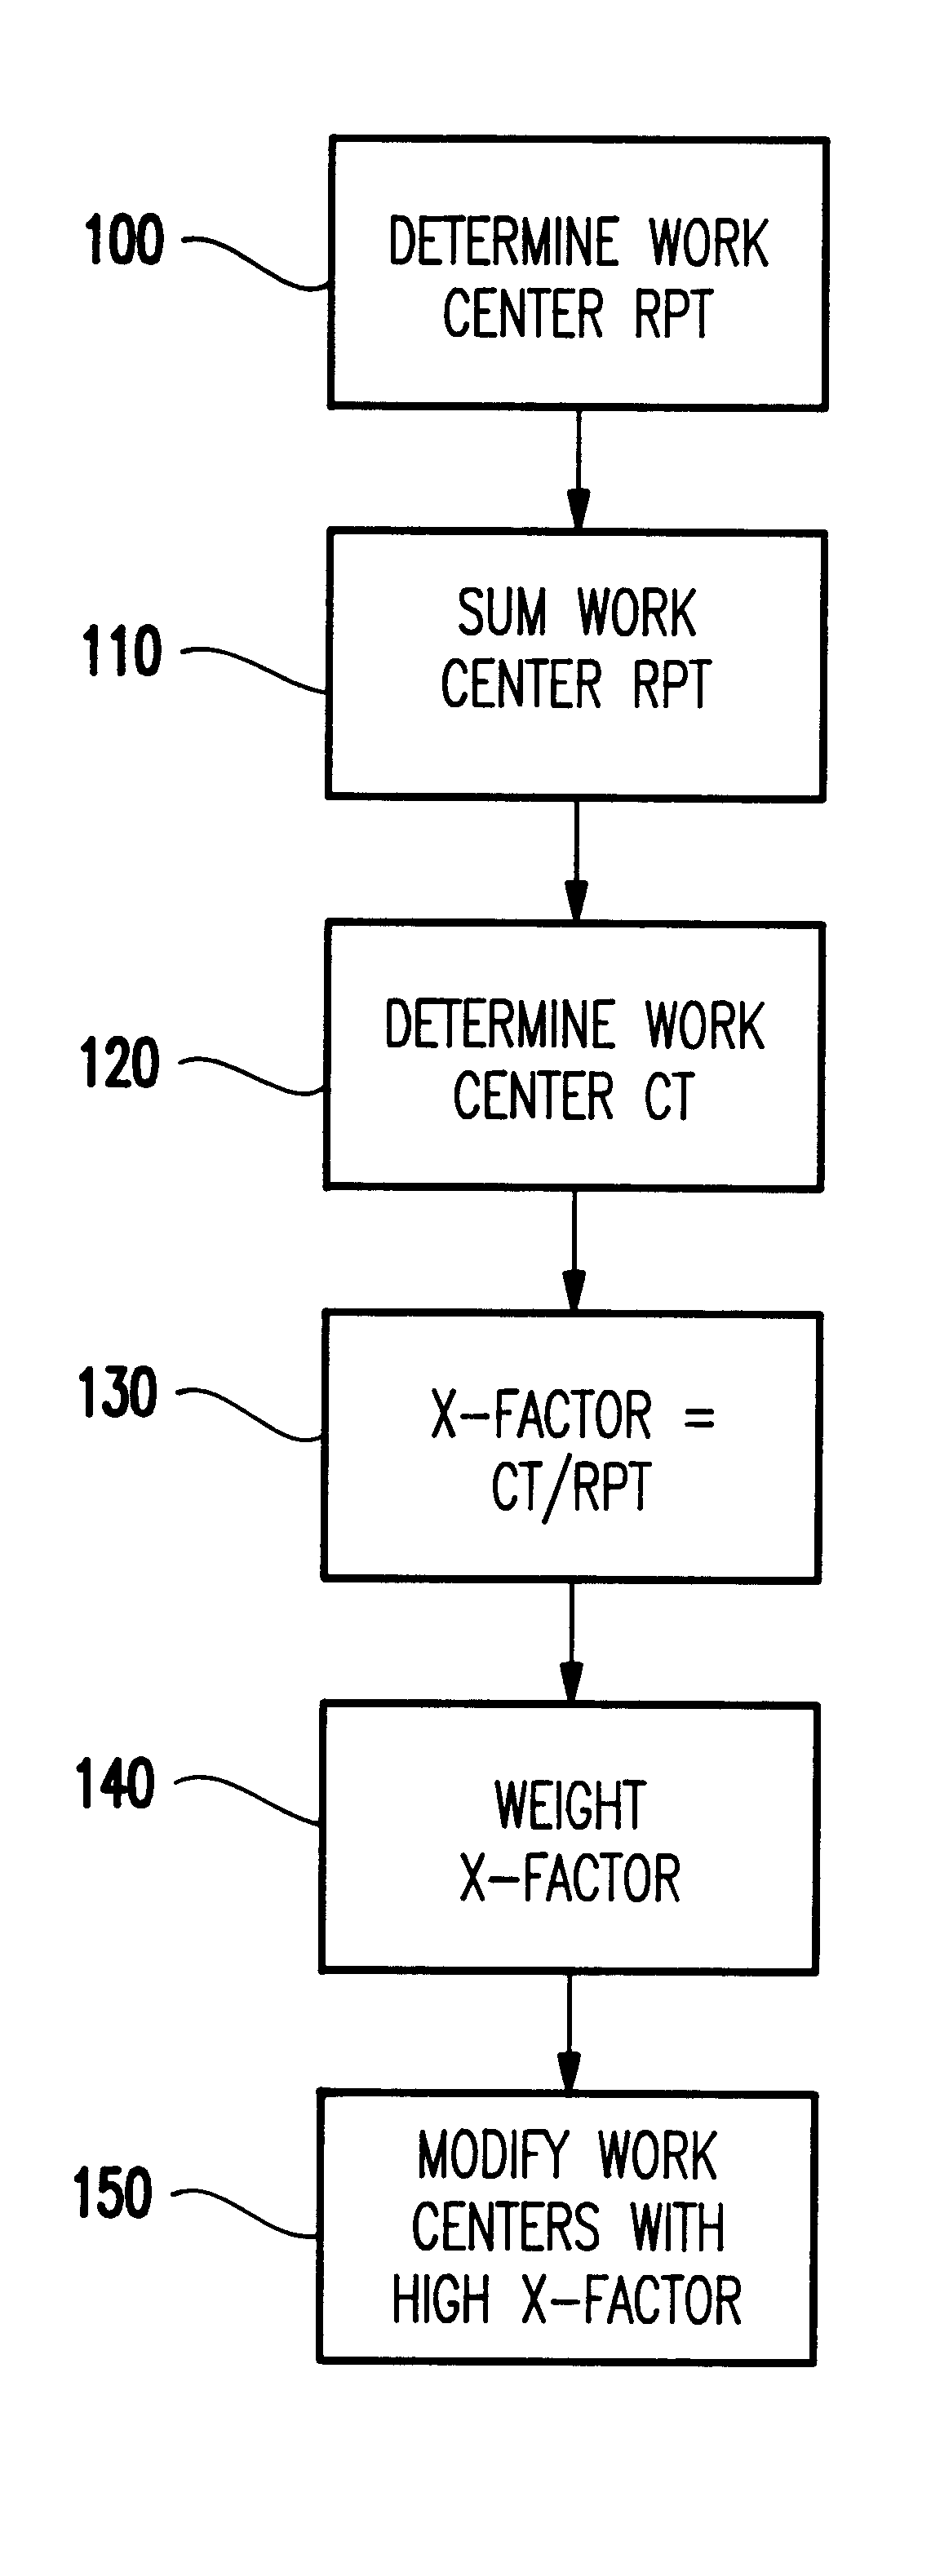
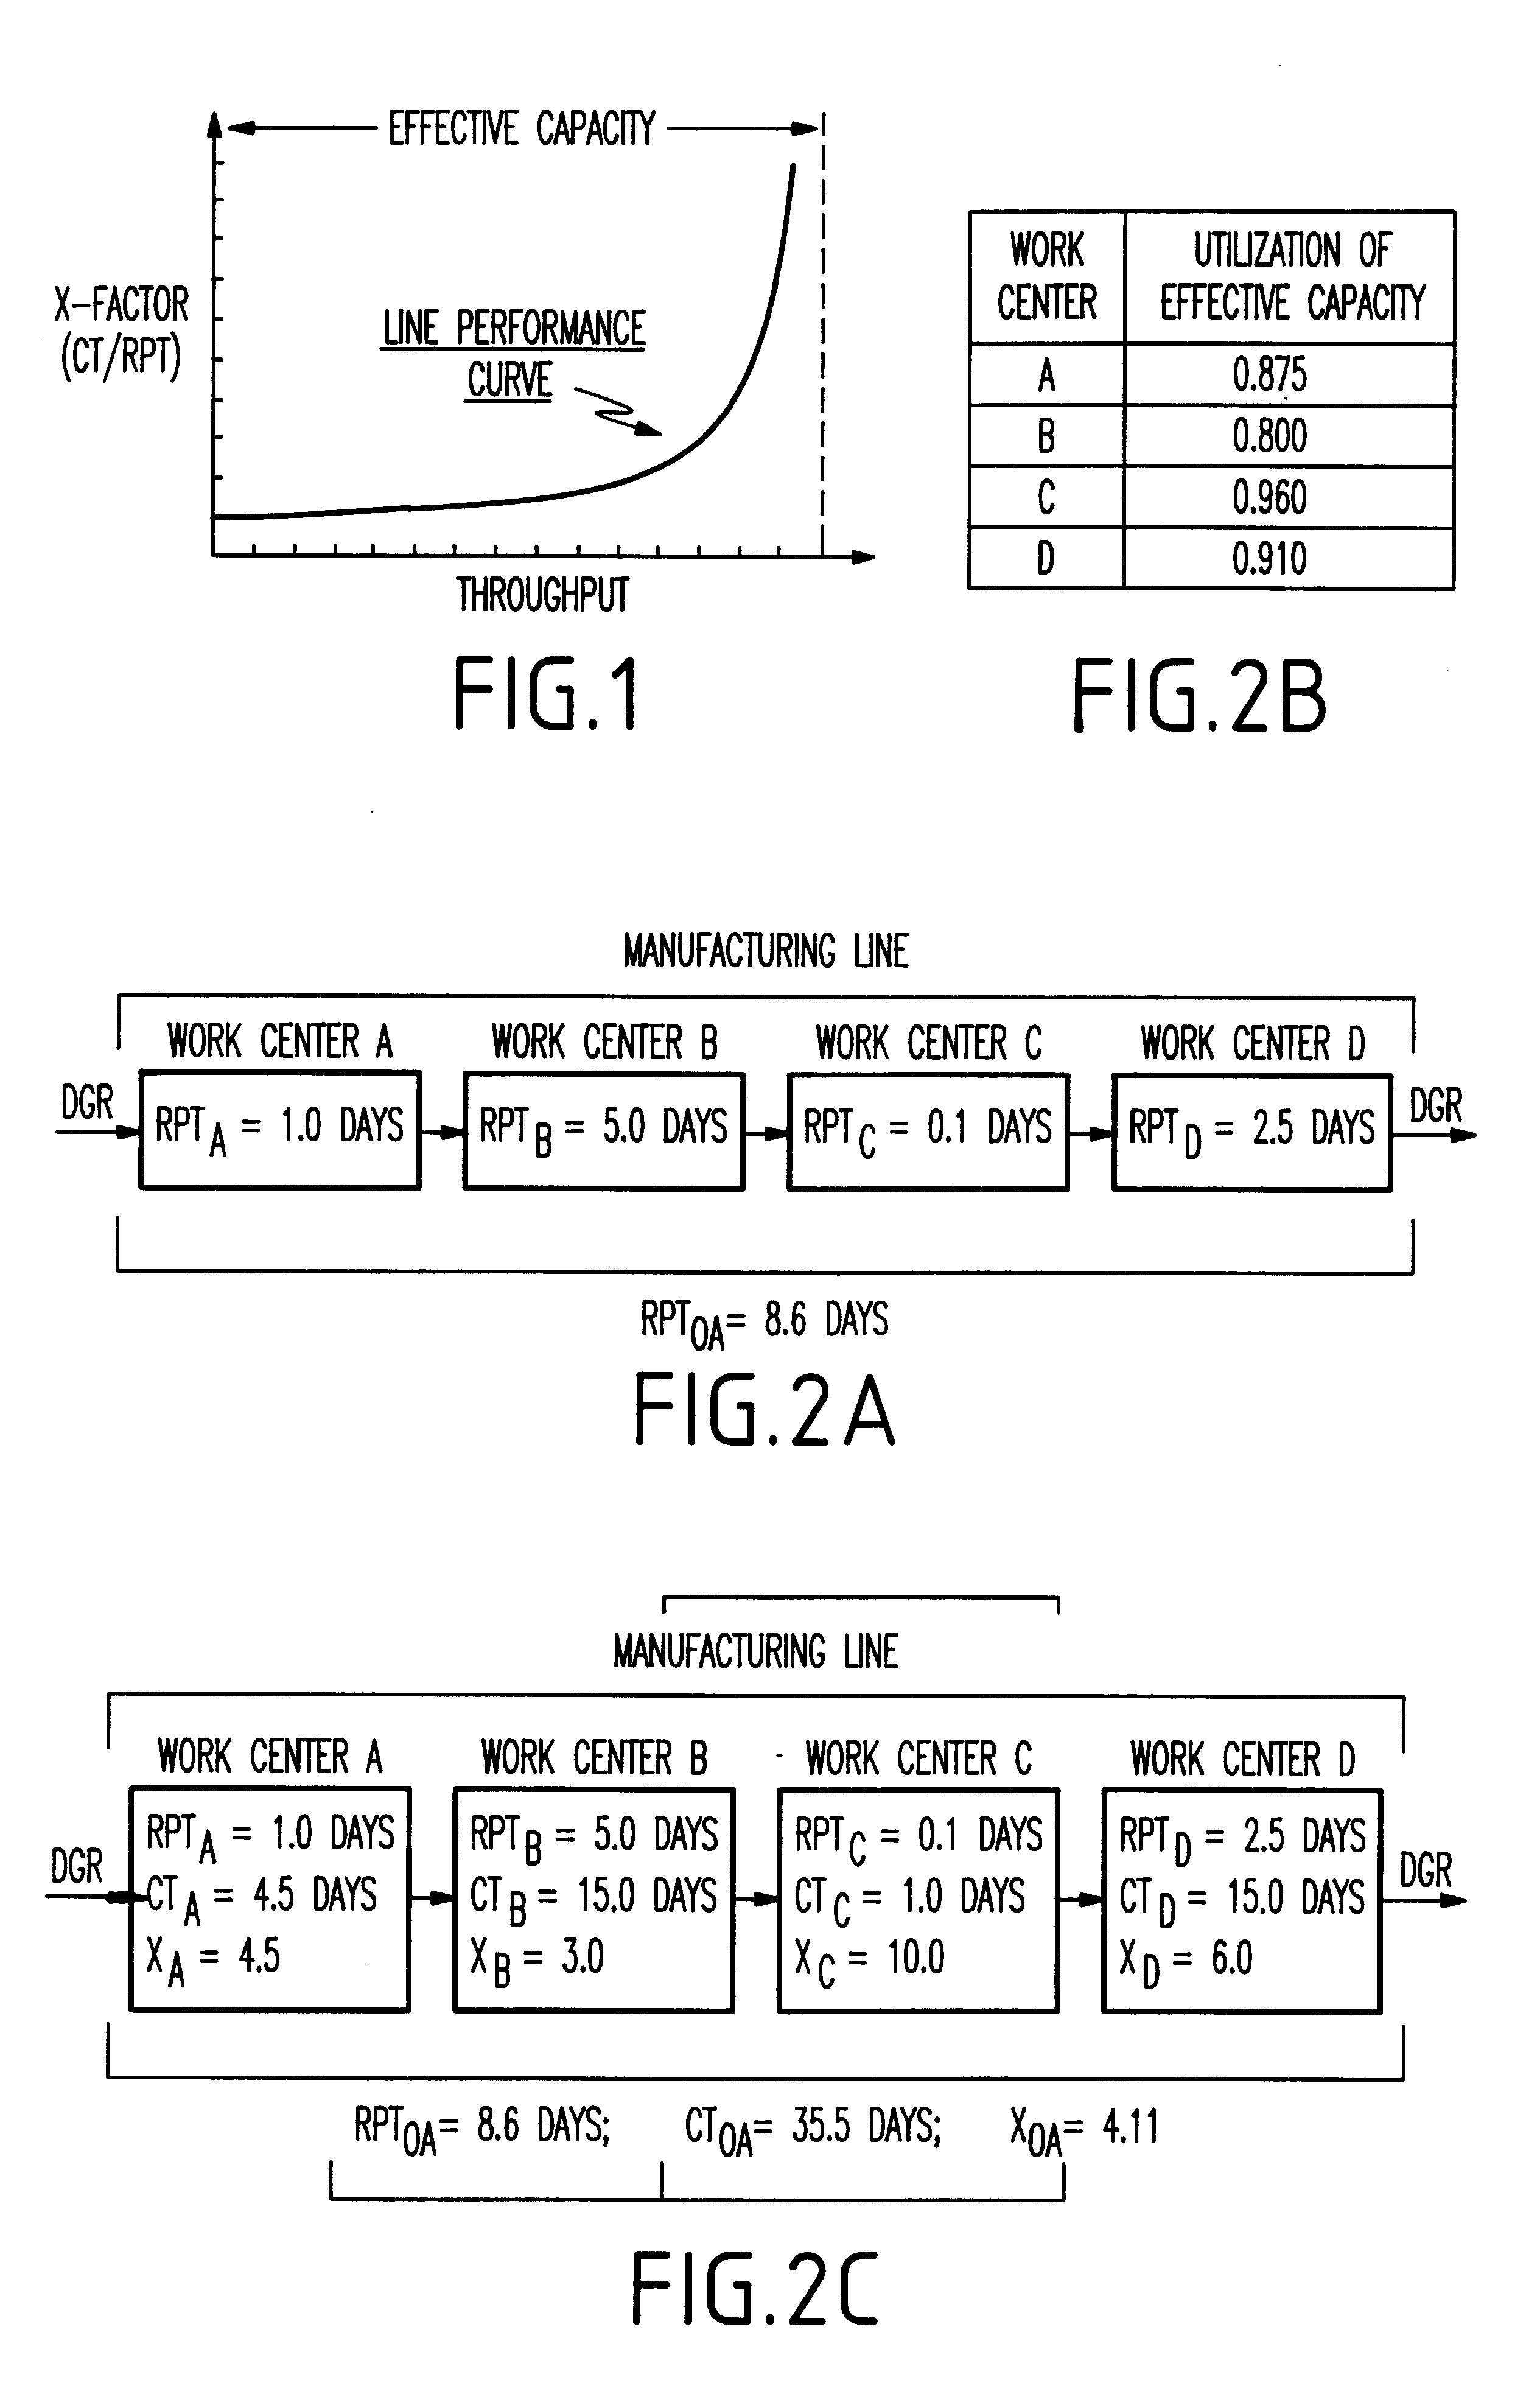
In semiconductor manufacturing an increase in utilization of effective capacity results in longer cycle times. For example, FIG. 1 illustrates a production line performance curve where an X-factor (normalized cycle time) is shown on the y-axis and throughput is shown on the x-axis. The X-factor is generally referred to as cycle time divided by raw process time where the cycle time is the time necessary for a workpiece to wait for the tool and be processed by the tool and raw processing time is only the time necessary for the tool to actually work on the workpiece. The "effective capacity" in FIG. 1 represents the maximum throughput available for a given production line.

A relationship exists between tool utilization and the normalized cycle time (X-factor) of the product moving through these tools. For example, an equation to describe this interrelationship can be expressed as ##EQU1##

where UTIL represents the utilization of the effective capacity of a given tool or toolset. Equation...


PUM


Abstract

A process for optimizing a manufacturing line comprises determining work center raw processing times of a plurality of work centers in the manufacturing line, summing the work center raw processing times to produce a manufacturing line raw processing time, determining work center cycle times of the work centers, dividing the work center cycle times by respective ones of the work center raw processing times to produce work center X-factors, weighting each of the work center X-factors by a percentage that a corresponding one of the work center raw processing times represents of the manufacturing line raw processing time to produce X-factor contributions for each of the work centers and modifying at least one work center of the work centers having an X-factor contribution higher than others of the X-factor contributions to reduce the X-factor contribution of the at least one work center.

Description

1. Field of the InventionThe invention is directed to determining which tools or toolset have the greatest impact on manufacturing line performance and more particularly to a method for determining the performance components of a manufacturing line.2. Description of the Related ArtOver the past two decades continuous flow manufacturing (CFM) has been the principle operational tool to help manage and improve the utilization of manufacturing assets. As the name connotes, the key focus of CFM is to measure and manage the throughput of tools / toolsets that comprise the manufacturing line. To this end, there have been a variety of systems proposed to help manage throughput with their attendant control methodologies.Semiconductor manufacturing is faced with significant investment and cost challenges. The investment required to build and tool a semiconductor manufacturing line has steadily increased so that now in excess of $1 Billion is needed. In addition, the industry has been characteri...

Claims


Application Information

Patent Timeline
IPC IPC(8): G06Q10/00G06Q10/06
CPCG06Q10/06
Inventor MARTIN, DONALD P.
Owner IBM CORP
Why Eureka
Try Eureka