Visualization of multi-dimensional data having an unbounded dimension

a multi-dimensional data and unbounded dimension technology, applied in the field of unbounded dimension visualization of multi-dimensional data, can solve the problems of false impressions concerning the duration or level of importance of different data, the fisheye technique for visualizing data does not facilitate the visualization of periodic data, and does not help view relationships between spaced apart items

Inactive Publication Date: 2004-11-16
MICROSOFT TECH LICENSING LLC
View PDF6 Cites 216 Cited by
  • Summary
  • Abstract
  • Description
  • Claims
  • Application Information

AI Technical Summary

Benefits of technology

in order to provide a basic understanding of some aspects of the invention. This summary is not an extensive overview of the invention. It is intended to neither identify key or critical elements of the i

Problems solved by technology

As a result, a fisheye technique for visualizing data does not facilitate visualization of periodic data nor does it help view relationships between spa

Method used


Image

  • Visualization of multi-dimensional data having an unbounded dimension
  • Visualization of multi-dimensional data having an unbounded dimension
  • Visualization of multi-dimensional data having an unbounded dimension

Examples


Embodiment Construction

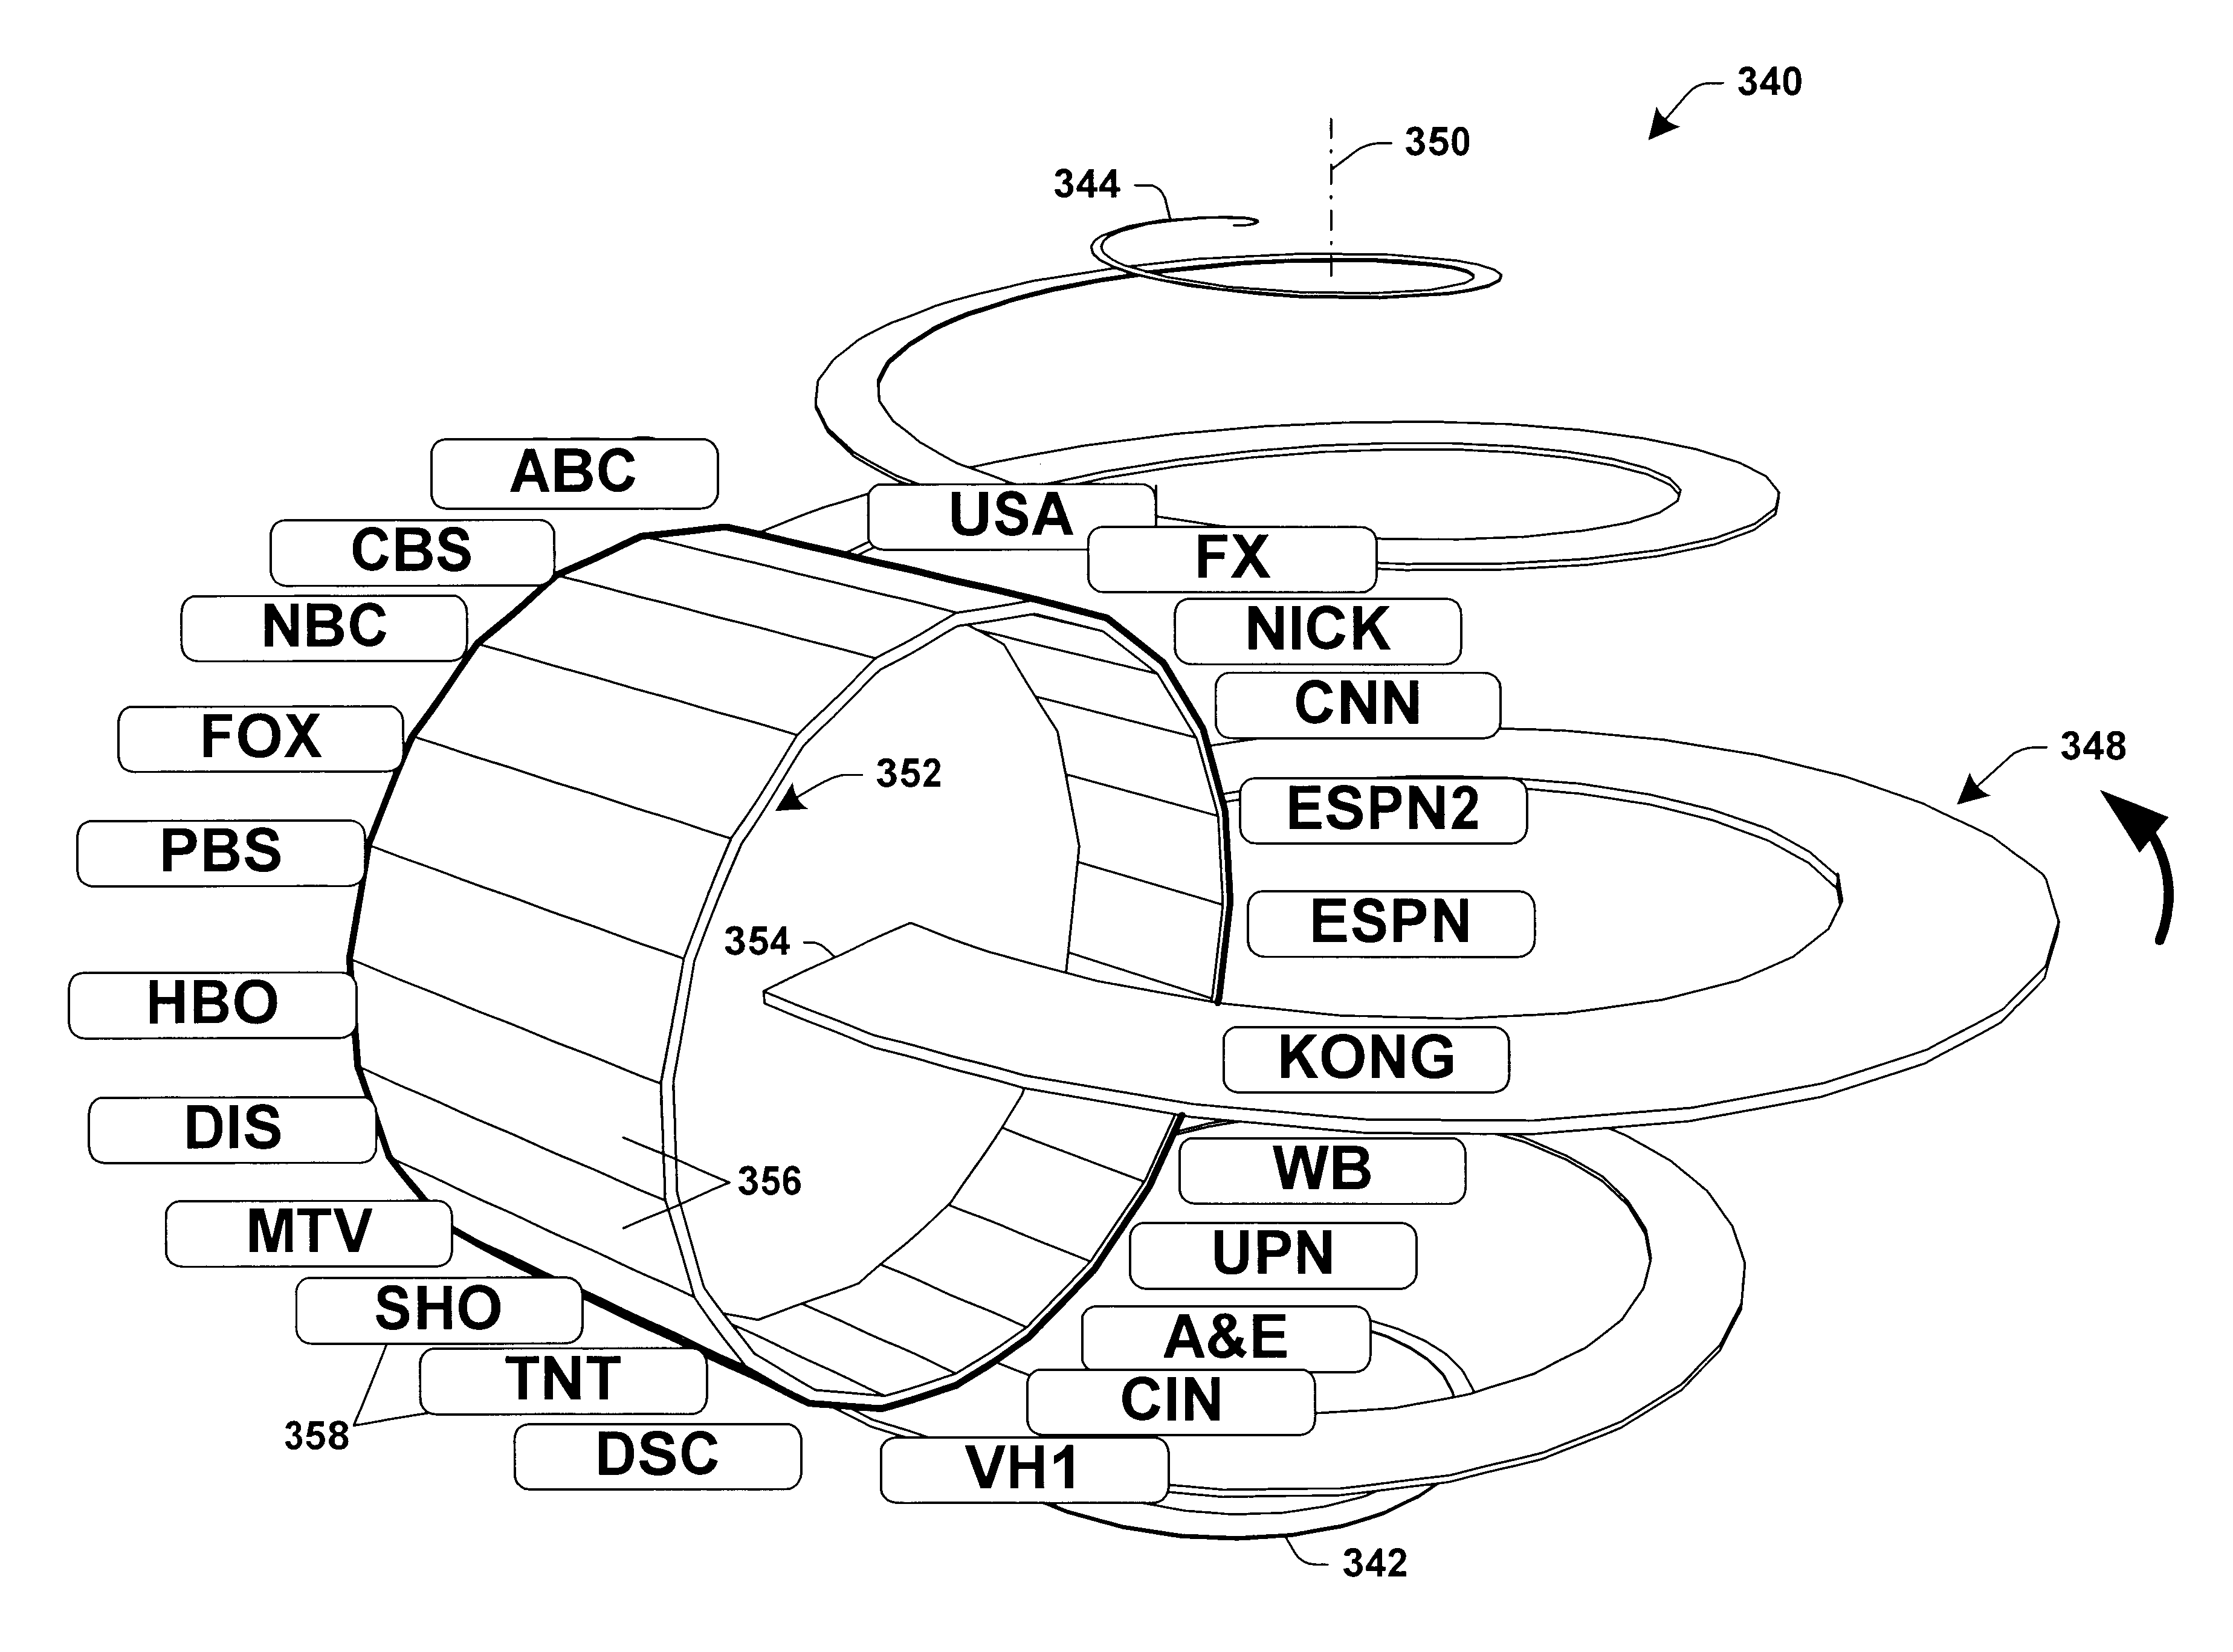
The present invention provides a system and method to facilitate visualization of multi-dimensional data having at least one unbounded dimension. The data is selectively mapped into a three-dimensional helical path having a central axis from which a helical sidewall is radially spaced. An associated user interface may be provided for selecting a segment of interest and, in turn, visualizing one or more other dimensions of data associated with the selected segment.

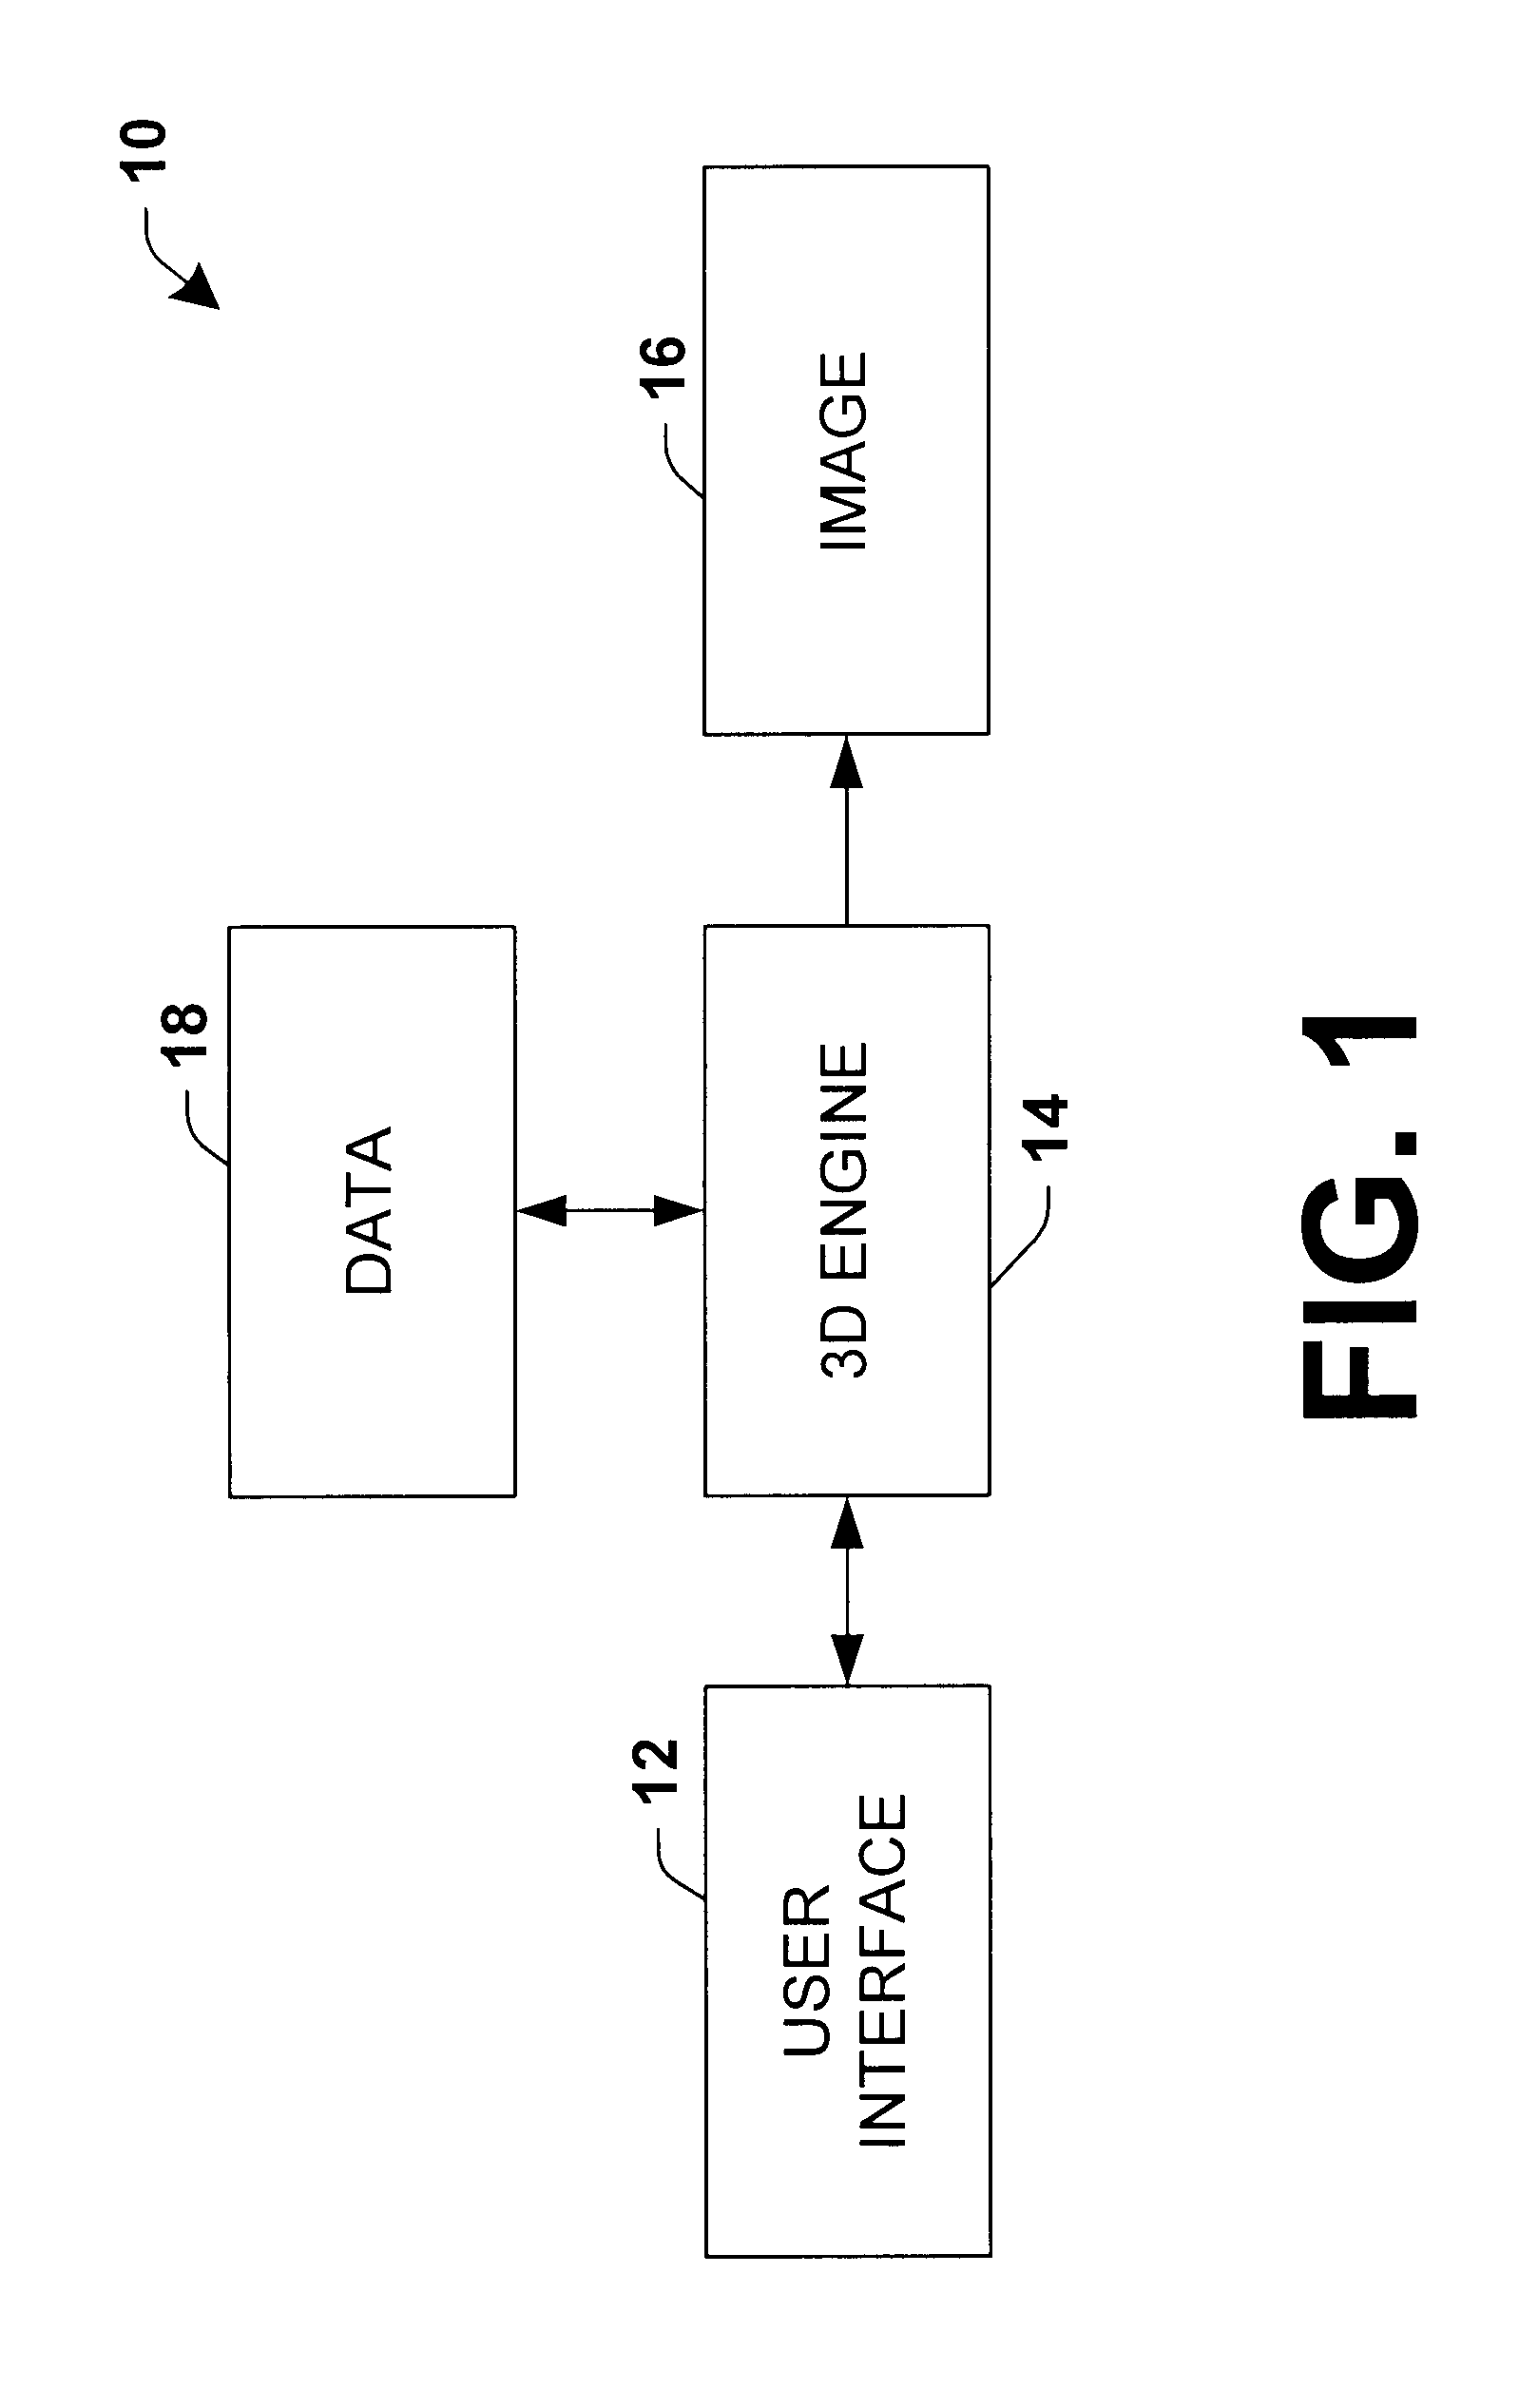
FIG. 1 is a simplified block diagram of a system 10 that may be utilized to visualize multi-dimensional data in accordance with an aspect of the present invention. The system 10 includes a user interface 12 that is operatively coupled to a graphical engine 14 for controlling a graphical display of an associated three-dimensional image 16. The image 16 provides a two-dimensional representation of a three-dimensional spiral and / or helical path having features programmed to interactively visualize stored multi-dimensional data...


PUM


Abstract

An interactive visualization of stored data includes a representation of a three-dimensional generally helical path extending between spaced apart ends of the path. Selected parts of the stored data are mapped to corresponding parts of the helical path to facilitate visualization of the stored data. The stored data may include an unbounded dimension (e.g., time) that is mapped along the helical path. One or more user interface elements may be associated with the helical path to effect display of additional information associated with a selected part of the path.

Description

The present invention relates to computer programming and, more particularly, to a system and method to facilitate visualization of multi-dimensional data.A goal of information visualization is to use computer graphics to utilize human perceptual processes in organizing and understanding data, such as may pertain to physical phenomena, including semantic domains. Informational elements that are to be visualized often have only semantic properties with no inherent spatial form that may be employed to create a visual representation. Accordingly, spatial ordering used in a display should be implemented as part of the visualization process. Viewed in this way, information visualization generally requires three components: data organization, visual spatial representations of the data organization, as well as display and interaction elements.Various information visualization techniques have been implemented to display different types of data in an organized and logical manner. In general,...

Claims


Application Information

Patent Timeline
IPC IPC(8): G06T11/20
CPCG06T11/206
Inventor ROBBINS, DANIEL C.
Owner MICROSOFT TECH LICENSING LLC
Why Eureka
Try Eureka