Performance improvement for hematology analysis

a technology of hematology and performance improvement, applied in the field of data analysis, can solve problems such as process aged samples of blood, and inability to perform follow-up investigations,

Inactive Publication Date: 2005-07-12
ABBOTT LAB INC
View PDF5 Cites 11 Cited by
  • Summary
  • Abstract
  • Description
  • Claims
  • Application Information

AI Technical Summary

Benefits of technology

[0015]The method of this invention allows an automated hematology analyzer to provide a more reliable indication of the initial value of MCV of a sample of blood, i.e., the value of MCV that would have been expected for the sample of blood when the sample was fresh. The method of this invention enables one to make a reasonable estimate of the initial value of MCV

Problems solved by technology

These increases can be of sufficient magnitude to result in improper classification of hematology results, thereby resulting in a problem for laboratories that are required to process aged samples of blood.
Improper classification of aged samples of blood can lead to such problems as failing to perform follow-up investigations in microcytic patients whose value of MCV has been overestimated, and, consequen

Method used


Image

  • Performance improvement for hematology analysis
  • Performance improvement for hematology analysis
  • Performance improvement for hematology analysis

Examples


example 1

[0036]In the following example, the “CELL-DYN” 4000 hematology analyzer, commercially available from Abbott Laboratories, was used for the generation of the data. One hundred (100) samples of blood were used to establish the regression relationship between the value of MCH and the value of MCHC. Conventional least squares linear regression was used to derive the slope (constant “a”) and the y-intercept (constant “b”), which constants will vary from instrument model to instrument model. In the linear regression analysis shown in FIG. 4, the constant “a” is 0.2929 and the constant “b” is 24.514. Consequently, if the value of MCH of the sample of blood were 30 pg, the value of MCV measured were 100 fl, and the value of MCHC measured were 30 g / dl, then:

Calculated Value of MCHC=30×0.2929+24.514=33.3 g / dl

Theoretical value of MCV=(30 / 33.3)×100=90.1 fl

Theoretical value of MCV=(30×100) / (30×0.2929)+24.524=90.1 fl

In this example, a value of MCV of 100 fl would be corrected by the method of t...

examples 2-5

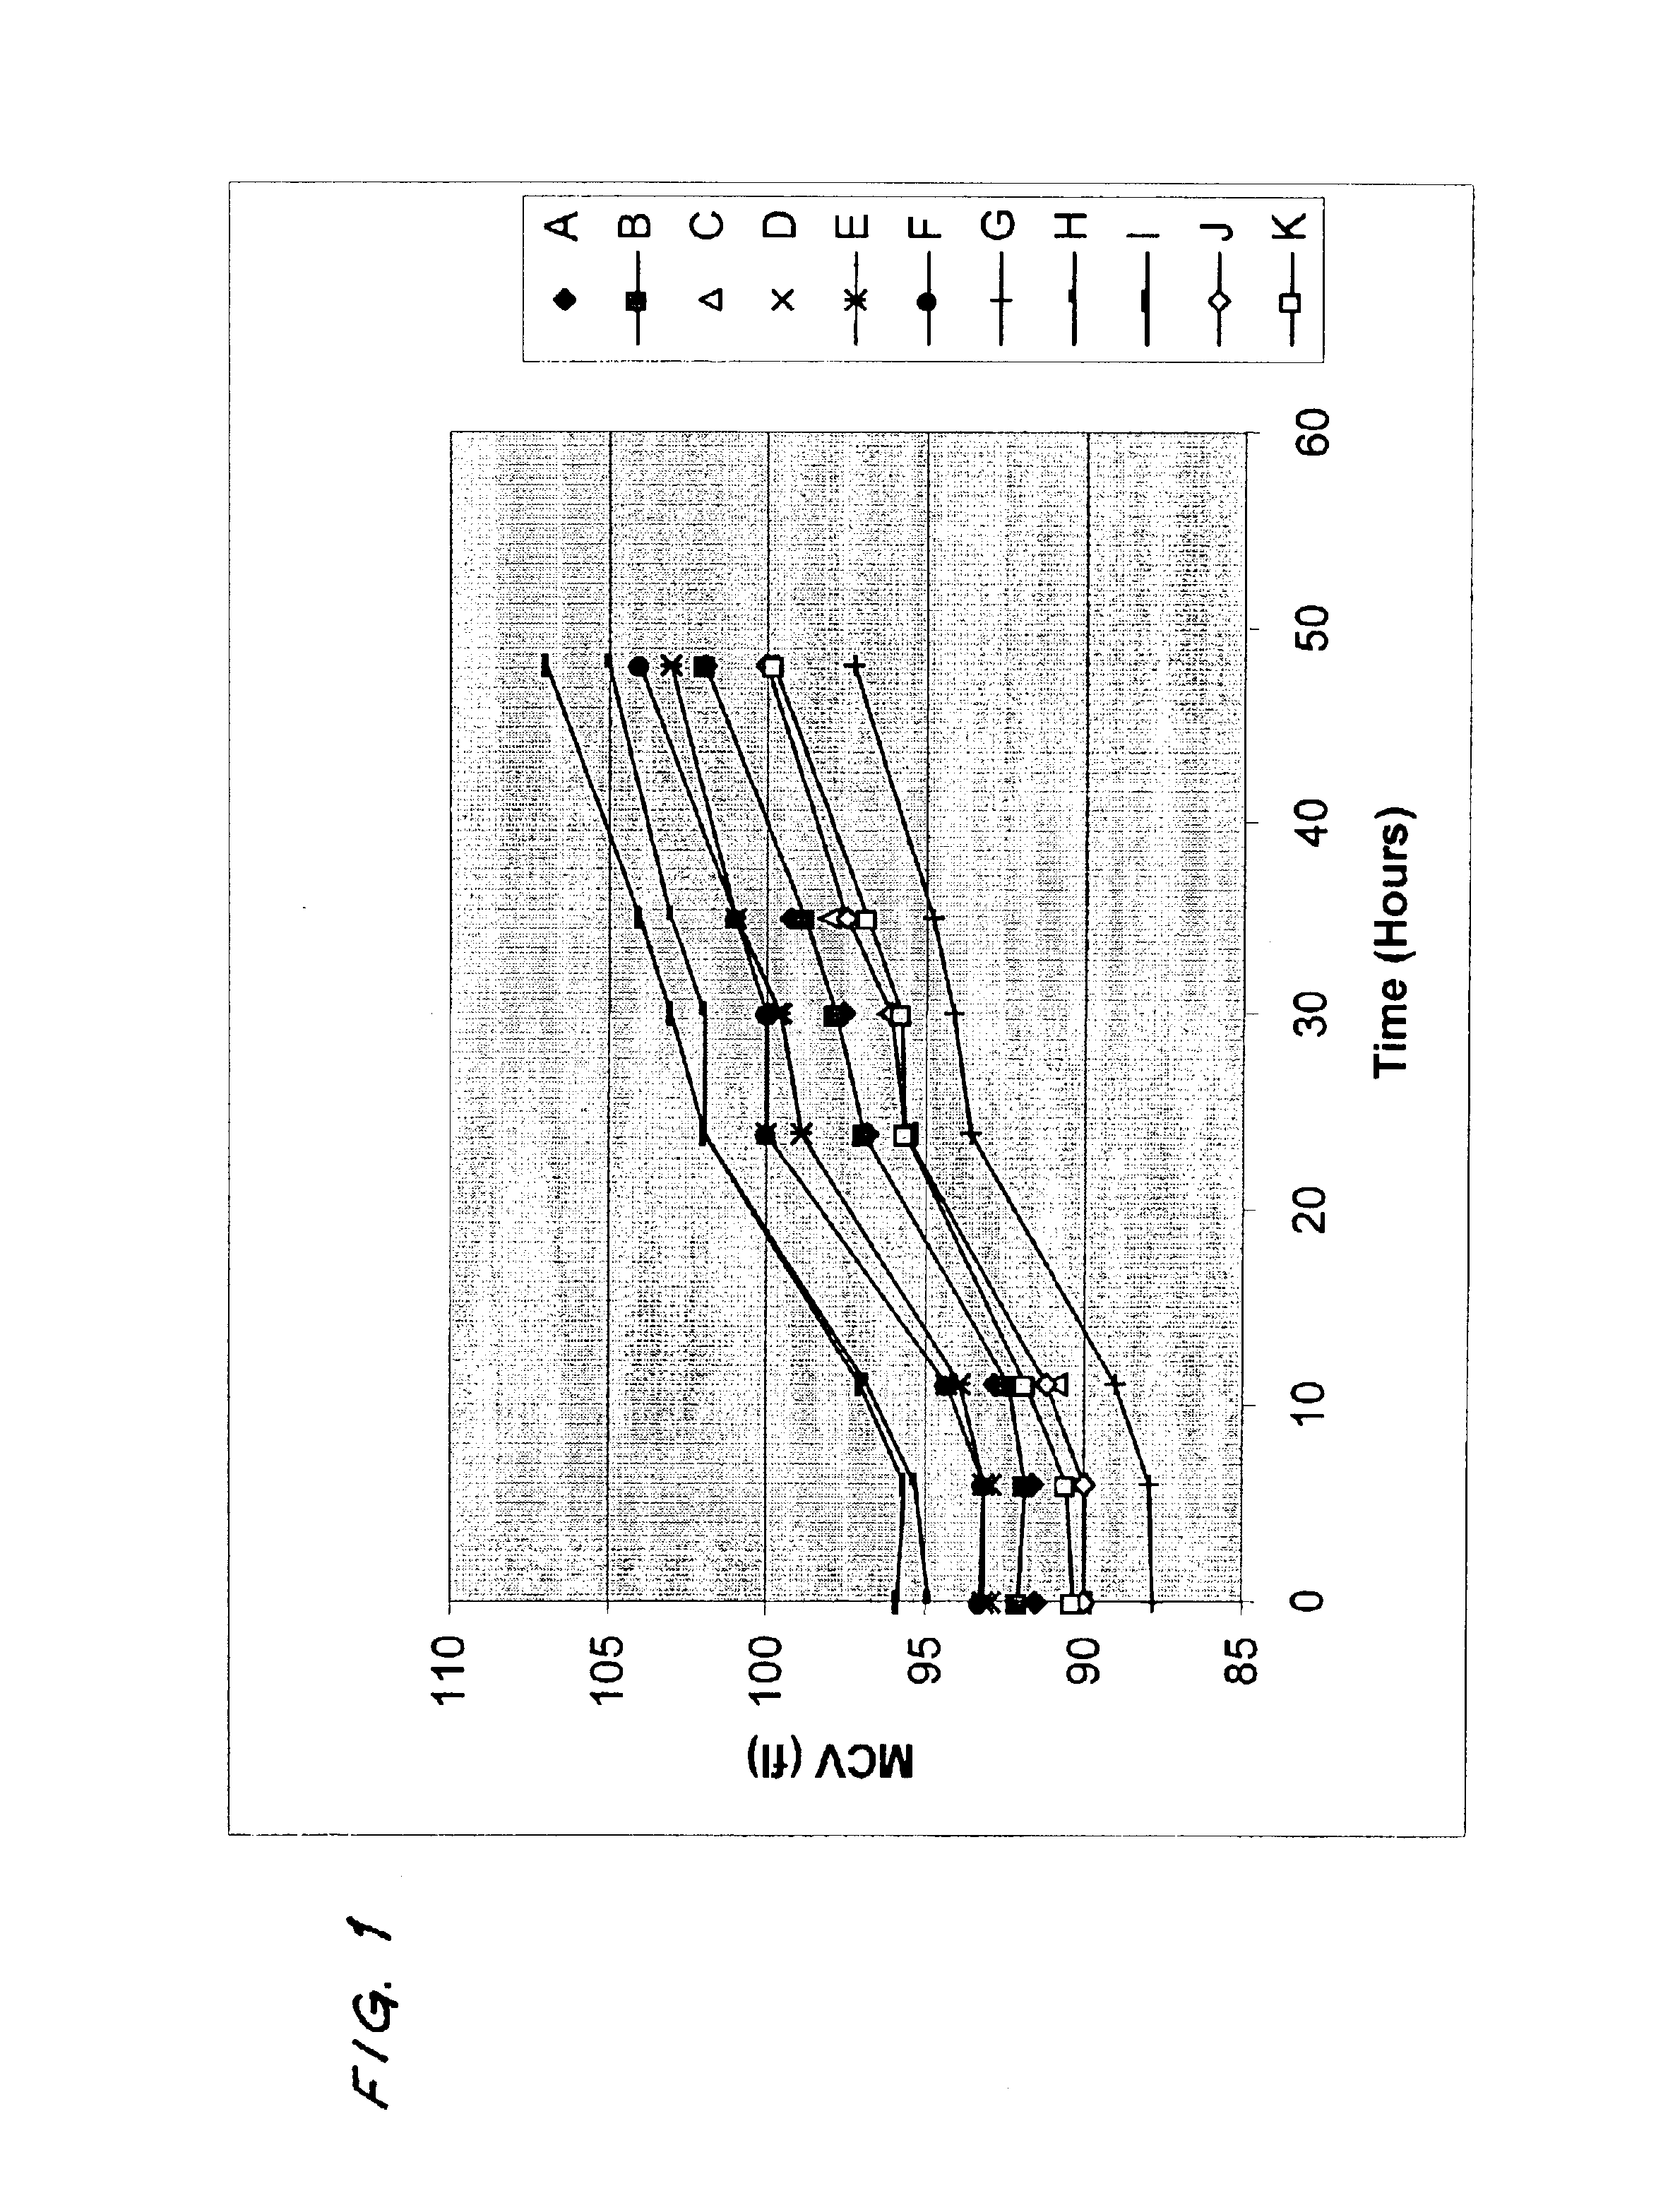
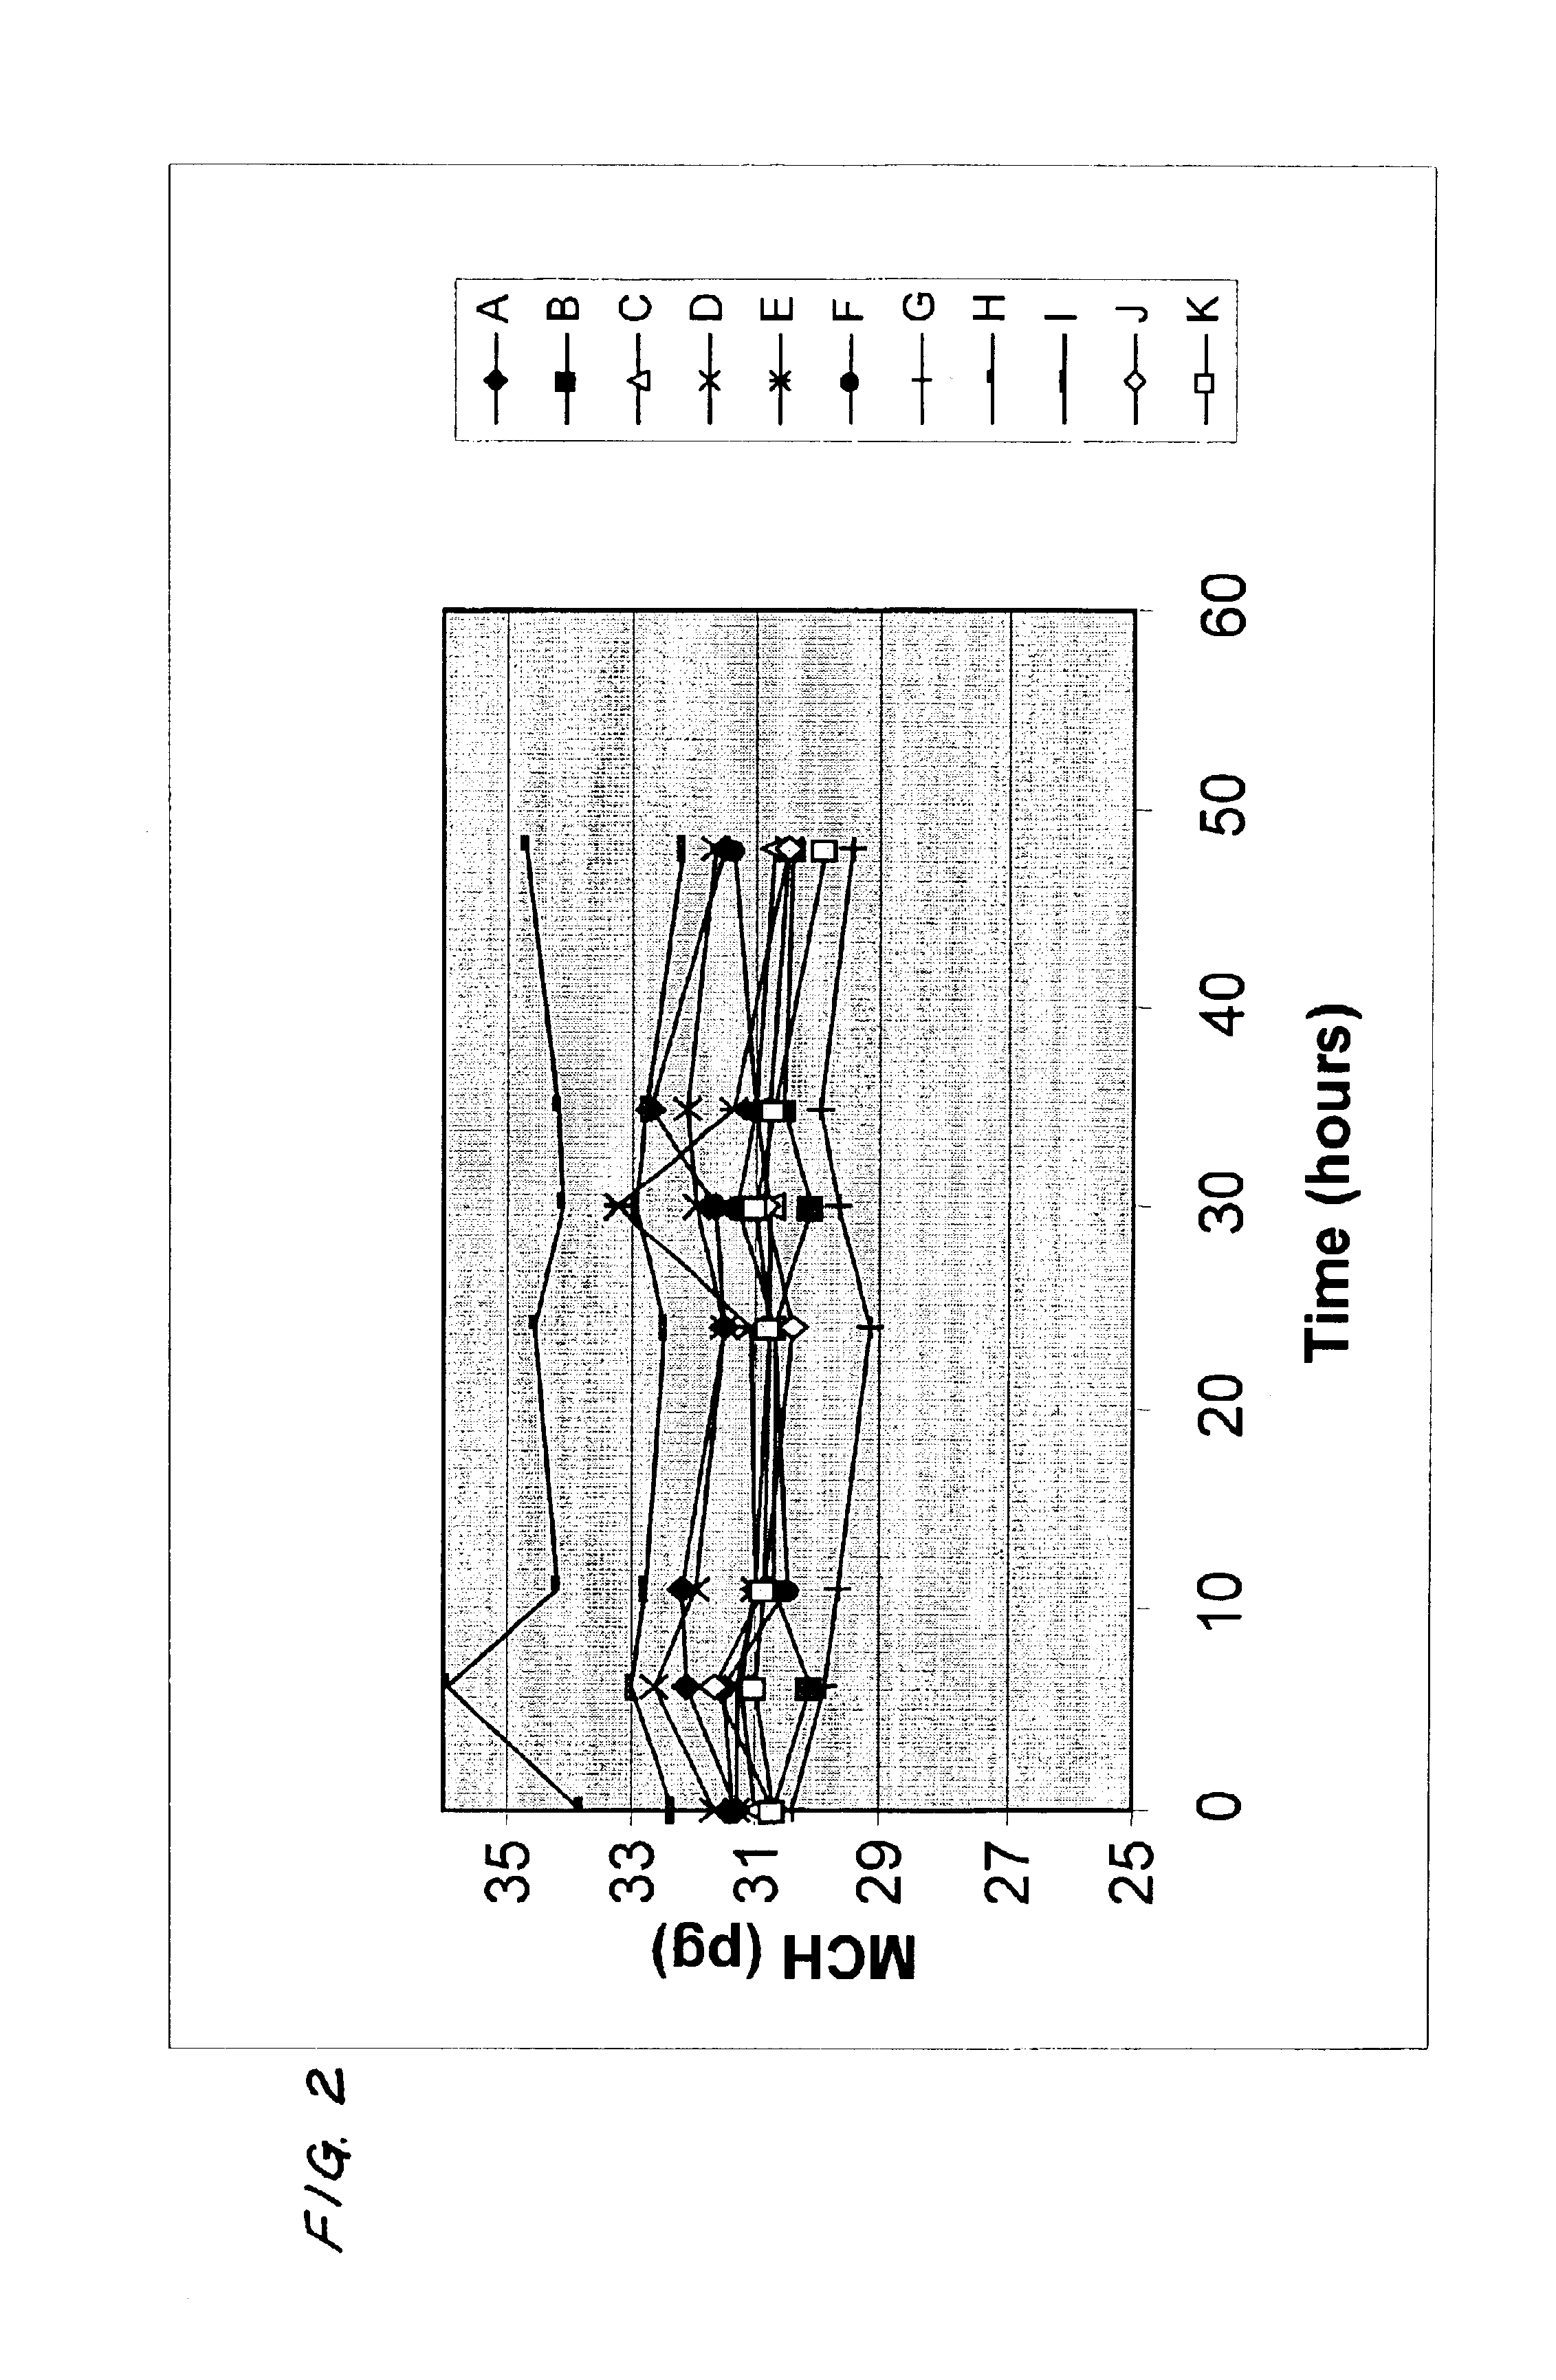
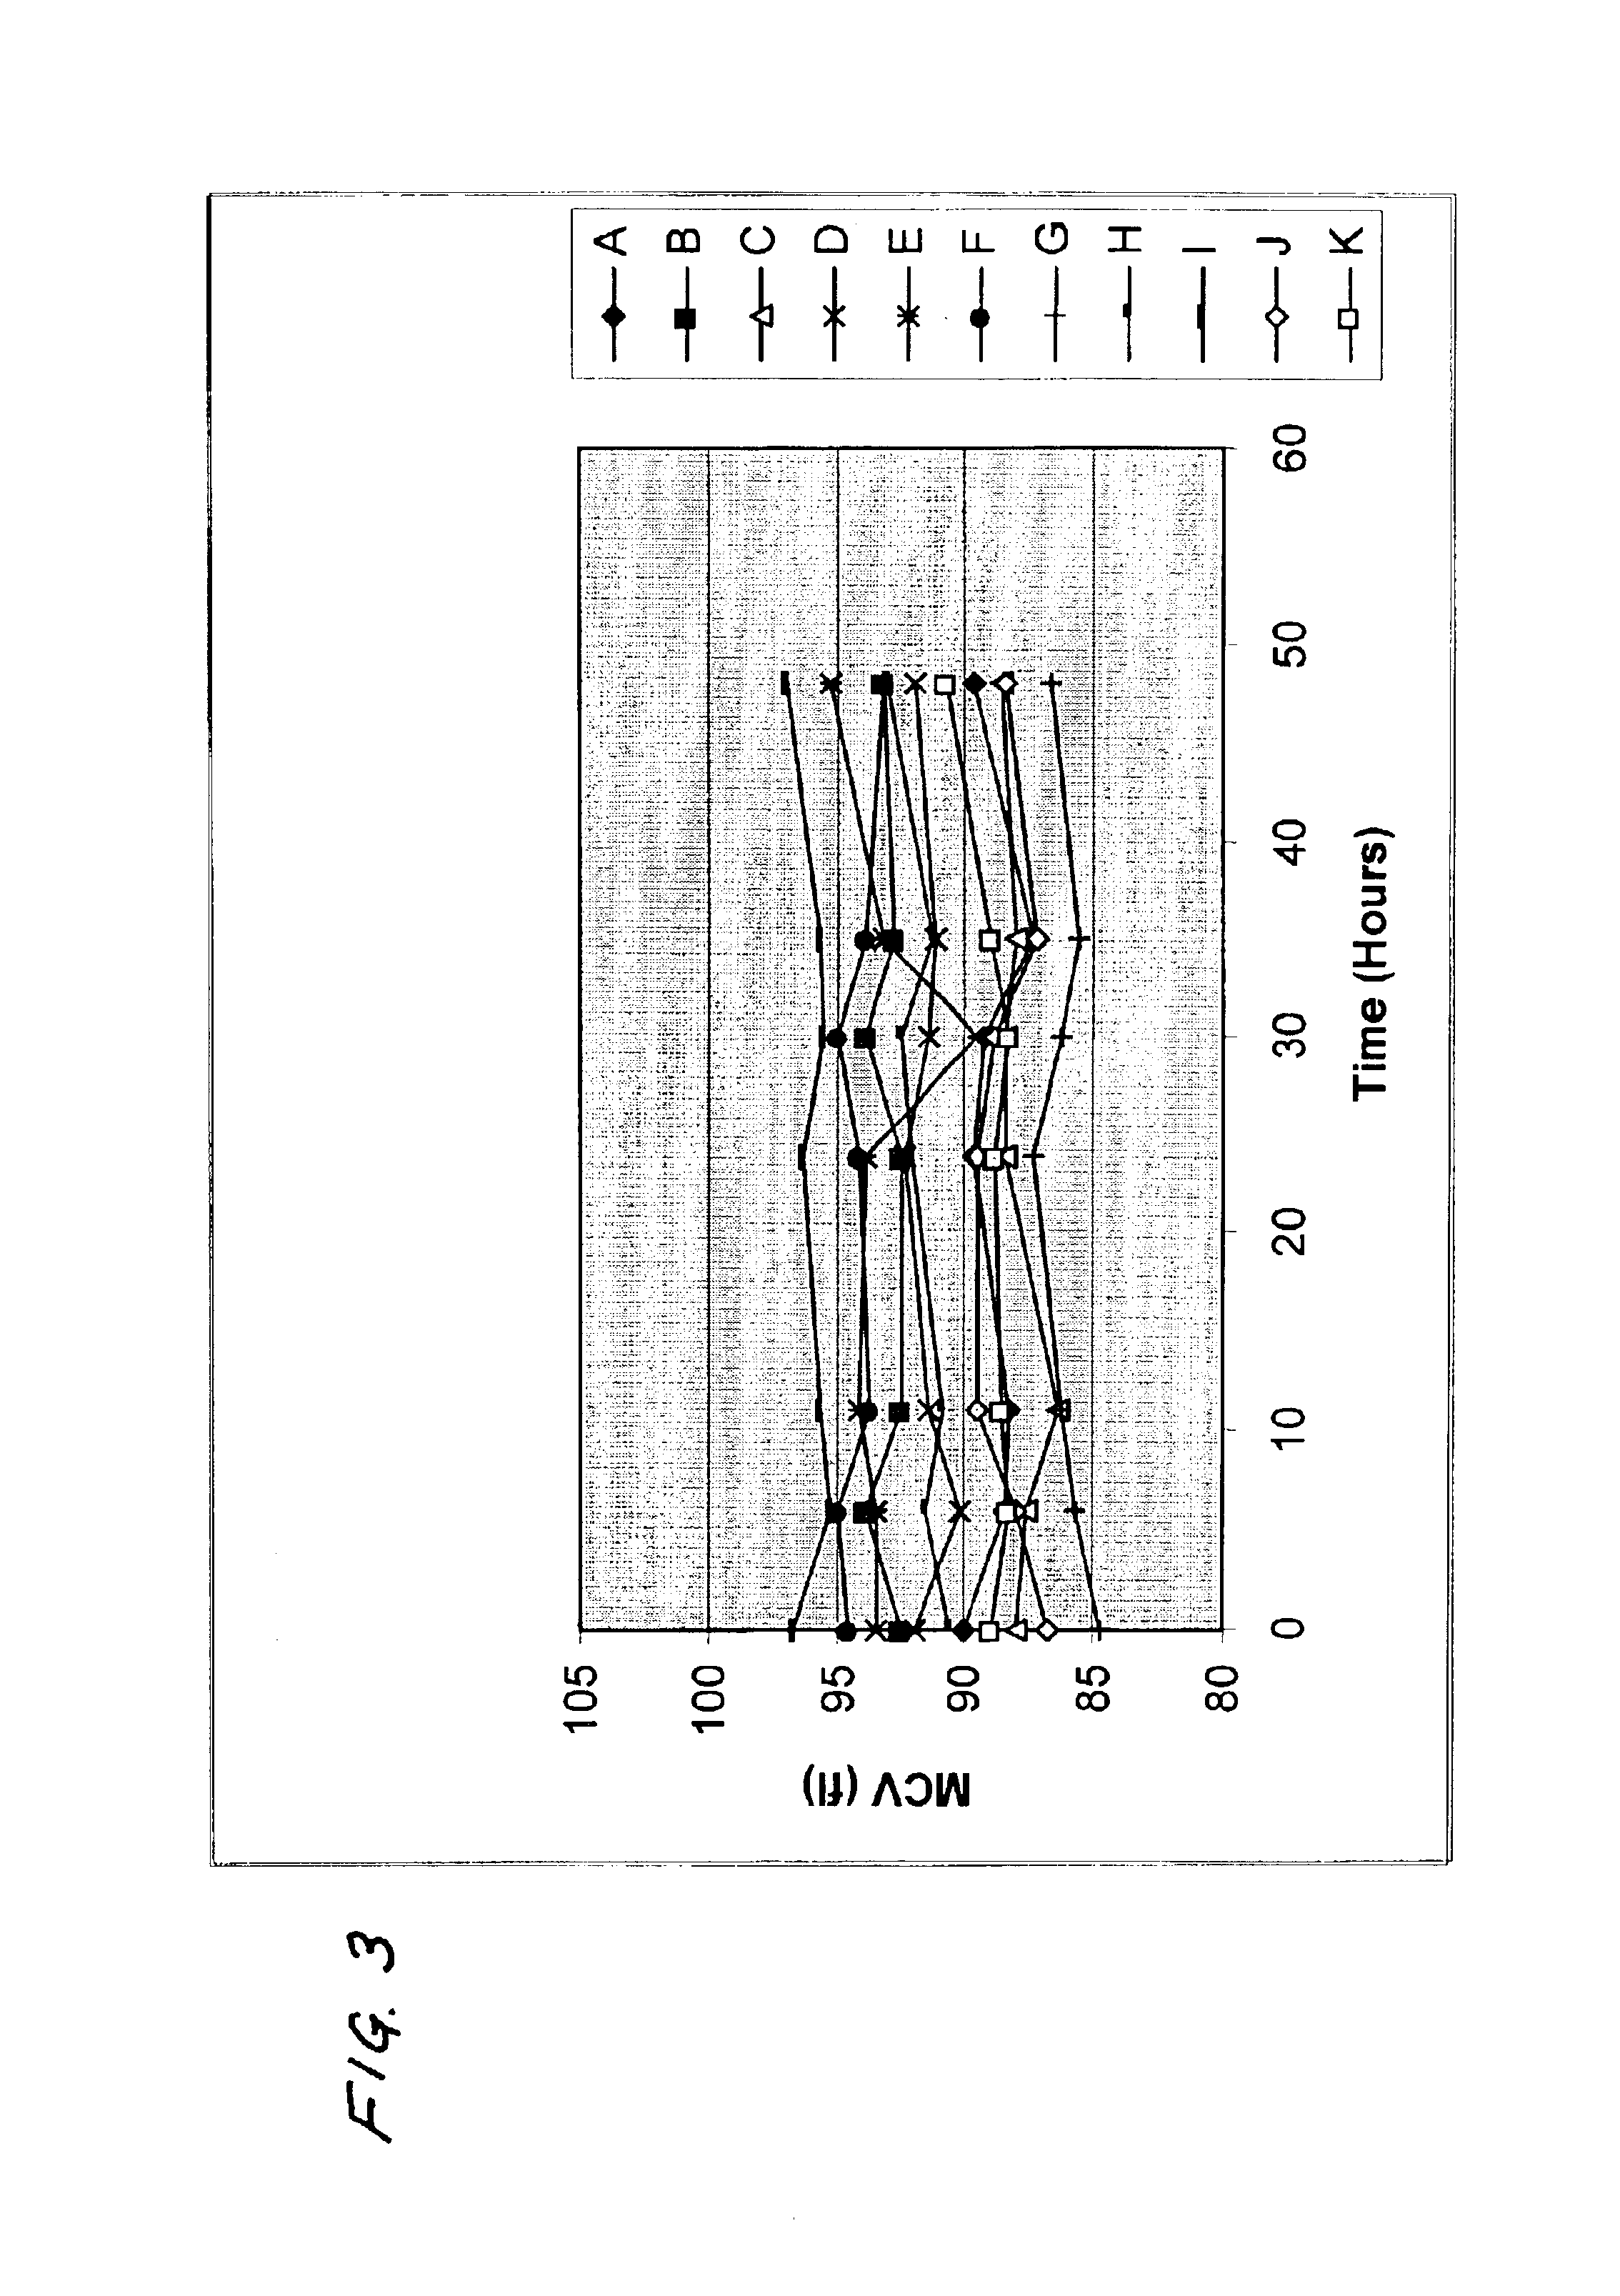
[0037]In these examples, the values of MCV measured after the samples were stored for 24 hours at room temperature and the initial values of MCV, as calculated by the method of this invention after the samples were stored for 24 hours at room temperature, were compared with the values of MCV measured prior to storage of the samples. Table 1 shows the results of the comparison for measurements made with four instruments commercially available from Abbott Laboratories.

[0038]

TABLE 1“CELL-“CELL-DYN”DYN”“CELL-DYN”“CELL-DYN”4000370032001200Change in value5.113.04.06.08of MCV ofsamplesobserved afterstorage at 24hours relative toinitial value ofMCV of samplesobserved (fl)Standard1.711.451.391.90deviation ofchange above (fl)Change in value0.3620.390.440.59of MCV ofsamplescalculated bymethod of thisinvention afterstorage at 24hours relative toinitial value ofMCV of samplesobserved (fl)Standard2.051.502.661.65deviation ofchange above (fl)

On a variety of “CELL-DYN” automated analyzers, the valu...


PUM


Abstract

A method for determining the value of MCV of a fresh sample of blood when the value of MCV for that sample of blood is known, but the period of time that the sample of blood has been stored is not known. The method of this invention allows an automated hematology analyzer to provide a more reliable indication of the initial value of MCV of a sample of blood, i.e., the value of MCV that would have been expected for the sample of blood when the sample was fresh. Furthermore, the method of this invention uses data that is readily available as part of the blood count data.

Description

BACKGROUND OF THE INVENTION[0001]1. Field of the Invention[0002]This invention relates to a method for analyzing data, and, more particularly, a method for analyzing data relating to hematology test results on aged samples of blood.[0003]2. Discussion of the Art[0004]Automated hematology analyzers are instruments that have been designed to completely automate the analysis of samples of blood. Typically, automated hematology analyzers are used to differentiate the individual blood cells in the samples, count the individual blood cells in the samples, and in some cases, estimate the size of the individual blood cells in the samples. The erythrocyte mean cell volume (hereinafter, alternately, “MCV”) is one of the key determinants used in the screening and classification of hematological disease. Automated hematology analyzers have the capability of accurately measuring the value of MCV as part of the blood count. The value of MCV is useful for the primary classification of various diso...

Claims


Application Information

Patent Timeline
IPC IPC(8): G01N33/72G01N33/80
CPCG01N33/721G01N33/80
Inventor KENDALL, RICHARD G.SCHISANO, THOMAS V.
Owner ABBOTT LAB INC
Why Eureka
Try Eureka