Process variable gauge interface and methods regarding same

a technology of variable gauge and user interface, applied in the field of process control, can solve the problems of large screen real estate needs to be devoted, users may have difficulty performing the required monitoring and control functions, and the effect of lack of effectiveness of such an interfa

Inactive Publication Date: 2005-10-04
HONEYWELL INC
View PDF27 Cites 61 Cited by
  • Summary
  • Abstract
  • Description
  • Claims
  • Application Information

AI Technical Summary

Benefits of technology

[0015]The present invention provides for a graphical user interface which allows the user to exploit his or her perceptual strengths in detecting and resolving process abnormalities. Further, the interface helps users, e.g., engineers and operators, to acquire a better understanding of a controller and determine what actions they can take to assist the controller.

Problems solved by technology

Although various types of screen displays have been used to present information regarding the controller to a user (e.g., those described in the Honeywell product publication entitled “Robust Multivariable Predictive Control Technology-RMPCT Users Guide for TPS (6 / 97) hereby incorporated herein by reference in its entirety and hereinafter referred to as “Honeywell Users Guide”) such that the user can monitor and manipulate parameters related to one or more process variables in the process being controlled thereby, the effectiveness of such an interface has been lacking and the users may have difficulties performing the required monitoring and control functions.
For example, one difficulty of monitoring multiple dynamic process variables in parallel is that generally a large amount of screen real estate needs to be devoted to the presentation of textual data with respect to such process variables.
For example, this is particularly a problem facing operators of nuclear, chemical, and petrochemical plants where the number of dynamic process variables is large.
However, this approach is still too real estate intensive in that it requires a great deal of space to display multiple trend history plots in parallel even for just a few process variables.
However, such displays do not provide adequate information and tools to use the matrix screen to support the user in problem solving tasks.
The use of such constraint-based techniques for controlling the process presents the problematic task of being able to monitor or keep track of the relationships between the various constraint limits and the current values for one process variable or a multiple number of process variables.
When monitoring a large number of such process variables, the task of formulating such relationships is difficult.
Currently, interface techniques used to present information to the user and provide the user a way of changing one or more parameters of a process variable have been ineffective.
However, such approaches suffer from at least three problems.
First, they are difficult to use, either because they necessitate extensive cognitive manipulation of quantitative data or because they are incomplete in their integration.
For example, when some graphics have been used with textual material, the graphics have not effectively presented such information to the user.
However, such separate display of the elements lacks integration for easy monitoring of the process variable.
Second, by having the different limit relationships displayed independently, valuable screen real estate is used up making it impossible to show more than just a few process parameters at a time.
Third, none of the existing graphical approaches allow for direct manipulation of the variable limits.
As indicated above, the displays used to convey information to a user for monitoring and manipulation of process variables, e.g., process variables of a controller providing control of a continuous multivariable production process, are not effective.
For example, one particular problem involves the use of a great deal of textual information which requires the user to formulate relationships between different process variables of the controller (e.g., formulate relationships between current values and process limits, formulate relationships from the textual matter between trends of multiple process variables, etc.).
Yet further, such conventional displays which attempt to provide adequate information for a user, e.g., trend plots, textual information, etc., require an undesirable amount of screen real estate.

Method used


Image

  • Process variable gauge interface and methods regarding same
  • Process variable gauge interface and methods regarding same
  • Process variable gauge interface and methods regarding same

Examples


Embodiment Construction

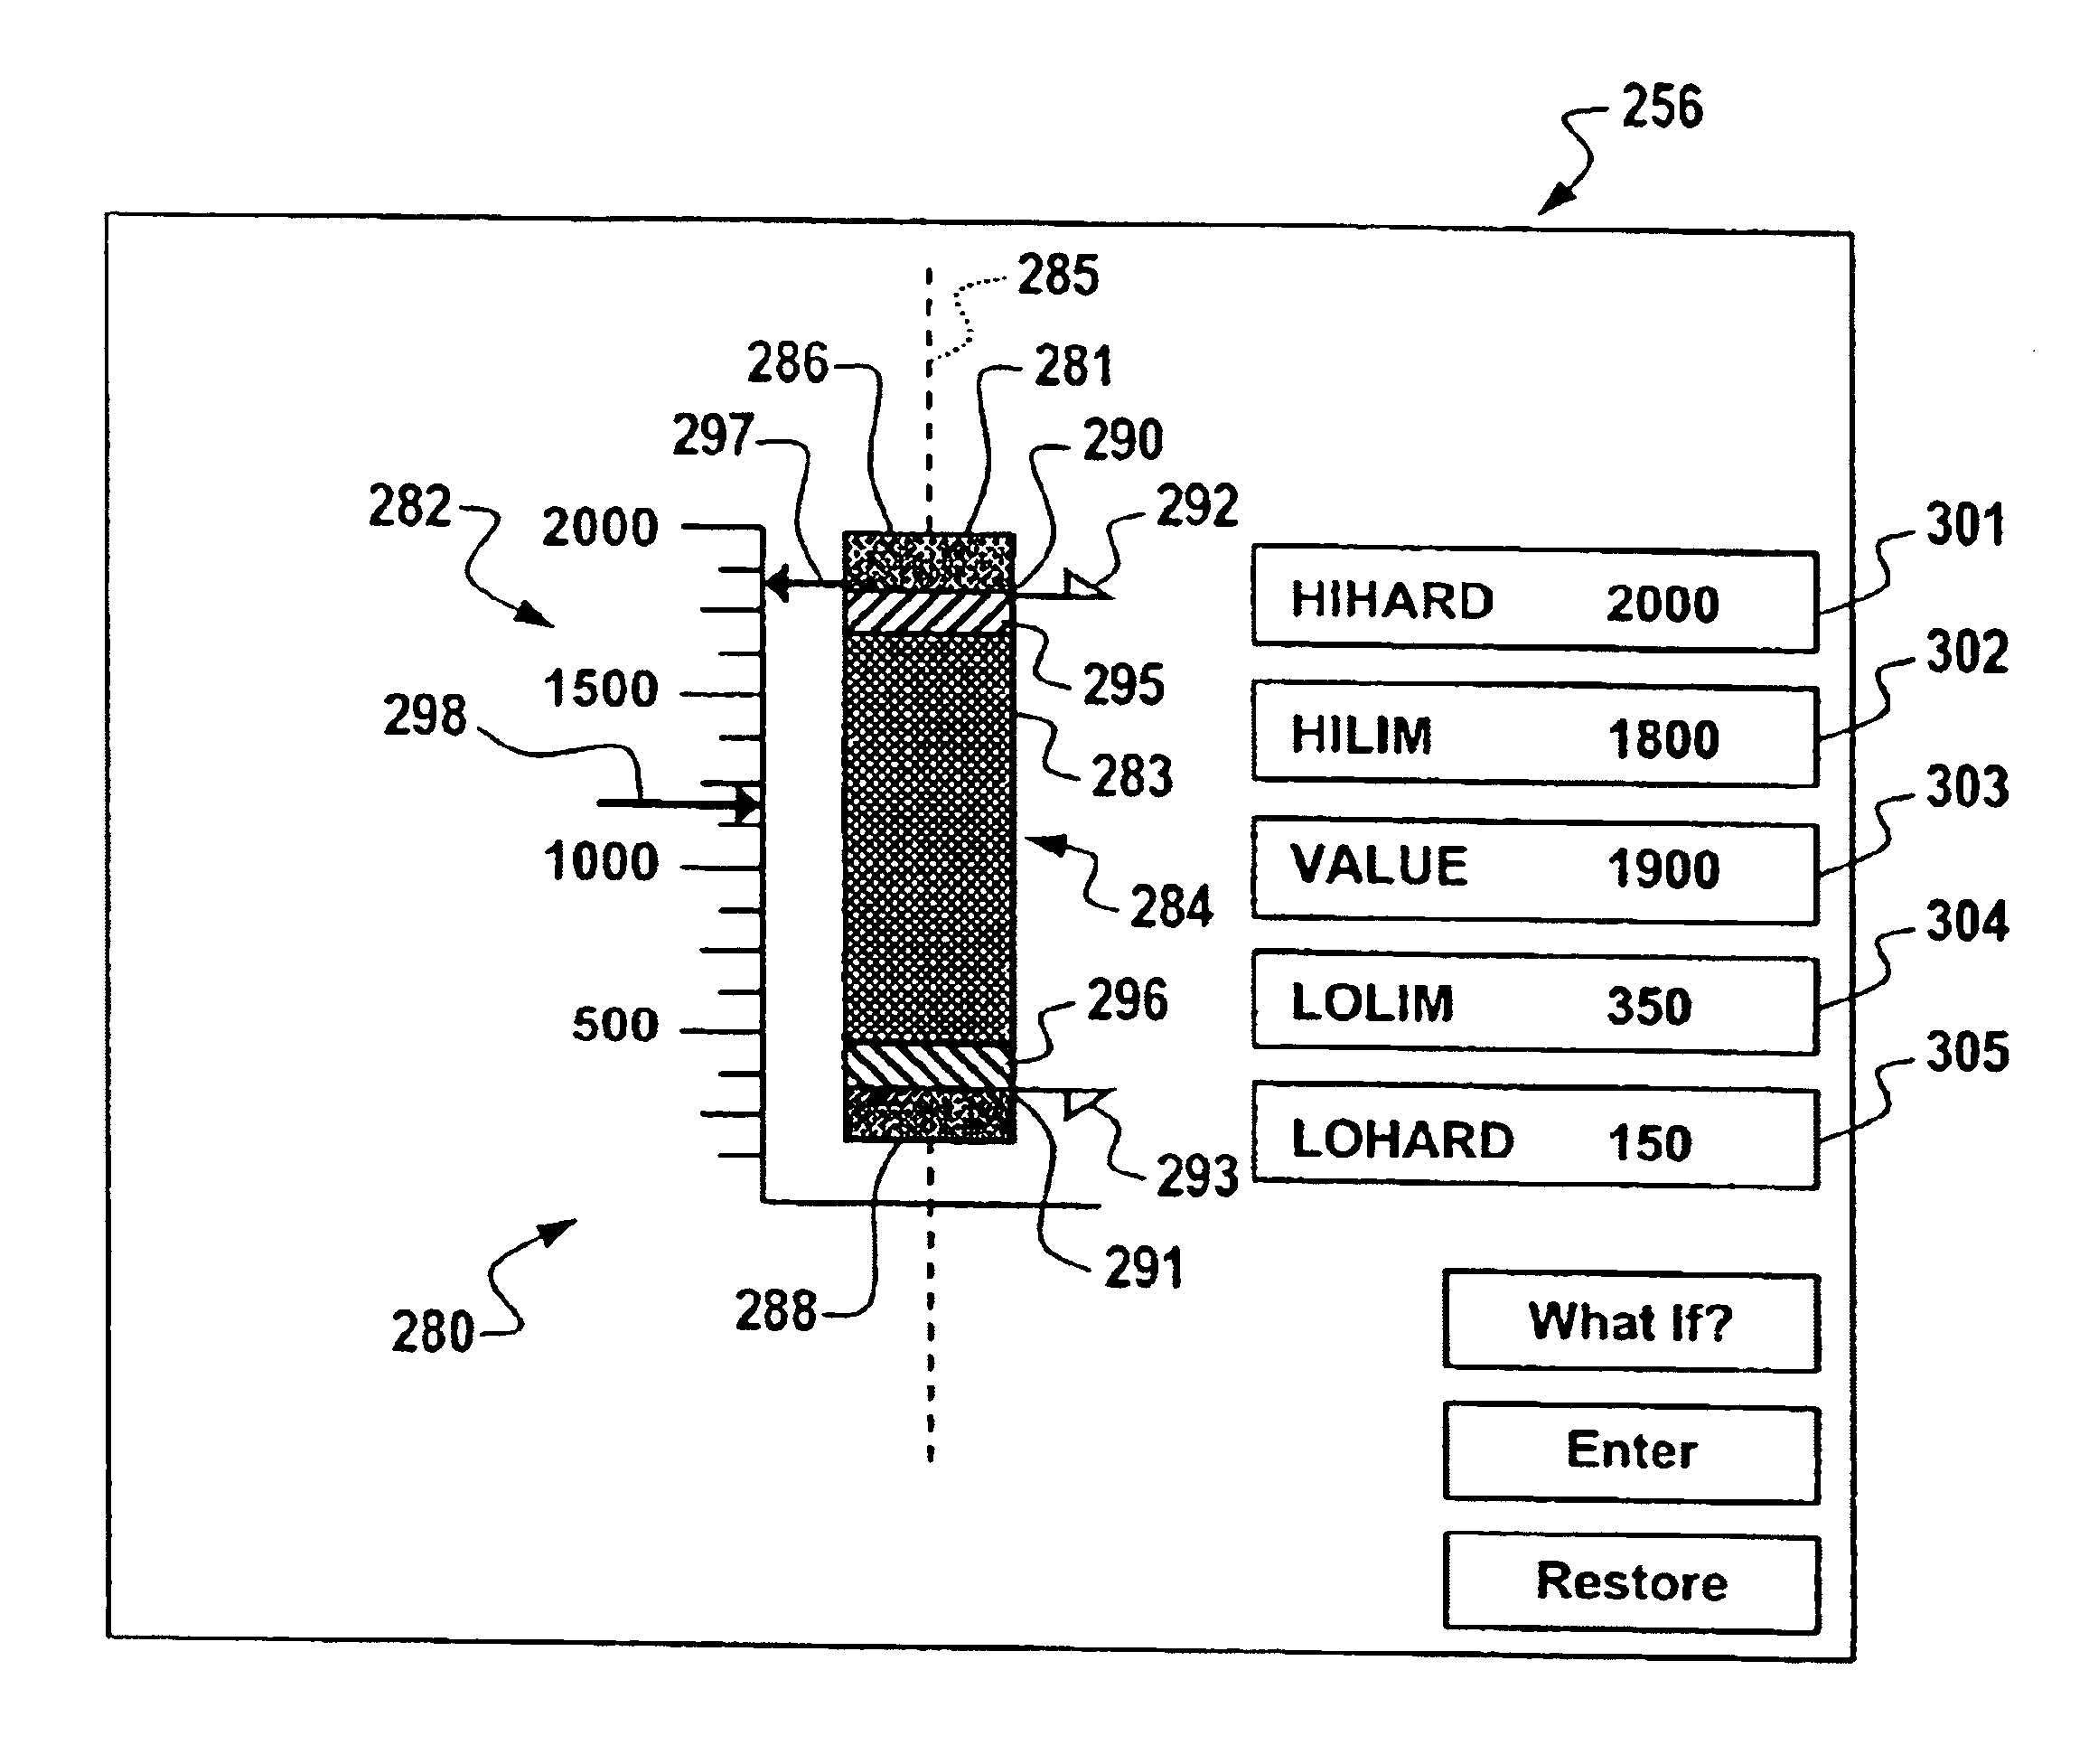
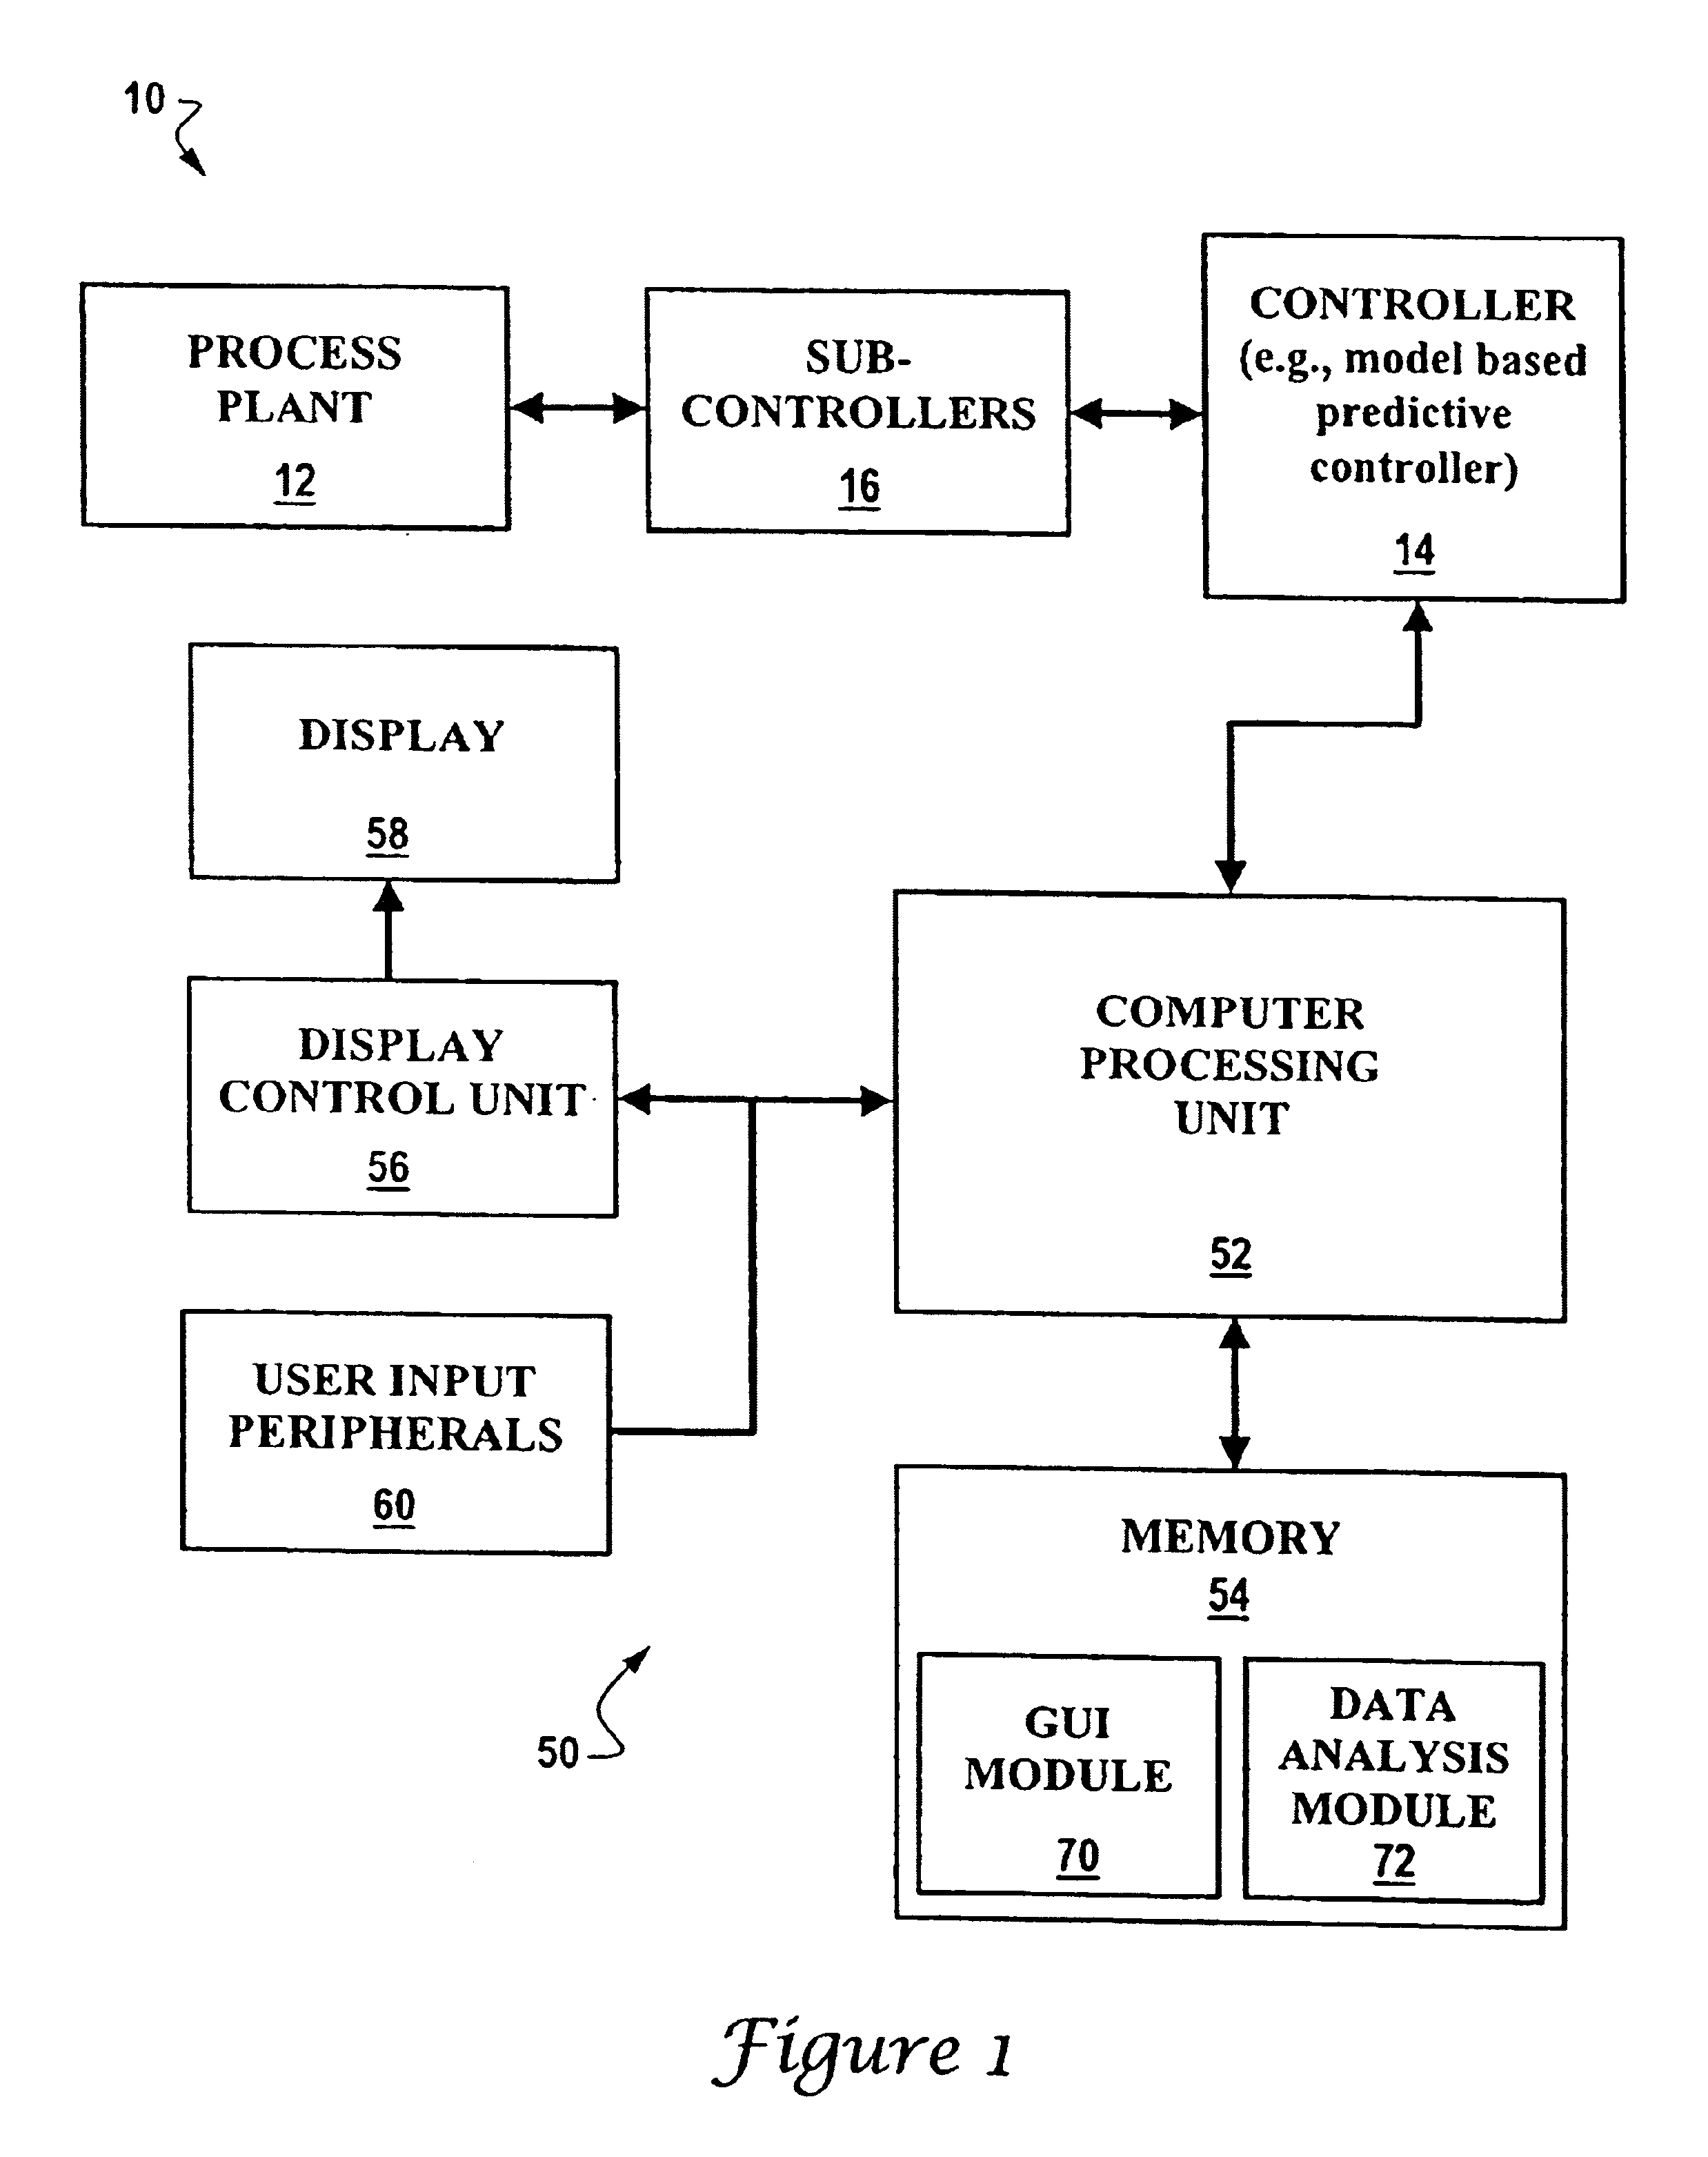
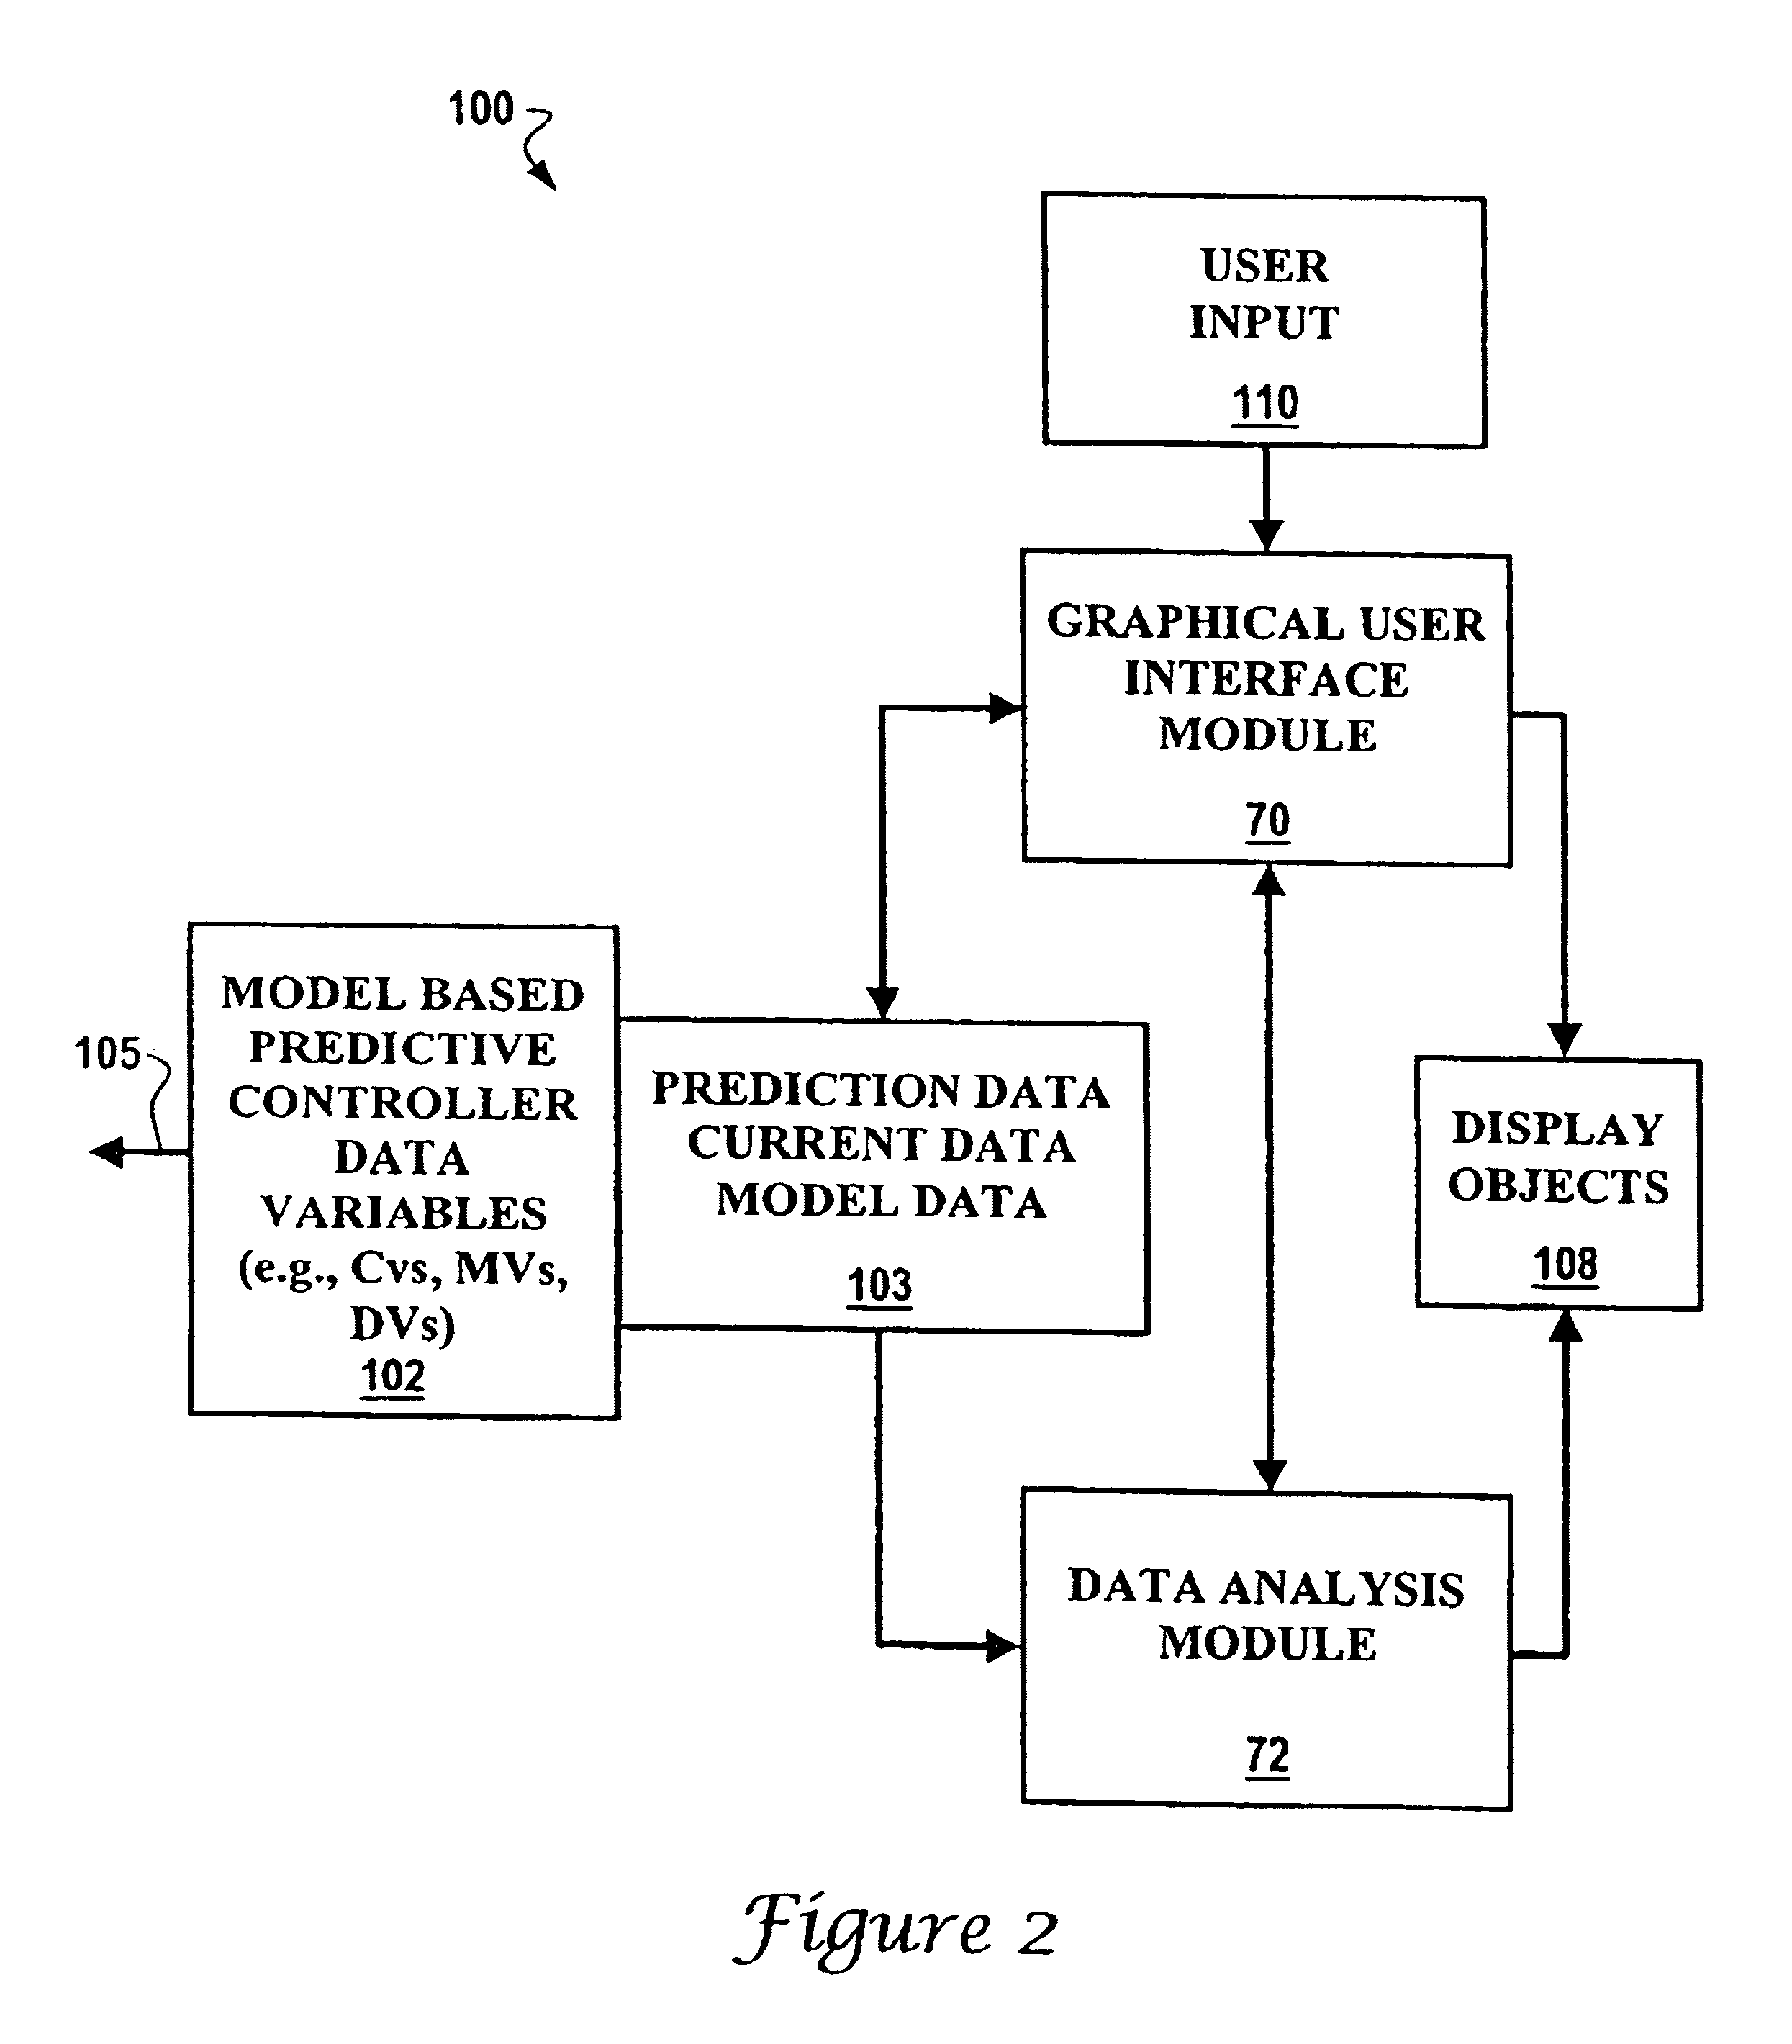
[0036]FIG. 1 is a block diagram showing a process system 10 including a graphical user interface 50 to assist users in the monitoring and manipulation of one or more process variables contained in a controller 14 operable to control a process performed by a process plant 12. The process system 10 includes the process plant 12 for performing a process under control of controller 14 and one or more optional subcontrollers 16.

[0037]The process plant 12 is representative of one or more plant components for performing a plant process or portion of a plant process operable under control of one or more process variables of a controller 14. For example, the process plant 12 may be a petrochemical refinery for performing a petrochemical process, nuclear plant, chemical plant, etc. The present invention is not limited to any particular process plant 12 but is particularly advantageous in the control of continuous multivariable production processes.

[0038]The controller 14 and optional subcontr...


PUM


Abstract

A graphical user interface for providing real-time process information to a user with regard to a process that is operable under control of one or more process variables includes a scale extending along a gauge axis and one or more bars extending along the gauge axis. Each bar is representative of a set of high and low process limit values for a process variable. Further, the graphical user interface includes a graphical shape displayed along the gauge axis representative of a current value of the process variable. A computer implemented method for providing the graphical user interface is also provided.

Description

FIELD OF THE INVENTION[0001]The present invention is generally related to process control. More particularly, the present invention pertains to graphical user interfaces and displays for process control.BACKGROUND OF THE INVENTION[0002]Display technologies are emerging which have importance for a variety of applications. For example, various graphical user interfaces and displays have been developed for personal computing, financial services applications, etc. Recent advances in hardware and software technologies enable the development of powerful graphical user interfaces.[0003]Various types of process control systems are presently in use, such as for control of processes operable under control of a single variable to processes controlled using controllers capable of controlling multiple variables. Control of a process is often implemented using microprocessor-based controllers, computers, or workstations which monitor the process by sending and receiving commands and data to hardw...

Claims


Application Information

Patent Timeline
Patent Type & Authority Patents(United States)
IPC IPC(8): G05B19/409G05B23/02G06F3/048G06F3/0481G06F3/0484
CPCG05B19/409G05B23/0235G05B23/0267Y10S715/97Y10S715/965
Inventor JAMIESON, GREGORY A.GUERLAIN, STEPHANIE A. E.BULLEMER, PETER T.
Owner HONEYWELL INC
Why Eureka
Try Eureka