Visually displaying sequentially ordered data for mining

a sequential order, data technology, applied in the field of data mining, can solve the problems of large, incomprehensible, non-interesting result sets, and the type of structure becomes too complex to analyze and mine, and achieves the effect of simplifying the visualization space, enhancing the detection of interesting clickpath patterns, and easy analysis and evaluation clickpaths

Inactive Publication Date: 2006-01-03
MICROSOFT TECH LICENSING LLC
View PDF31 Cites 101 Cited by
  • Summary
  • Abstract
  • Description
  • Claims
  • Application Information

AI Technical Summary

Benefits of technology

[0005]The invention includes software to display a funnel from sequentially ordered data (e.g., clickstream data) as a hierarchy to a user for analysis. In the clickstream embodiment, the funnel represents an ordered path of web pages successively viewed by the user. In particular, the invention includes a clickpath visualization software product that enables users to easily analyze and evaluate clickpaths by focusing only on subpaths of interest. For example, the primary structure of clickpath visualization is a tree. Visualization techniques of the invention enhance the detection of interesting clickpath patterns from data. The clickpath visualization product of the ...

Problems solved by technology

As powerful as such clickpath mining methods may be, they often lead to huge, incomprehensible, and non-interesting result sets.
Most existing business intelligence products have not attempted to address the problem of clickpath visualization.
Unfortunately, this type of structure beco...

Method used


Image

  • Visually displaying sequentially ordered data for mining
  • Visually displaying sequentially ordered data for mining
  • Visually displaying sequentially ordered data for mining

Examples


Embodiment Construction

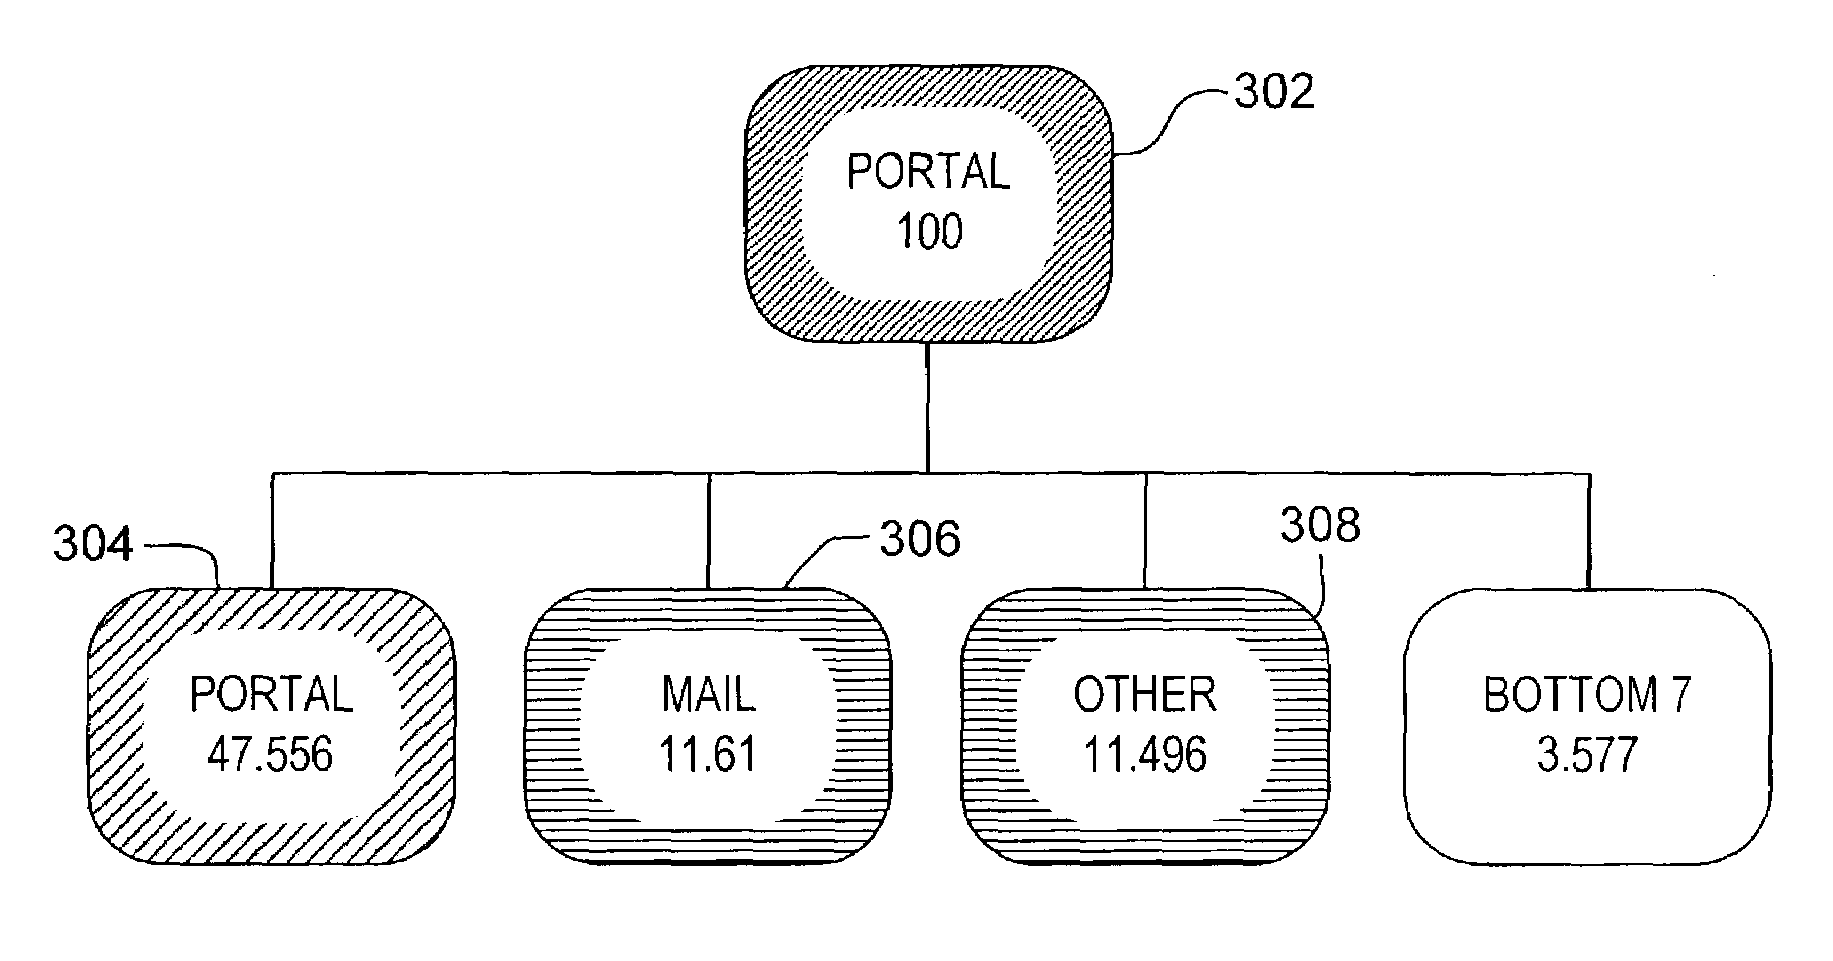
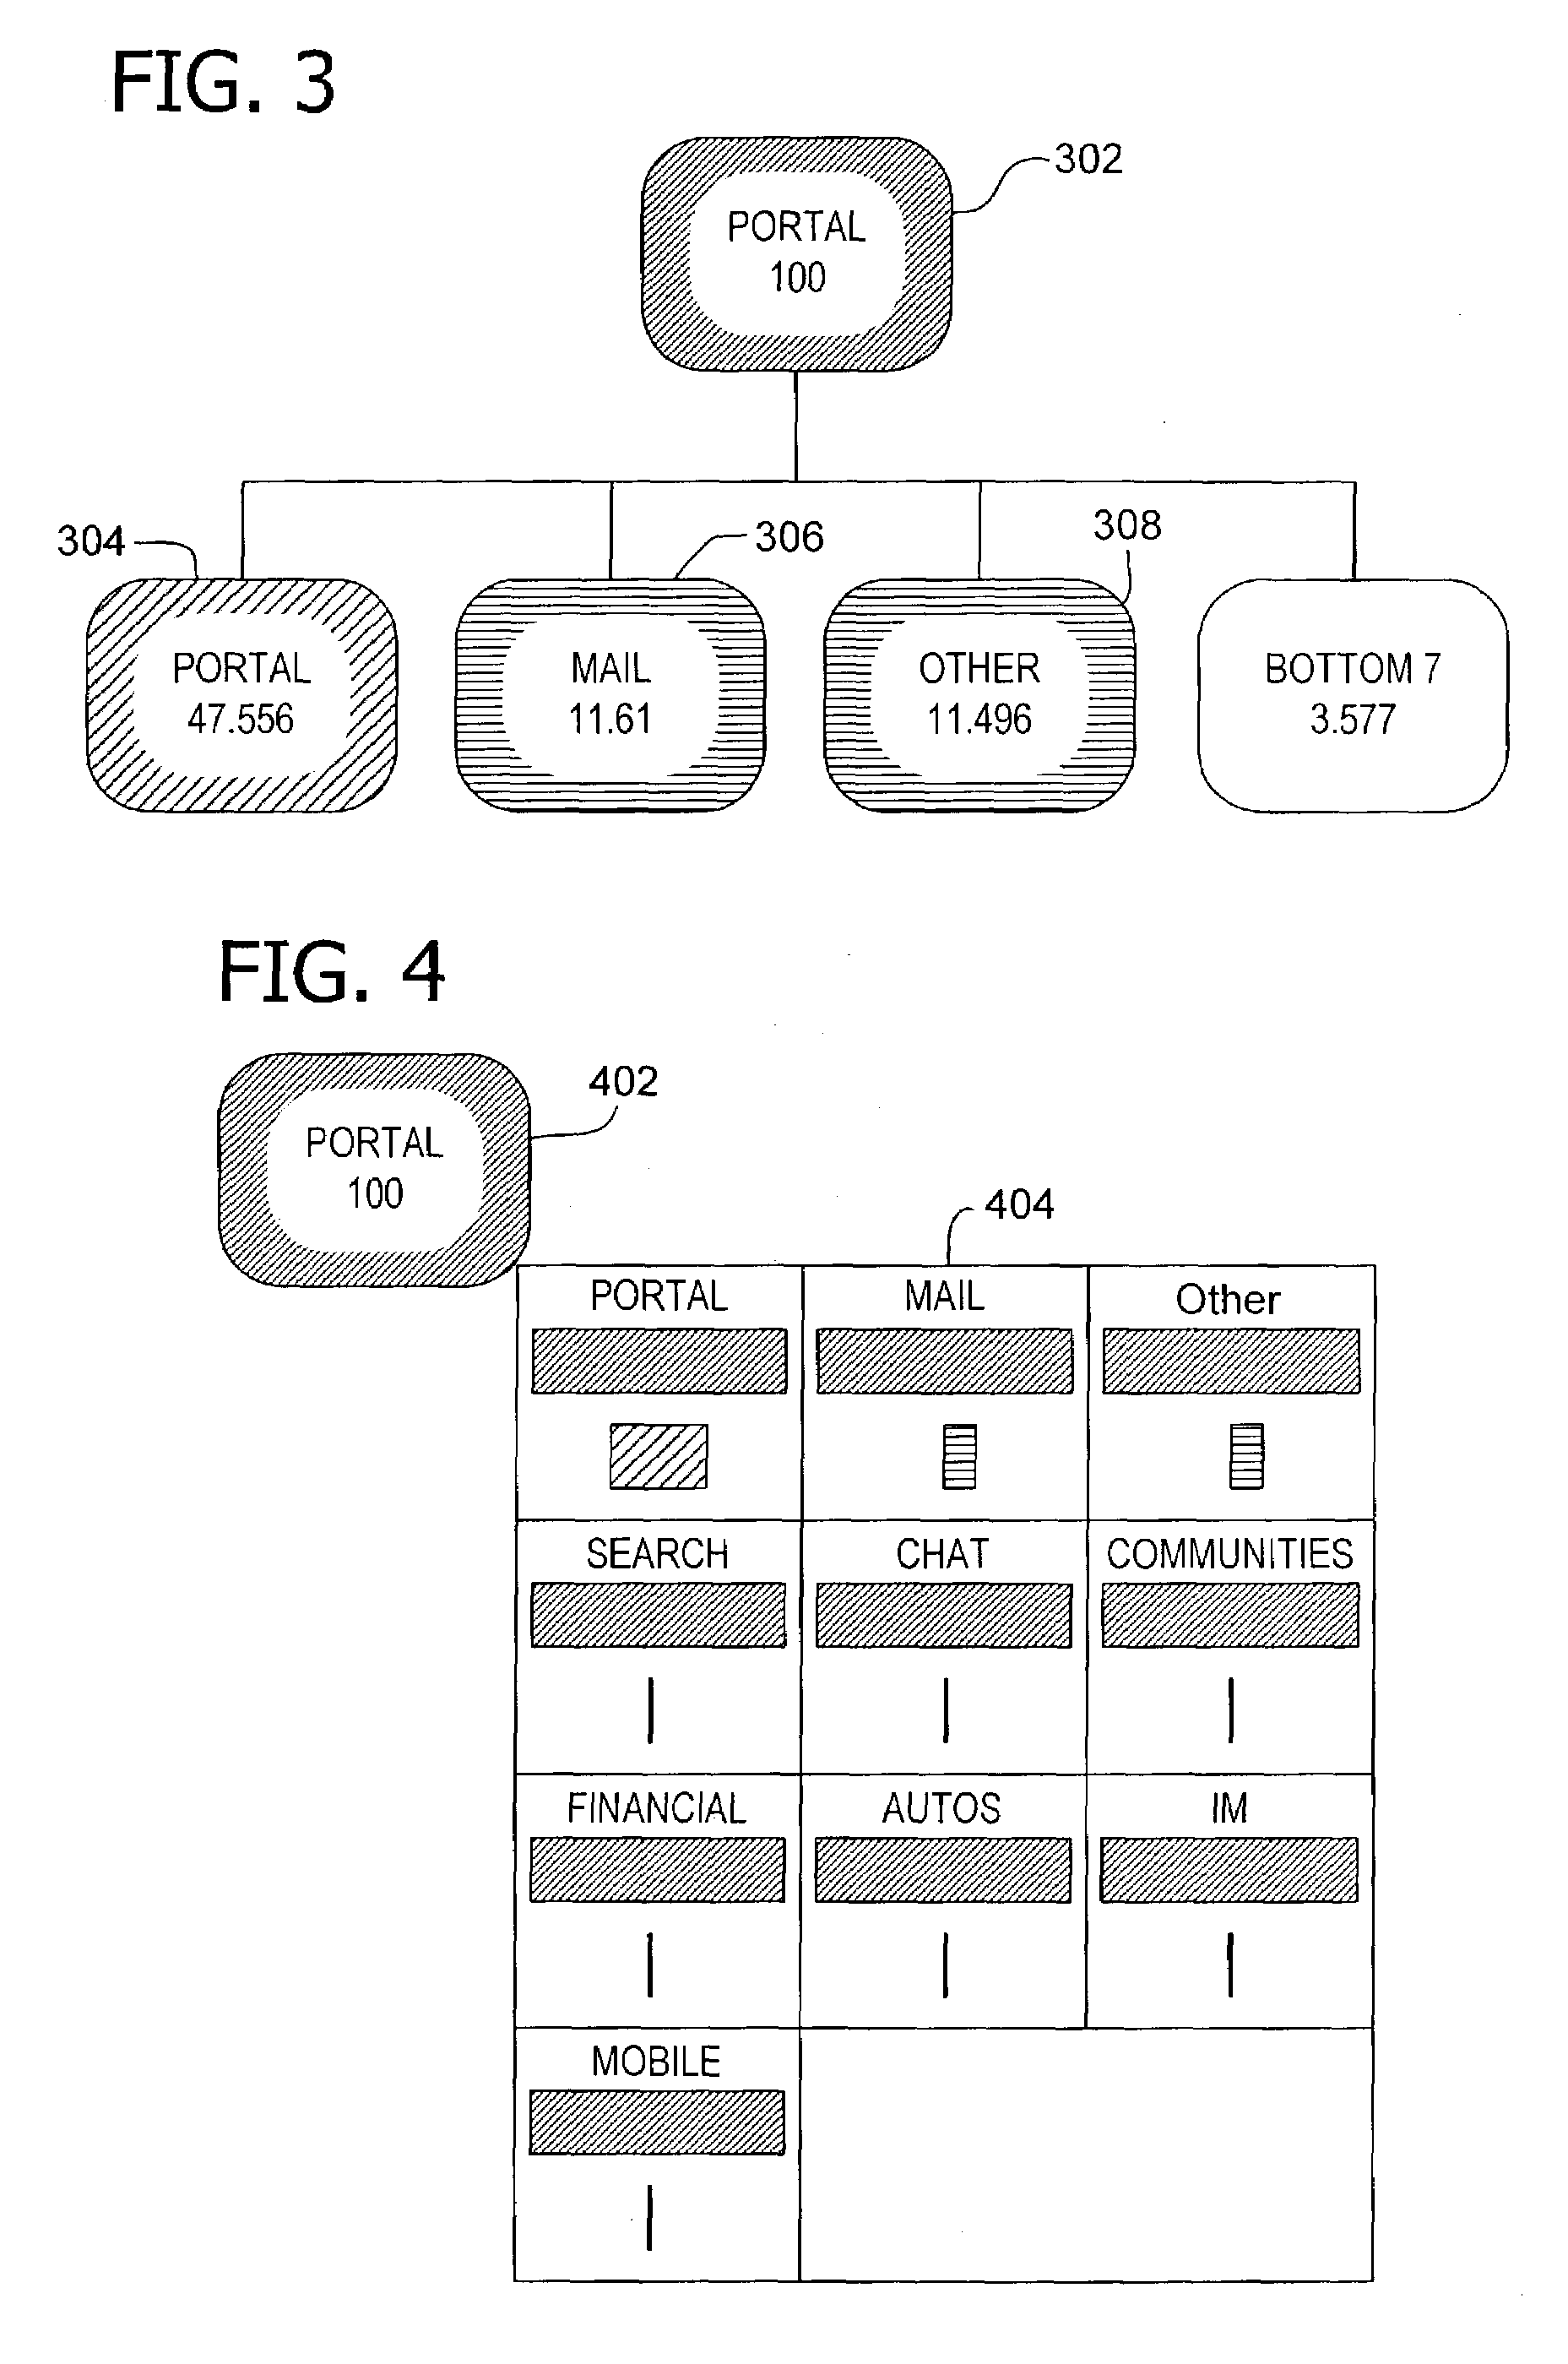
[0032]According to one embodiment, the invention displays a funnel to a user for analysis (e.g., a funnel mining analysis). In particular, the invention displays the funnel, which is generated from sequentially ordered data such as clickstream data, as a hierarchy (e.g., see FIG. 3). The invention focuses the visualization of funnels on a number of select starting points in a relatively linear manner. This emphasis on focus narrows the scope and zooms in on only a number of points of interest. Because no one technique can be used to detect all types of patterns, the invention includes a package of visual techniques that can be used to enhance the mining of sequentially ordered data.

[0033]For example, the invention provides a user interface permitting users to visualize sequentially ordered data such as a clickpath. Those skilled in the art recognize that a clickpath is a connection between a number of different points (i.e. URLs, websites) in a network. The fundamental nature of the...


PUM


Abstract

Displaying a funnel from clickstream data as a hierarchy to a user for analysis wherein the funnel represents an ordered path of web pages successively viewed by the user. The invention includes clickpath visualization software to enable the user to easily analyze and evaluate clickpaths by focusing only on subpaths of interest. The invention software provides the user with various functions including, but not limited to, zoom, sort, expand, reverse, preview, and activate.

Description

CROSS-REFERENCE TO RELATED APPLICATION[0001]This is a continuation-in-part of U.S. patent application Ser. No. 10 / 056,766, filed Jan. 25, 2002.TECHNICAL FIELD[0002]The present invention relates to the field of data mining. In particular, this invention relates to visually displaying sequentially ordered data for mining.BACKGROUND OF THE INVENTION[0003]As complex structures are extracted from input data sets, the practice of data mining is challenged with keeping analysts closer to the data exploration process to reveal powerful insight upon which business owners can directly act. For example, existing clickpath mining methods have focused on reporting top clickpaths, sequential patterns, and funnel analyses from input clickstreams. As powerful as such clickpath mining methods may be, they often lead to huge, incomprehensible, and non-interesting result sets. Most existing business intelligence products have not attempted to address the problem of clickpath visualization. Of the exis...

Claims


Application Information

Patent Timeline
IPC IPC(8): G06F17/00G06F17/30H04L29/12
CPCG06F17/30905H04L61/30H04L29/12594G06F16/9577
Inventor MAH, TERESALI, YINGBURDICK, BRIANKORNELSON, KEVIN PAUL
Owner MICROSOFT TECH LICENSING LLC
Why Eureka
Try Eureka