Image enhancement and segmentation of structures in 3D ultrasound images for volume measurements

a 3d ultrasound and volume measurement technology, applied in the field of medical imaging, can solve the problems of unsatisfactory shape or size assumptions, and the inability to generalize beyond the application, so as to achieve the effect of robustly locating and measuring

Active Publication Date: 2006-02-28
VERATHON
View PDF9 Cites 80 Cited by
  • Summary
  • Abstract
  • Description
  • Claims
  • Application Information

AI Technical Summary

Benefits of technology

[0011]The invention is a method having a plurality of segmentation algorithms and steps optimized to robustly locate and measure the volume of a fluid filled or non-fluid filled structure or organ from primary images obtained from instruments probing with or receiving and processing electromagnetic and non-electromagnetic radiation including ultrasound, CT, MR, PET, and radioisotopes used in nuclear medicine procedures that produce a plurality of, 1D, 2D, or 3D images. The method is applied to 1D scans to obtain resultant 2D primary images. Each 2D primary image is made visually enhanced by the plurality of segmentation algorithms and steps of the method. The method then includes the creation and placement of accurately drawn boundary line contours that more clearly delineate or segment the structure walls within the 2D image. Upon placing the boundary line contours, the method calculates the volumes for each delineated structure or organ presented in each primary image. Then, as an aggregate, the method provides the ability to calculate the 2D area and the 3D volume of the structure or organ, fluid filled or non-fluid filled, from the summation of each 2D image.

Problems solved by technology

Most of these techniques are not ideal in that they cannot be generalized beyond the application for which they were designed.
They use shape or size assumptions that are not necessarily satisfied for different applications.
(System And Method For Automatic Measurement Of Body Structures) but is limited in its application due to method complexity and operational robustness.
However, “snake” methods require an initial contour that needs to be very close to the final desired boundary.
In addition, most of these methods are iterative in nature and labor intensive.
The live wire methodology of Falacao is labor intensive since it requires an iterative approach and generates a series of mouse delineating end-points.
Furthermore, live wire methods are limited in accuracy because the simplest optimal path contour connecting any two mouse determined end-points is not sufficient in ultrasound images that are prone to mouse pointer backtracking.
However, shock filters implemented with unoptimized algorithms have been found deficient in that the unoptimized algorithms increase or enhance noise speckle, thereby degrading the CT, MR, and PET images.
In ultrasound images, chamber-like structures (for example: bladder, heart left ventricle, prostate, amniotic sac) are further prone to image degradation due to ultrasound echoes reflecting from other surfaces parallel to do organ wall boundary.
Thus, ultrasound-echoing overlaps creates missing lateral boundaries of the organ walls.
Thereby, making it difficult to accurately determine boundary wall locations where segmentation lines need to be drawn.

Method used


Image

  • Image enhancement and segmentation of structures in 3D ultrasound images for volume measurements
  • Image enhancement and segmentation of structures in 3D ultrasound images for volume measurements
  • Image enhancement and segmentation of structures in 3D ultrasound images for volume measurements

Examples


Embodiment Construction

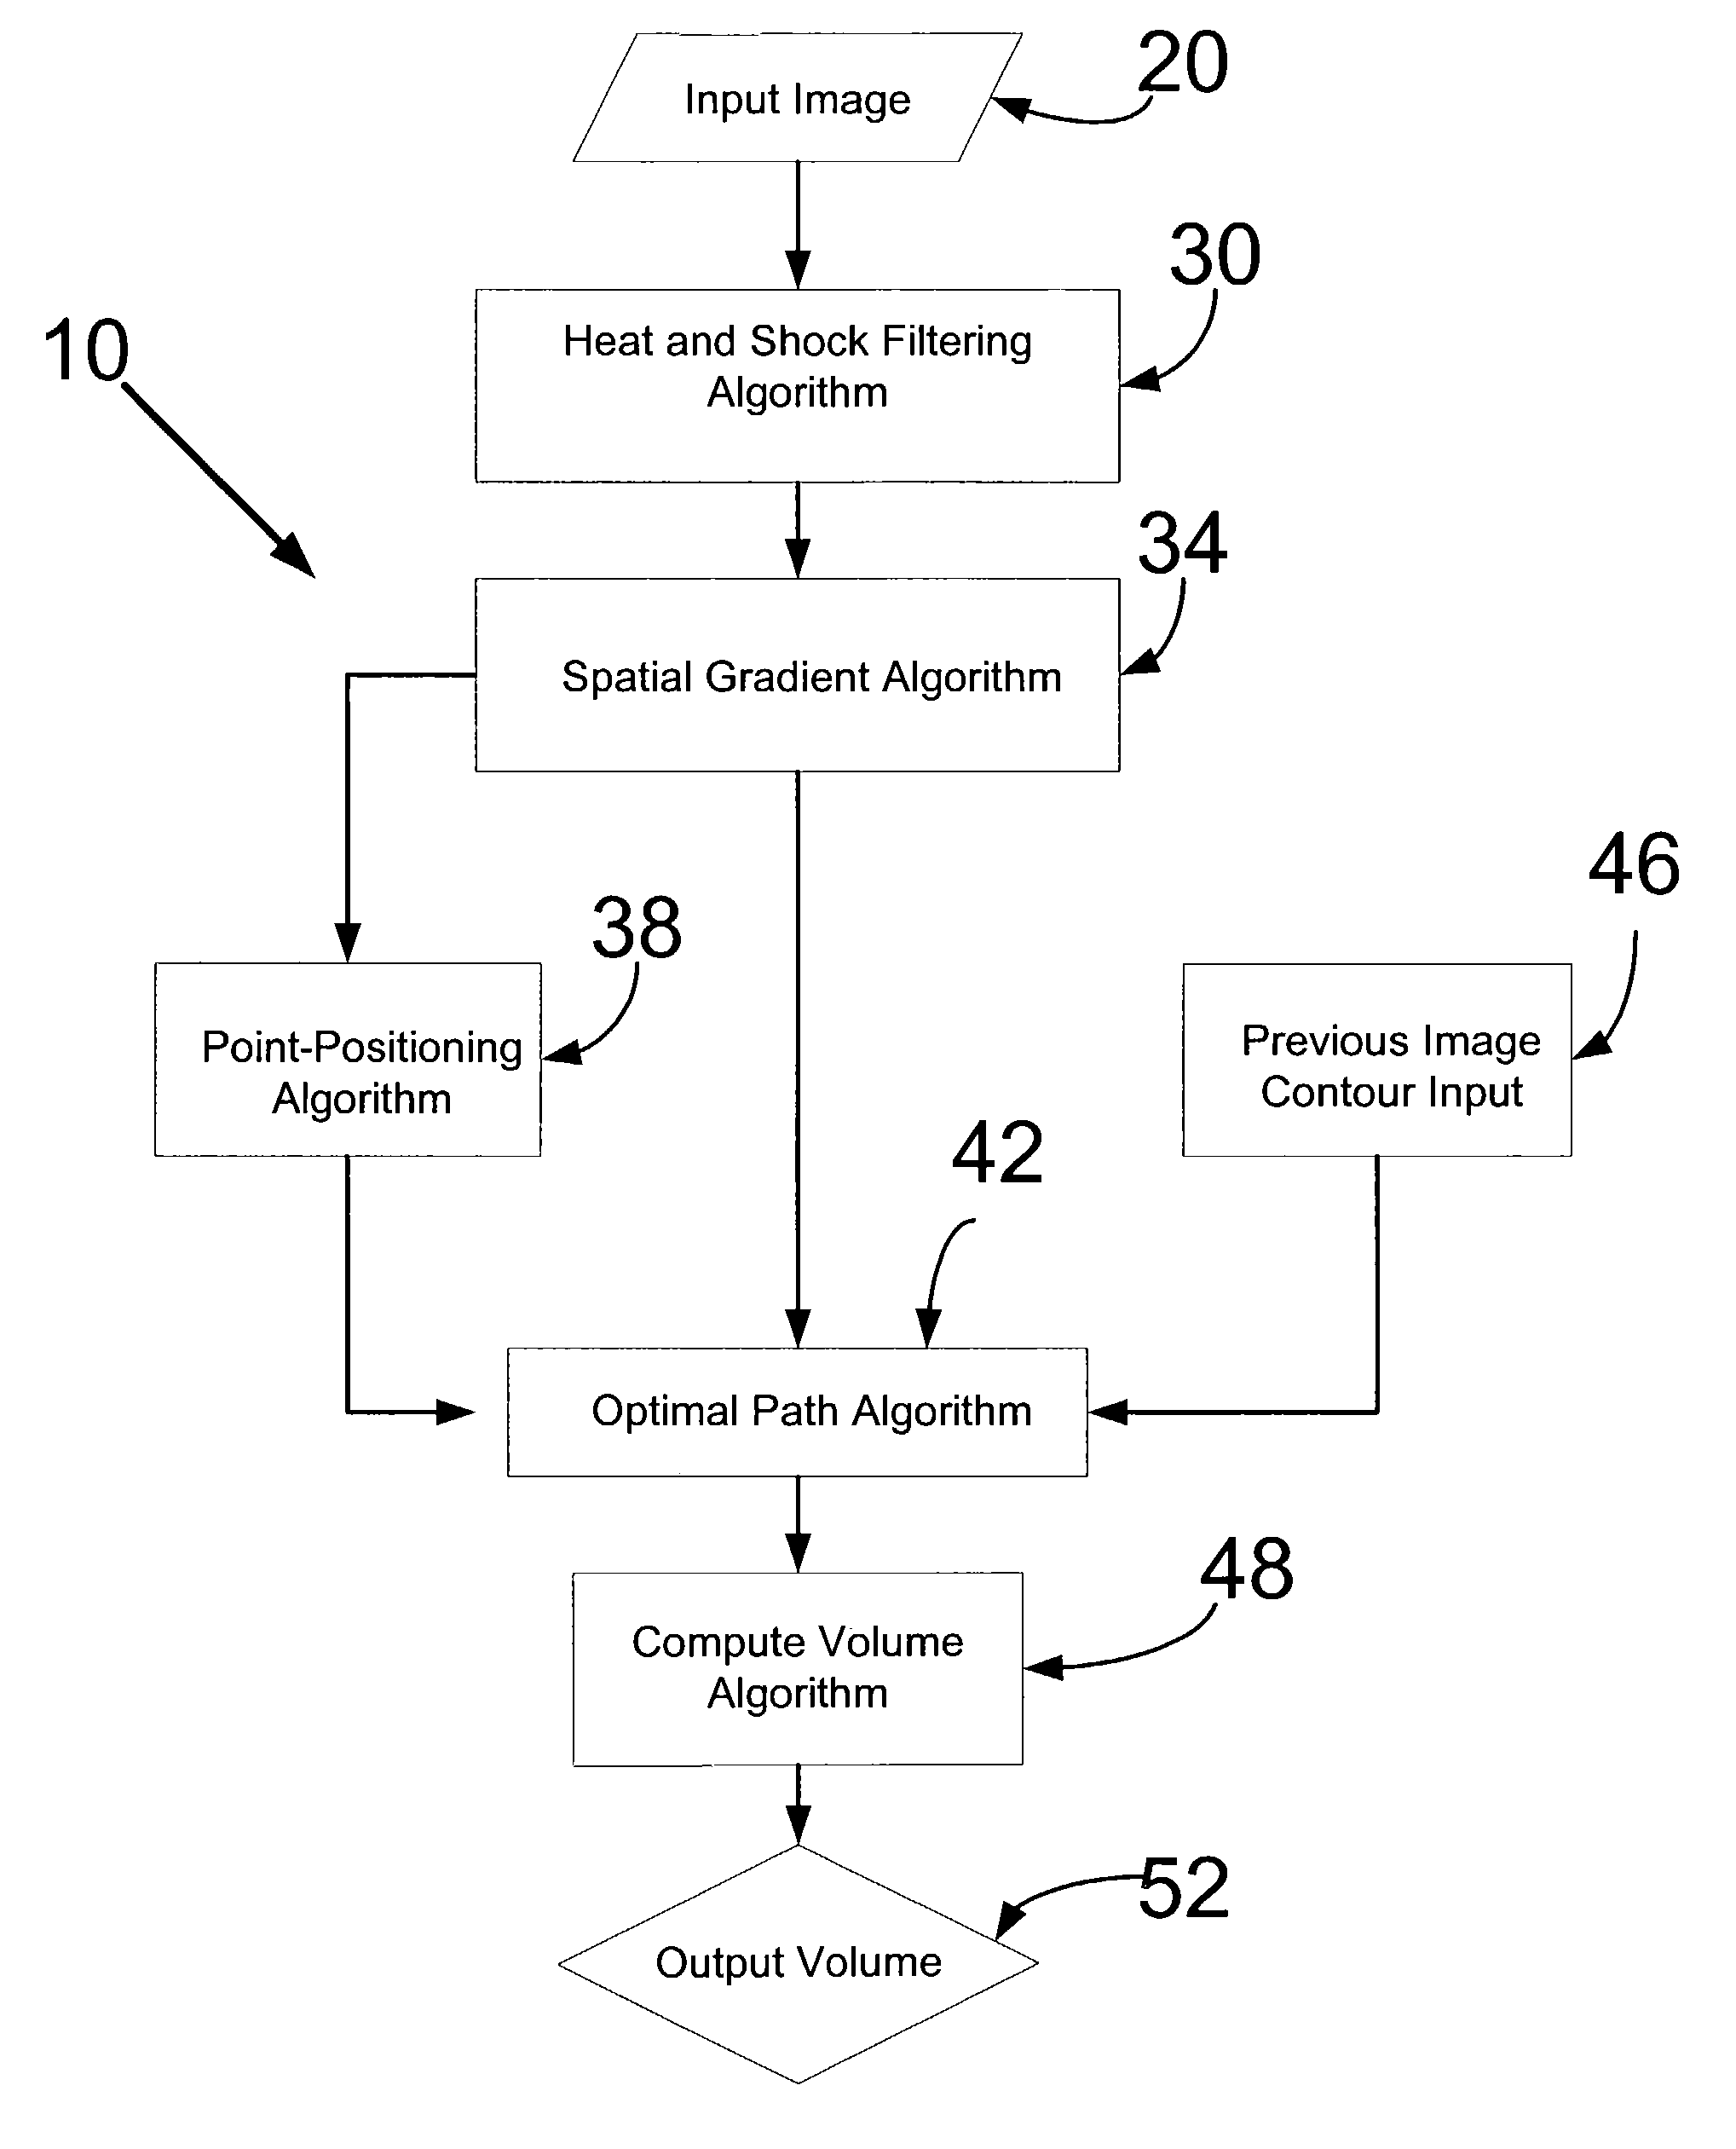
[0028]FIG. 1 shows an overview of a segmentation algorithm 10. The segmentation algorithm 10 begins with the receiving of an input image 20, to which a heat and shock filtering algorithm 30 is applied to the input image 20. Thereafter, a spatial gradient algorithm 34 is applied to the image that has been heat and shock filtered. At this juncture, initial edge points are located in a point-positioning algorithm 38 to the boundary of the organ structure within the image. Thereafter an optimal path algorithm 42 is applied to determine the best path to connect the initial edge points assigned by the point-positioning algorithm 38. This optimal path algorithm 42 also uses the result of the spatial gradient algorithm 34 as an input. For images already having a drawn contour, a previous image contour input 46 is inputted to the optimal path algorithm 42. Thereafter, a compute volume algorithm 48 is applied to the image, and the computed volume is reported as an output volume 52.

[0029]FIG. ...


PUM


Abstract

A segmentation algorithm is optimized to robustly locate and measure the volume of fluid filled or non-fluid filled structures or organs from imaging systems derived from ultrasound, computer assisted tomography, magnetic resonance, and position emission tomography. A clinical specimen is measured with a plurality of 2D scan planes processed by the segmentation algorithm to estimate the 2D based area the 3D based volumes of fluid-filled and non-fluid filled organs or structures.

Description

PRIORITY CLAIM[0001]This application is a continuation-in-part of and claims priority to U.S. patent application Ser. No. 10 / 443,126 filed May 20, 2003 which claims priority to U.S. provisional patent application Ser. No. 60 / 423,881 filed Nov. 5, 2002 and to U.S. provisional application 60 / 400,624 filed Aug. 2, 2002. This application claims priority to U.S. provisional patent application Ser. No. 60 / 470,525 filed May 12, 2003, and to U.S. patent application Ser. No. 10 / 165,556 filed Jun. 7, 2002, now U.S. Pat. No. 6,676,605. All of the above applications are herein incorporated by reference in their entirety as if fully set forth herein.FIELD OF THE INVENTION[0002]This invention pertains to the field of medical imaging, particularly to measuring the size and shape of organs from three-dimensional images.BACKGROUND OF THE INVENTION[0003]Various kinds of methods have been used or proposed in the literature to measure the size, shape, and internal volumes of specific organs using ultra...

Claims


Application Information

Patent Timeline
Patent Type & Authority Patents(United States)
IPC IPC(8): A61B8/00A61B5/00A61B5/055A61B6/00A61B6/03A61B8/08G06T1/00G06T5/00G06T5/20G06T7/60
CPCA61B5/204A61B8/0858A61B8/0866A61B8/462A61B8/483G06T7/0012G06T7/0081G06T7/0083G06T7/0089G06T7/602A61B8/00G06T2207/30048A61B2560/0456G06T2207/10132G06T2207/10136G06T2207/30004G06T2207/30016G06T2207/30044G06T7/11G06T7/12G06T7/149G06T7/62
Inventor CHALANA, VIKRAMDUDYCHA, STEPHENMCMORROW, GERALD
Owner VERATHON
Why Eureka
Try Eureka