Method for estimating and reducing uncertainties in process measurements

a technology of process measurement and uncertainty, applied in the field of process measurement uncertainty estimation and uncertainty reduction, to achieve the effect of facilitating control of m variable multivariate system or process

Inactive Publication Date: 2006-03-21
TRIANT TECH 2005
View PDF6 Cites 30 Cited by
  • Summary
  • Abstract
  • Description
  • Claims
  • Application Information

AI Technical Summary

Problems solved by technology

If only one of the modeling uncertainties exceeds a corresponding one of the measurement uncertainties, it can be concluded that there is a fault in that one of the new data set measurements for which the one of the modeling uncertainties exceeds the corresponding one of the measurement uncertainties.
If more than one of the modeling uncertainties exceeds a corresponding one of the measurement uncertainties, it can be concluded that there is a fault in each one of the new data set measurements for which the one of the modeling uncertainties exceeds the corresponding one of the measurement uncertainties.

Method used


Image

  • Method for estimating and reducing uncertainties in process measurements
  • Method for estimating and reducing uncertainties in process measurements
  • Method for estimating and reducing uncertainties in process measurements

Examples


first example

[0059]In this example, a reference set of measurements is modeled, then a non-reference set of unfaulted measurements is modeled, and finally the same non-reference set of measurements with one fault introduced is modeled.

[0060]The Minnesota Multiphasic Personality Inventory—2 (“MMPI—2”; see: Minnesota Multiphasic Personality Inventory—2 Manual for Administration and Scoring, University of Minnesota Press, Minneapolis, Minn., 1989) is used to create a human personality profile comprising 13 basic scales:

[0061]

1LLie2FInfrequency3KCorrection4HsHypochondriasis5DDepression6HyConversion Hysteria7PdPsychopathic Deviate8MfMasculinity-Femininity9PaParanoia10PtPsychasthenia11ScSchizophrenia12MaHypomania13SiSocial Introversion

[0062]For a large number of inventories from a community population the T-scores for each of these scales may be expected to have an average value of 50 points with a standard deviation of 7.5 points. This standard deviation is generally estimated to comprise a combinati...

second example

[0174]The preceding example involves real data for which it is impossible to illustrate that uncertainties have actually been reduced. In order to illustrate that uncertainties may actually be reduced, it is necessary to resort to simulated variables. Accordingly, an example is now provided of simulations of 400 profiles with 13 values in each profile. Each simulated value without measuring uncertainties lay between 46 and 104. Further, these 400 simulated profiles without measuring uncertainties are linear with a variety of positive, negative, and zero slopes. The variables of these simulated profiles are designated by zij for i=1 to 13 and j=1 to 400. Then to each zij was added a randomly chosen member of a normal distribution of values with a standard deviation of 7 to create the xij of the reference matrix X. Thus the 400 simulated profiles cover approximately the same numerical space as do the MMPI-2 profiles discussed above.

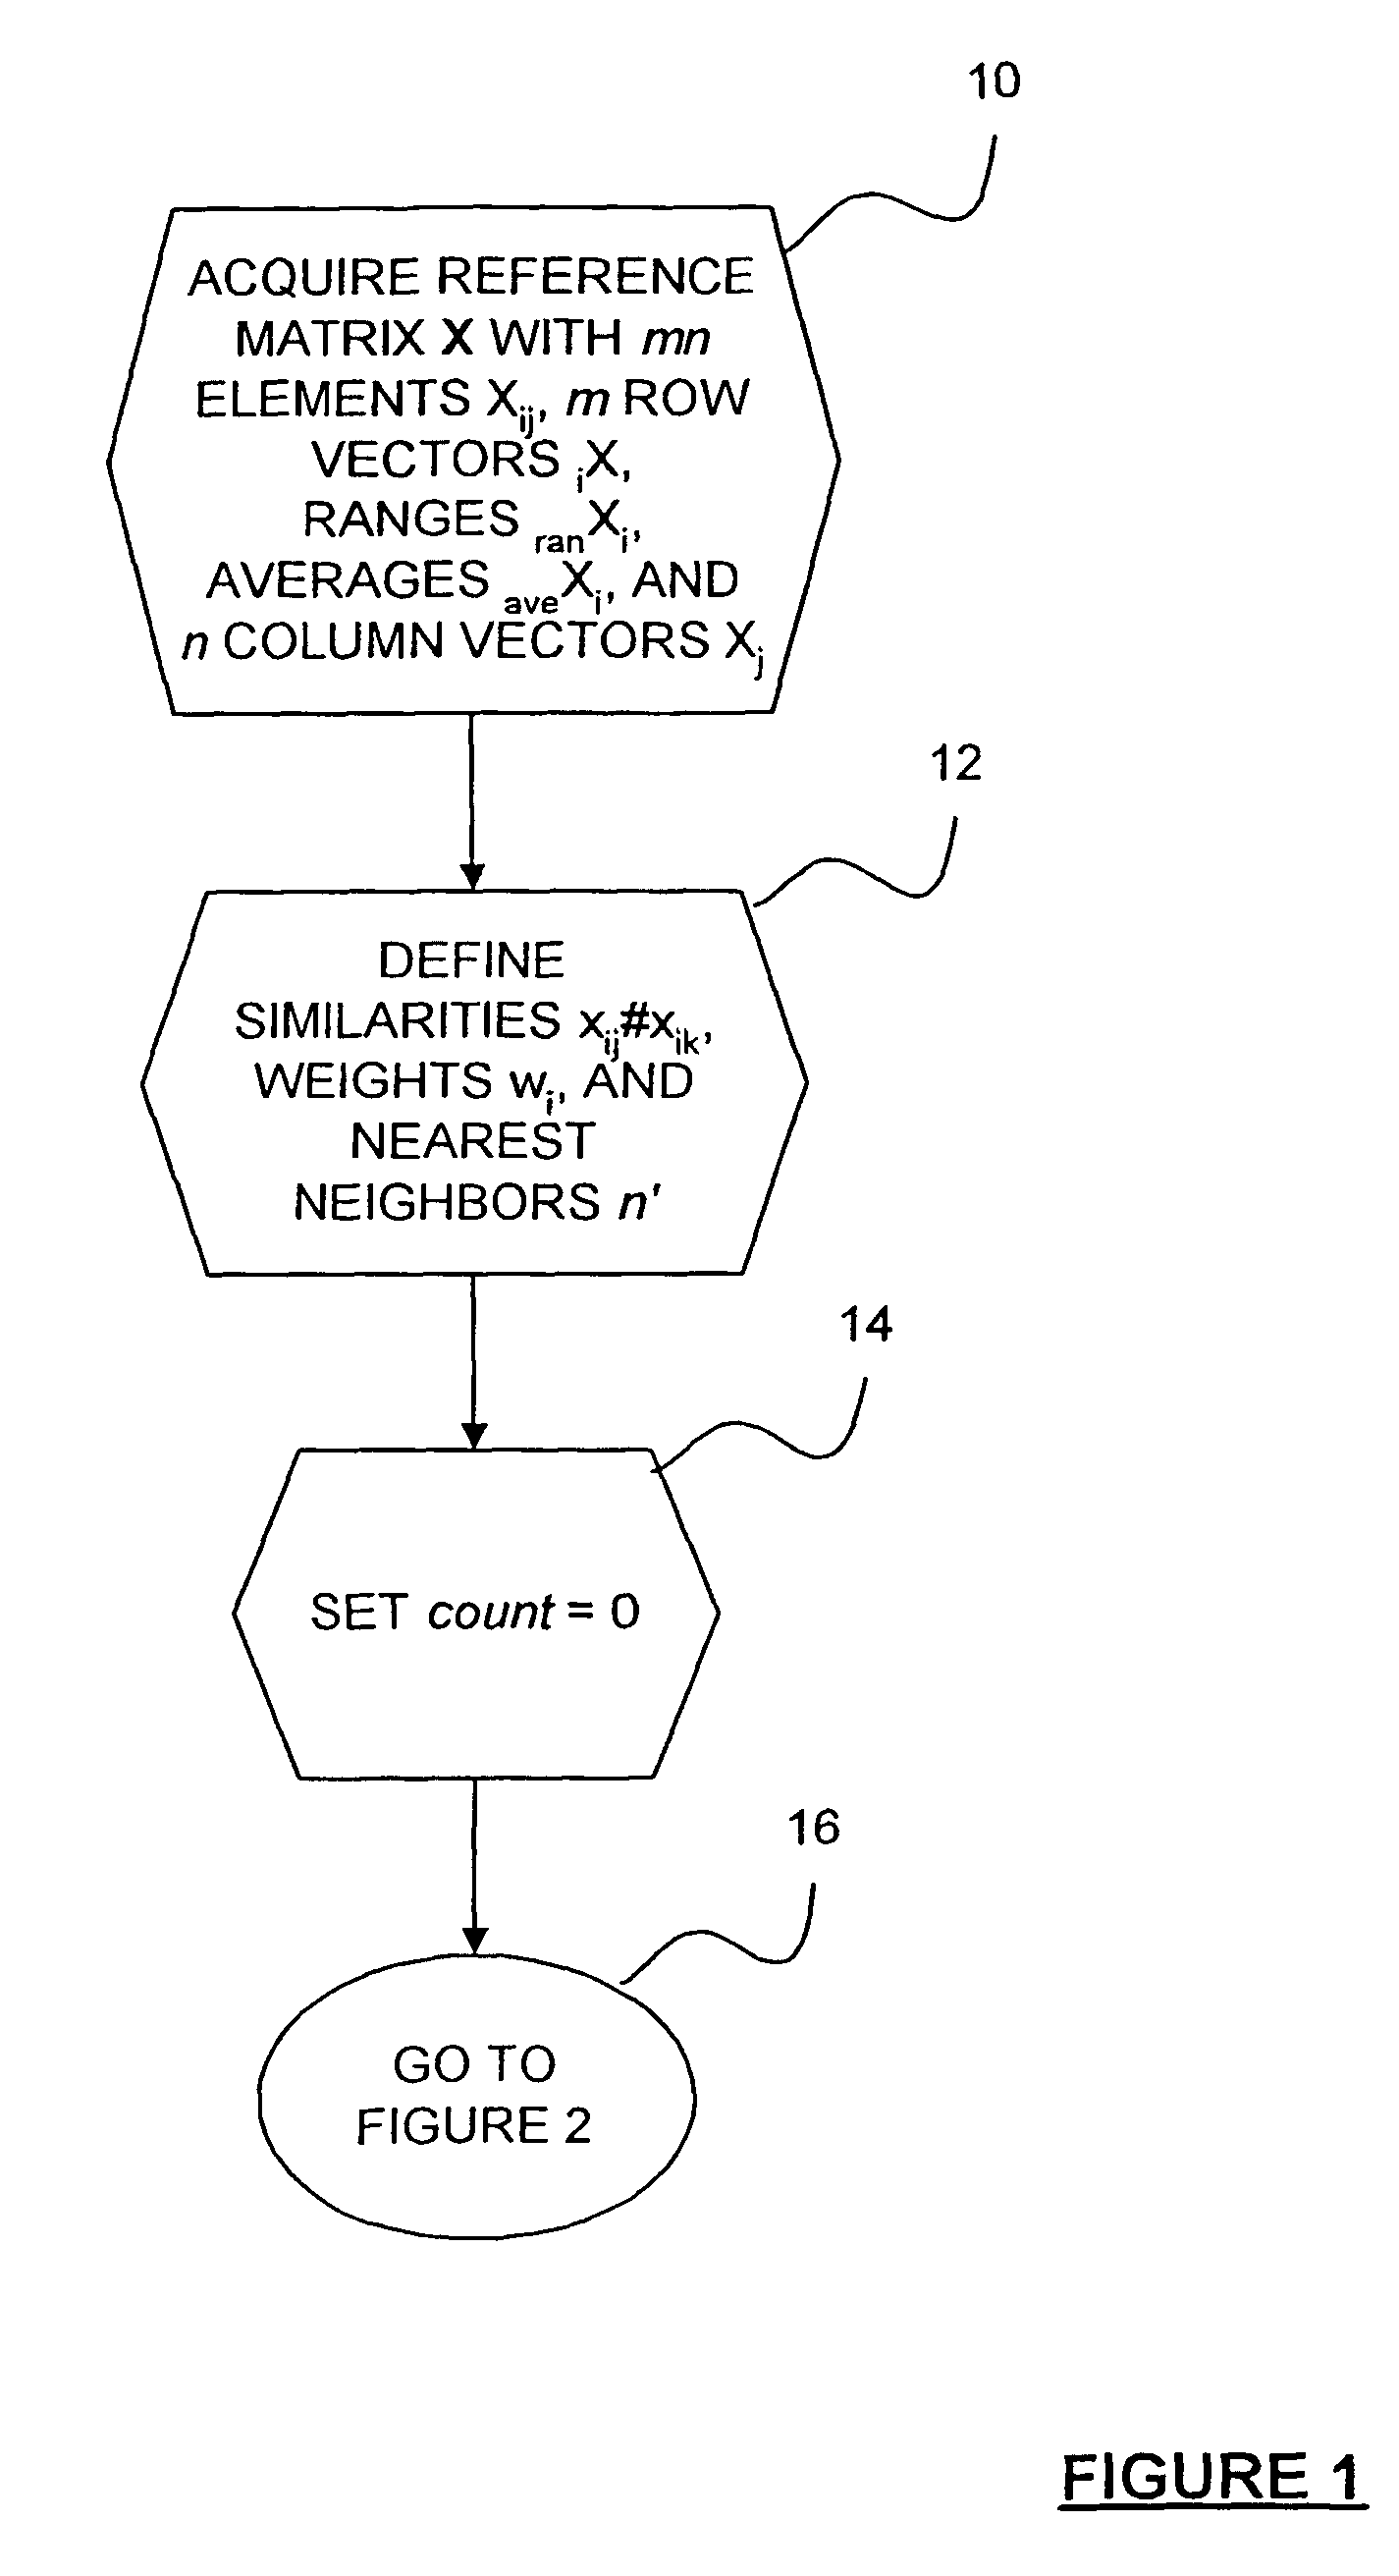
[0175]For this example, the FIG. 1 modeling parameter...


PUM


Abstract

A reference matrix contains valid measurements characterizing operation of a multivariate process (220). Modeling parameters of the reference matrix are derived (222–232). The final model parameters, balanced with respect to measuring and modeling uncertainties (232), are applied to model (204) a new set of measurements (200). If the new set has no faults (206) then all modeled values and modeling uncertainties (208) can be used to control the process (218). If the new set has only one fault (210) ten the modeled value and modeling uncertainty of the faulted measurement plus the measured values and measuring uncertainties of the unfaulted measurements (212) can be used to control the process (218) while repair procedures are implemented for the identified fault (216). If the new set has more than one fault (214) then the process (218) should be shut down, and repair procedures should be implemented (216) for all identified faults.

Description

REFERENCE TO RELATED APPLICATION[0001]This is a continuation-in-part of U.S. patent application Ser. No. 09 / 698,878 filed Oct. 26, 2000 now abandoned.TECHNICAL FIELD[0002]This invention facilitates identification, modeling and reduction of uncertainties in measurements of system or process variables which characterize the system or process.BACKGROUND[0003]Systems or processes that are intended to produce a desired result, say a consistently manufactured industrial product, can be described by inter-related variables. Often, the variables are directly correlated with each other, but there are also situations where the variables are consistent with one another without being directly correlated. For example, a steady-state process where the variables that describe the process are supposed to have constant values contains no correlations between pairs of variables when the process is operating correctly. A variable that is determined only by the totality of a number of other variables w...

Claims


Application Information

Patent Timeline
Patent Type & Authority Patents(United States)
IPC IPC(8): G06F17/16G05B17/02
CPCG05B17/02
Inventor MOTT, JACK EDWARD
Owner TRIANT TECH 2005
Why Eureka
Try Eureka