Spectrometric data cleansing

a technology of spectrometric data and data cleansing, applied in the field of data processing and enhancement, can solve the problems of spurious intensity readings at these pixels, distortion of captured spectra, errors in spectrum data interpretation, etc., and achieve the effect of lowering the background intensity

Active Publication Date: 2007-06-19
THERMO ELECTRONICS SCI INSTR LLC
View PDF4 Cites 16 Cited by
  • Summary
  • Abstract
  • Description
  • Claims
  • Application Information

AI Technical Summary

Problems solved by technology

A commonly encountered problem in the field of spectrometry is that spurious detector readings often arise, leading to distortions in captured spectra.
A spike of this nature is often caused by transient cosmic rays, which impinge upon and excite one or more pixels / elements of the detector and thus give rise to spurious intensity readings at these pixels.
Such spurious spikes can be mistaken for “real” spikes—those generated by scattered light from the sample—and they can therefore lead to errors in the interpretation of the spectrum data.
Averaging of the spectra will generally reduce the intensities of spurious readings, but will not fully eliminate them.
Further, averaging of multiple exposures increases the chances that spurious readings present in other exposures will also be introduced into the average, leading to further distortion in the spectrum to be analyzed.

Method used


Image

  • Spectrometric data cleansing
  • Spectrometric data cleansing
  • Spectrometric data cleansing

Examples


Embodiment Construction

[0021]The foregoing discussion merely relates to exemplary preferred versions of the invention, and these versions can be modified and enhanced in a variety of ways. Following is a review of certain exemplary modifications.

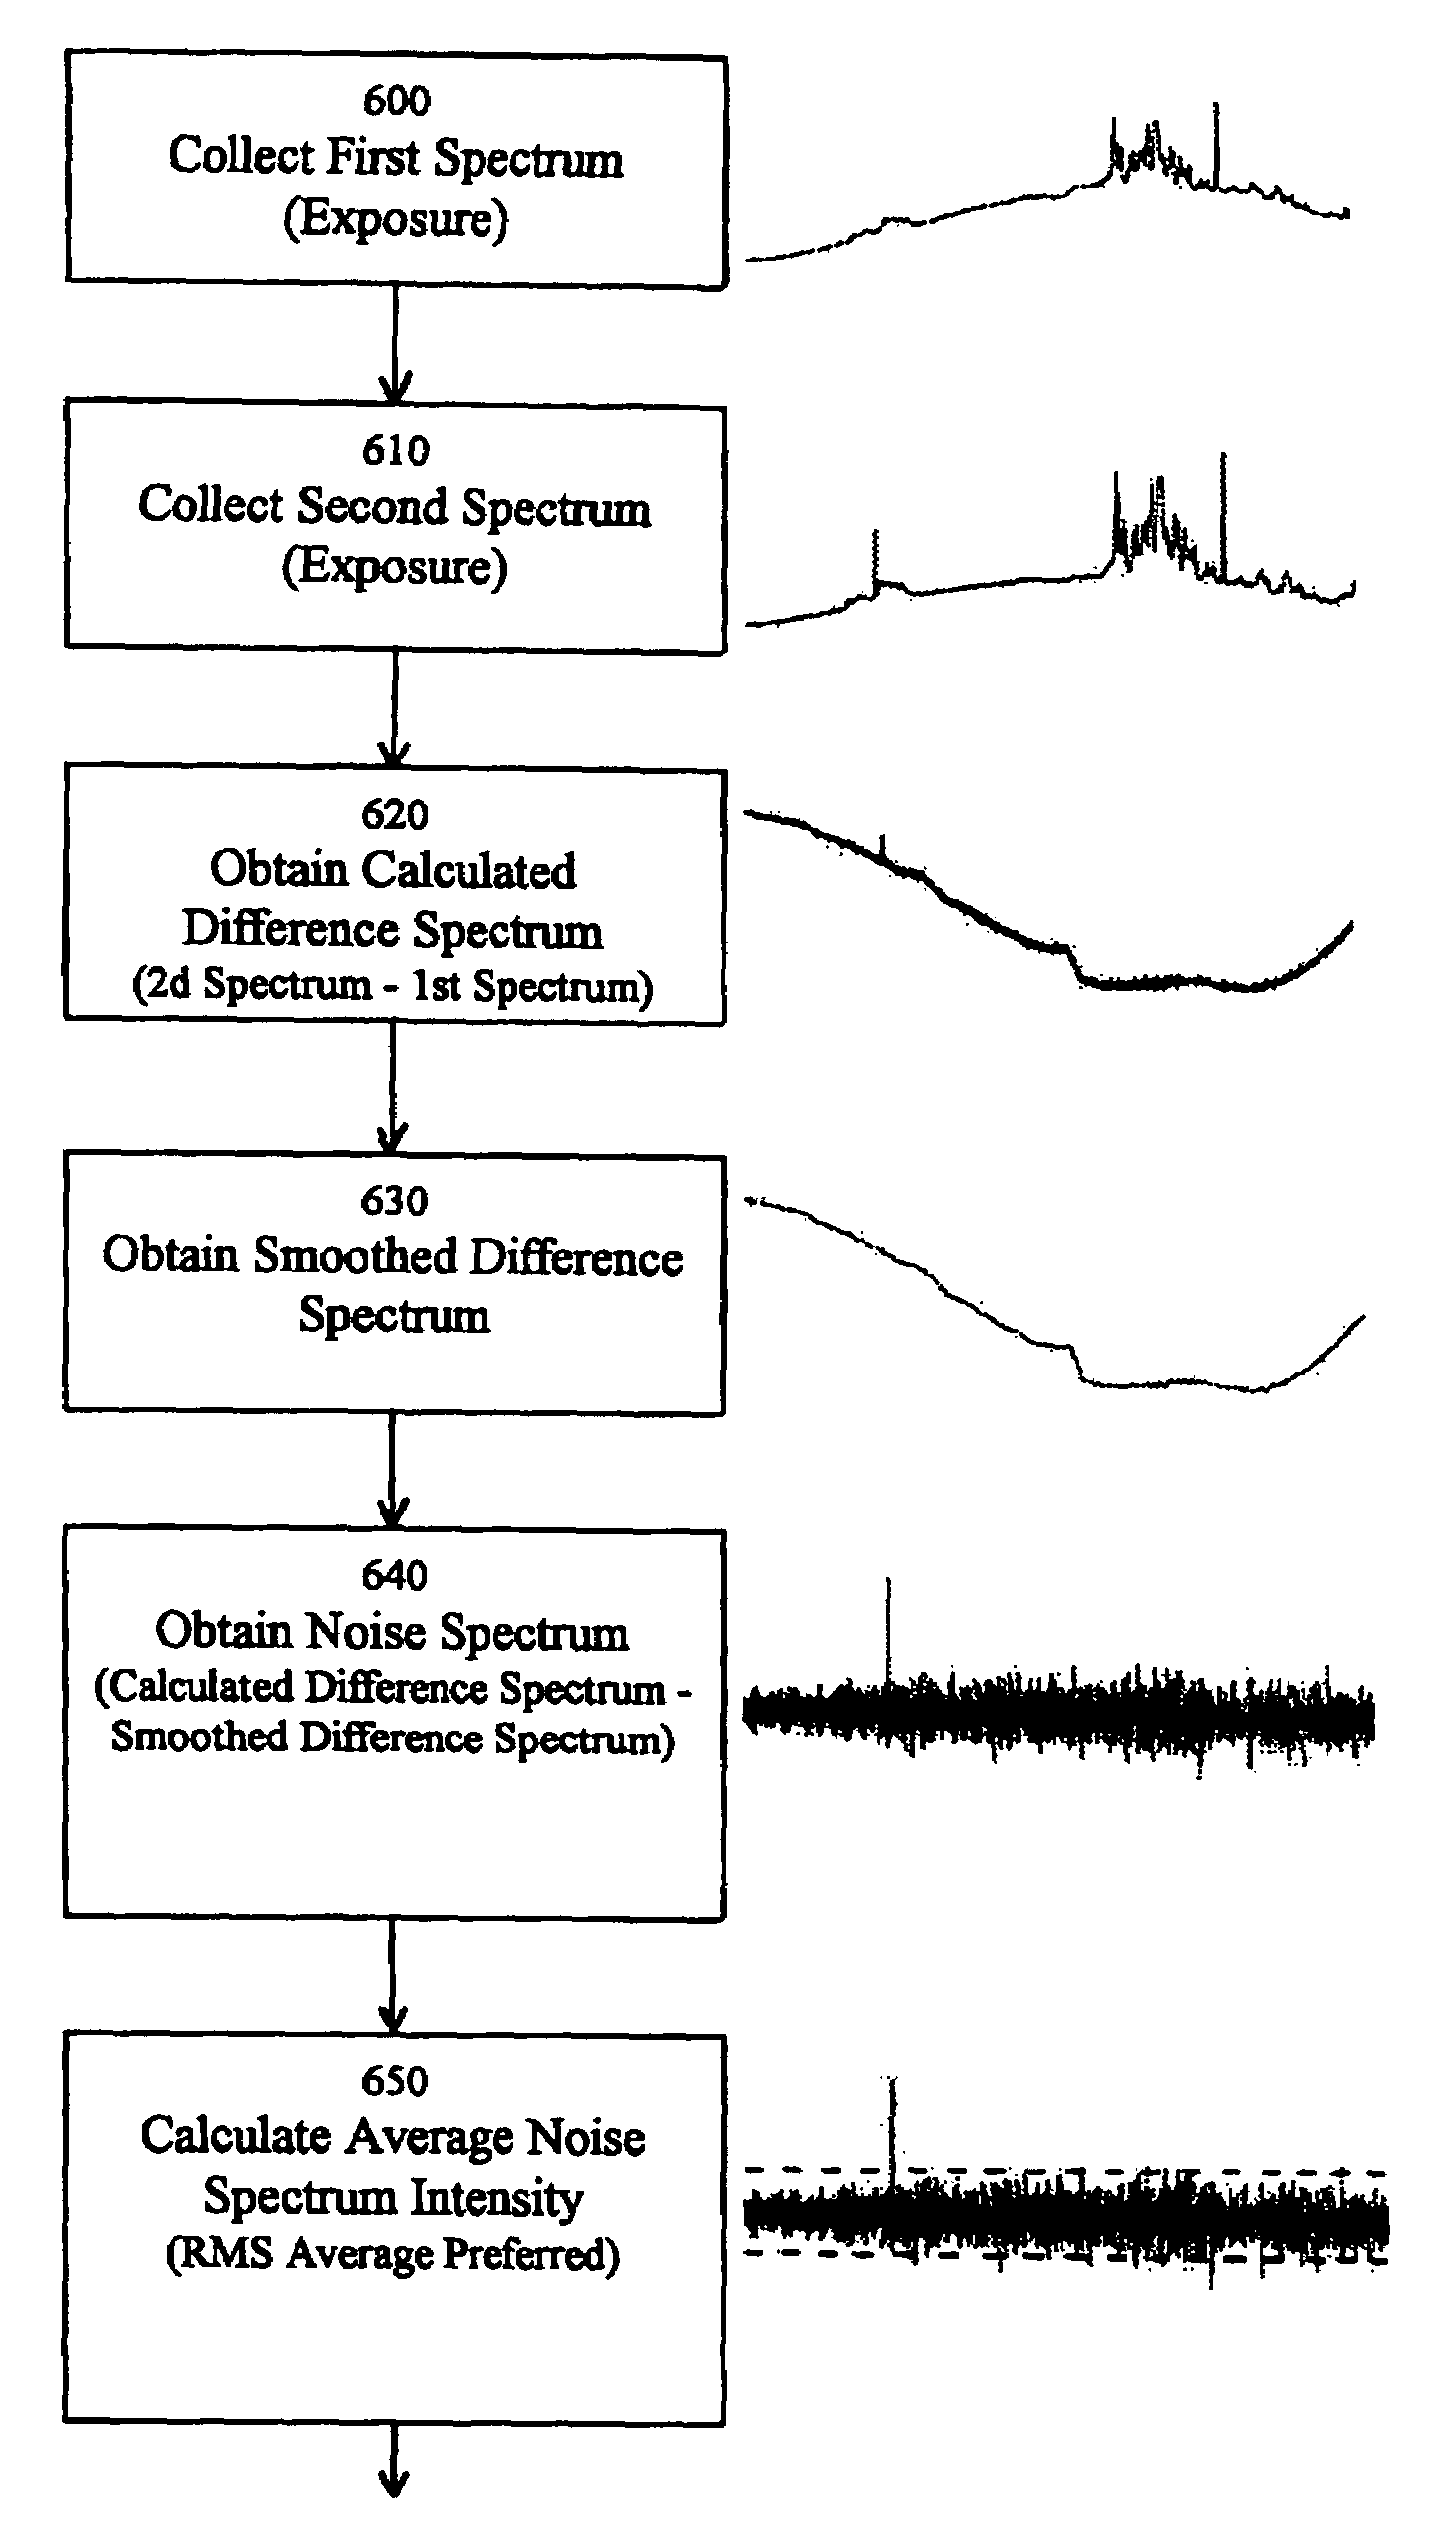
[0022]Initially, as discussed above, the average intensity of the noise spectrum may be used to define a cutoff intensity, and intensities in the noise spectrum which exceed the cutoff intensity (either above or below the zero intensity axis) to some desired degree can then be identified as distorted data points. Naturally, the value of any cutoff intensity based on the average intensity of the noise spectrum will vary depending on how the average noise spectrum intensity is calculated. As previously noted, the average intensity of the noise spectrum could be (but preferably is not) the simple arithmetic mean of all intensities across the noise spectrum (since positive and negative intensities will cancel). Thus, it is preferable to use some averaging method which...


PUM


Abstract

Spectra obtained from spectrographic readings from a sample can be filtered for artifacts, e.g., distorted data points arising from cosmic ray interference, by subtracting one spectrum from another to obtain a difference spectrum; smoothing the difference spectrum; and then calculating the difference between the smoothed and unsmoothed difference spectra to obtain a noise spectrum. The resulting noise spectrum, which represents localized differences between the original spectra, can then be reviewed for readings which exceed the norm by some predetermined amount (e.g., readings which exceed the average level of the noise spectrum by some percentage). These excessive readings constitute distorted data points, and the corresponding points on the spectra can have their values adjusted to eliminate the excessive readings, thereby removing the artifacts.

Description

FIELD OF THE INVENTION[0001]This document concerns an invention relating generally to processing and enhancement of data obtained by spectrometers (e.g., Raman, infrared, ultraviolet / visible, and other spectrometers), and more specifically to the removal of spurious data from spectrometric readings.BACKGROUND OF THE INVENTION[0002]Spectrometry is a well-known technique used to identify the characteristics of gas, liquid, and solid samples, wherein light is directed at a sample and the light leaving the sample is then picked up by a photosensitive detector to be analyzed for changes in wavelength. These changes provide information regarding the composition of the sample, its chemical bonds, and other features. As an example, FIG. 1 illustrates a spectrum (sometimes referred to as an “exposure”) obtained from a Raman spectrometer, wherein a laser is directed at a sample and the detector captures data regarding the light scattered from the sample. Here the spectrum data is presented as...

Claims


Application Information

Patent Timeline
Patent Type & Authority Patents(United States)
IPC IPC(8): G01R23/16
CPCG06K9/0051G01J3/44G06F18/00G06F2218/04
Inventor DALRYMPLE, DAVID
Owner THERMO ELECTRONICS SCI INSTR LLC
Why Eureka
Try Eureka