Manufacturing design and process analysis and simulation system

a simulation system and manufacturing technology, applied in the field of manufacturing design and process analysis and simulation system, can solve the problems of complex interactions and non-linearities, inability to determine the relationship, and inability to achieve the effect of linearity,

Inactive Publication Date: 2007-07-03
TUSZYNSKI STEVE W
View PDF17 Cites 36 Cited by
  • Summary
  • Abstract
  • Description
  • Claims
  • Application Information

AI Technical Summary

Benefits of technology

[0013]The present invention provides methods, apparatuses and systems that facilitate the design, production and / or measurement tasks associated with manufacturing and other processes. In one embodiment, the present invention relates to decision-making and logic structures, implemented in a computer software application, facilitating all phases of the design, development, tooling, pre-production, qualification, certification, and production process of any part or other article that is produced to specification. In one embodiment, the present invention provides knowledge of how the multiple characteristics of a given process output are related to each other, to specification limits and to pre-process inputs. This knowledge facilitates a reduction in measurement, analysis and reporting costs both prior to and during production. In various implementations, the present invention allows for one or more of the following: It determines the changes needed to pre-process inputs in order to achieve production at design targets. It provides a prioritized order for relaxing design tolerances. It assesses the feasibility of producing parts that meet specification limits. It assesses the trade-off between performance and producibility and provides design targets that improve producibility. It provides a determination of when process variability needs reduction. It facilitates material comparison and selection. It provides process engineers and operators with improved operating guidelines.
[0014]The present invention uses analytical techniques to accomplish the preceding objectives and advantages. As discussed below, graphical techniques, in one embodiment, can optionally be used in addition to, or in place of, analytical techniques. Graphical techniques, including but not limited to charts, graphs, and plots, can also be used to display analysis results. The present invention employs powerful statistical methodologies that, in one embodiment, allow for a determination of which and how many article characteristics should be measured, potentially reducing the cost and resource expenditure associated with measurement, recording, analysis and reporting. Embodiments of the present invention also assist design engineers in designing articles for producibility. Embodiments of the present invention can also be configured to provide critical information necessary for design engineers and tooling engineers to modify design requirements for process inputs in order to make it possible for manufacturing to hit design targets and stay within specification tolerance limits. Embodiments of the present invention can also be employed to identify, using a systems engineering approach, which article characteristics have the most restrictive targets and specification tolerance limits. Such information, for instance, allows for an evaluation of whether or not tolerances should be increased and, if so, which tolerances and on which article characteristic. The present invention can also be employed to reduce the cost of performing process capability studies by reducing, in some cases dramatically so, the number of process capability studies that must be conducted. These and other aspects of the present invention will be become apparent from the following description of preferred embodiments of the present invention.
[0015]In one embodiment, the present invention provides methods, apparatuses and systems that facilitate understanding and analysis of how the relationship between predicted article characteristics and one or more predictor article characteristics reflects the ability of a process to achieve a desired objective (e.g., the production of parts at target specification and / or within specification tolerances). In one embodiment, the present invention provides a process analysis system that generates a set of graphs and / or tables (such as Constraint Tables, Offset Tables and Relaxation Tables) that enable the user to understand and analyze the relationship among article characteristics to make powerful and informed decisions as to potential design or tooling, or pre-process dimensional or process changes. As discussed in more detail below, the relationship between the predictor characteristic and one or more given predicted article characteristics can be generally categorized into one of three possible situations: 1) where it is possible to produce an article outside of specification limits as to the predicted article characteristic; 2) where the predicted article characteristic is robust and will always be inside of specification limits; and 3) where the predicted article characteristic constrains the predictor article characteristic. In one embodiment, the present invention provides a methodology for analysis of the possible relationships between the predictor characteristic and the remaining article characteristics in order to determine, for example, which predicted article characteristics can be safely ignored, which predicted article characteristics will constrain the operating range or window relative to the predictor characteristic, and which predicted article characteristics could result in producing articles outside of design specification limits. With such a categorization of predicted article characteristics, users (such as design engineers, tooling engineers, process engineers, inspectors and the like) are then in position to make decisions as to how to treat each predicted article characteristic. For example, in the case where it is possible to produce defects, the user may decide to relax specification tolerances, and / or modify pre-process inputs, and / or constrain process variables. In addition, if a given predicted article characteristic is robust (within specification) for all possible values (at least within design specification limits) of the predictor article characteristic(s), the predicted article characteristic can be ignored, for example, during post-processing tasks such as part measurement and analysis associated with pre-qualification, qualification, certification and production activities. The present invention also facilitates analysis of the impact of predicted article characteristics that constrain the allowable range for the predictor article characteristic(s). As discussed in more detail below, the present invention allows a user to consider the impact of a constraining predicted article characteristic, and degree of constraint, on the producibility of the article as called out in a given design specification, and also allows for an assessment of the suitability of a given process to generate output that meets design specifications / requirements. As discussed in more detail below, embodiments of the present invention are operative to generate graphs, tables and charts, such as Scatter Charts, Constraint Tables, Offset Tables and Relaxation Tables, that support the analytical and decision-making tasks associated with manufacturing and other processes.

Problems solved by technology

Unfortunately, many manufacturing processes act like a black box.
It can be difficult in some of these cases to determine the relationship between the process control variables and the resulting article characteristic values.
Furthermore, time and economic constraints can make such a determination impractical even when this might be technically possible.
Simple interactions, complex interactions and non-linearities complicate the situation further.
In light of the preceding, it is often extremely difficult to establish the combination of factors from the large number of part design targets, part tolerance limits, mold design characteristics and injection molding press settings that produces acceptable articles.
Unfortunately, even after performing a designed experiment, there are still a large number of control variables that can affect the resulting articles.
Measuring the parts, recording and analyzing the data, and reporting the results, however, is a very expensive and resource consuming process.
If such abnormal data points are detected, the process is considered “out-of-control” (i.e., failing to yield a consistent predictable output) and production is immediately stopped to fix the process.
Since most parts have many different dimensions, measurement and SPC analysis have usually been applied to a large number of part dimensions for each part, increasing the time and expense associated with production.
However, SPC is far less expensive in the long run than shipping unacceptable parts and / or having to sort acceptable parts from unacceptable parts.
It has also been difficult for manufacturers (and their customers) to determine 1.) what percentage of the dimensions should be monitored using SPC and 2.) which dimensions should be measured if the full set of dimensions is not monitored.
However, economic constraints can result in fewer than the desired number of dimensions being measured and analyzed.
Reducing natural variation is also an expensive proposition since many relatively small common causes of variation are present.

Method used


Image

  • Manufacturing design and process analysis and simulation system
  • Manufacturing design and process analysis and simulation system
  • Manufacturing design and process analysis and simulation system

Examples


Embodiment Construction

I. Background and Operating Principles

A. Principles and Concepts

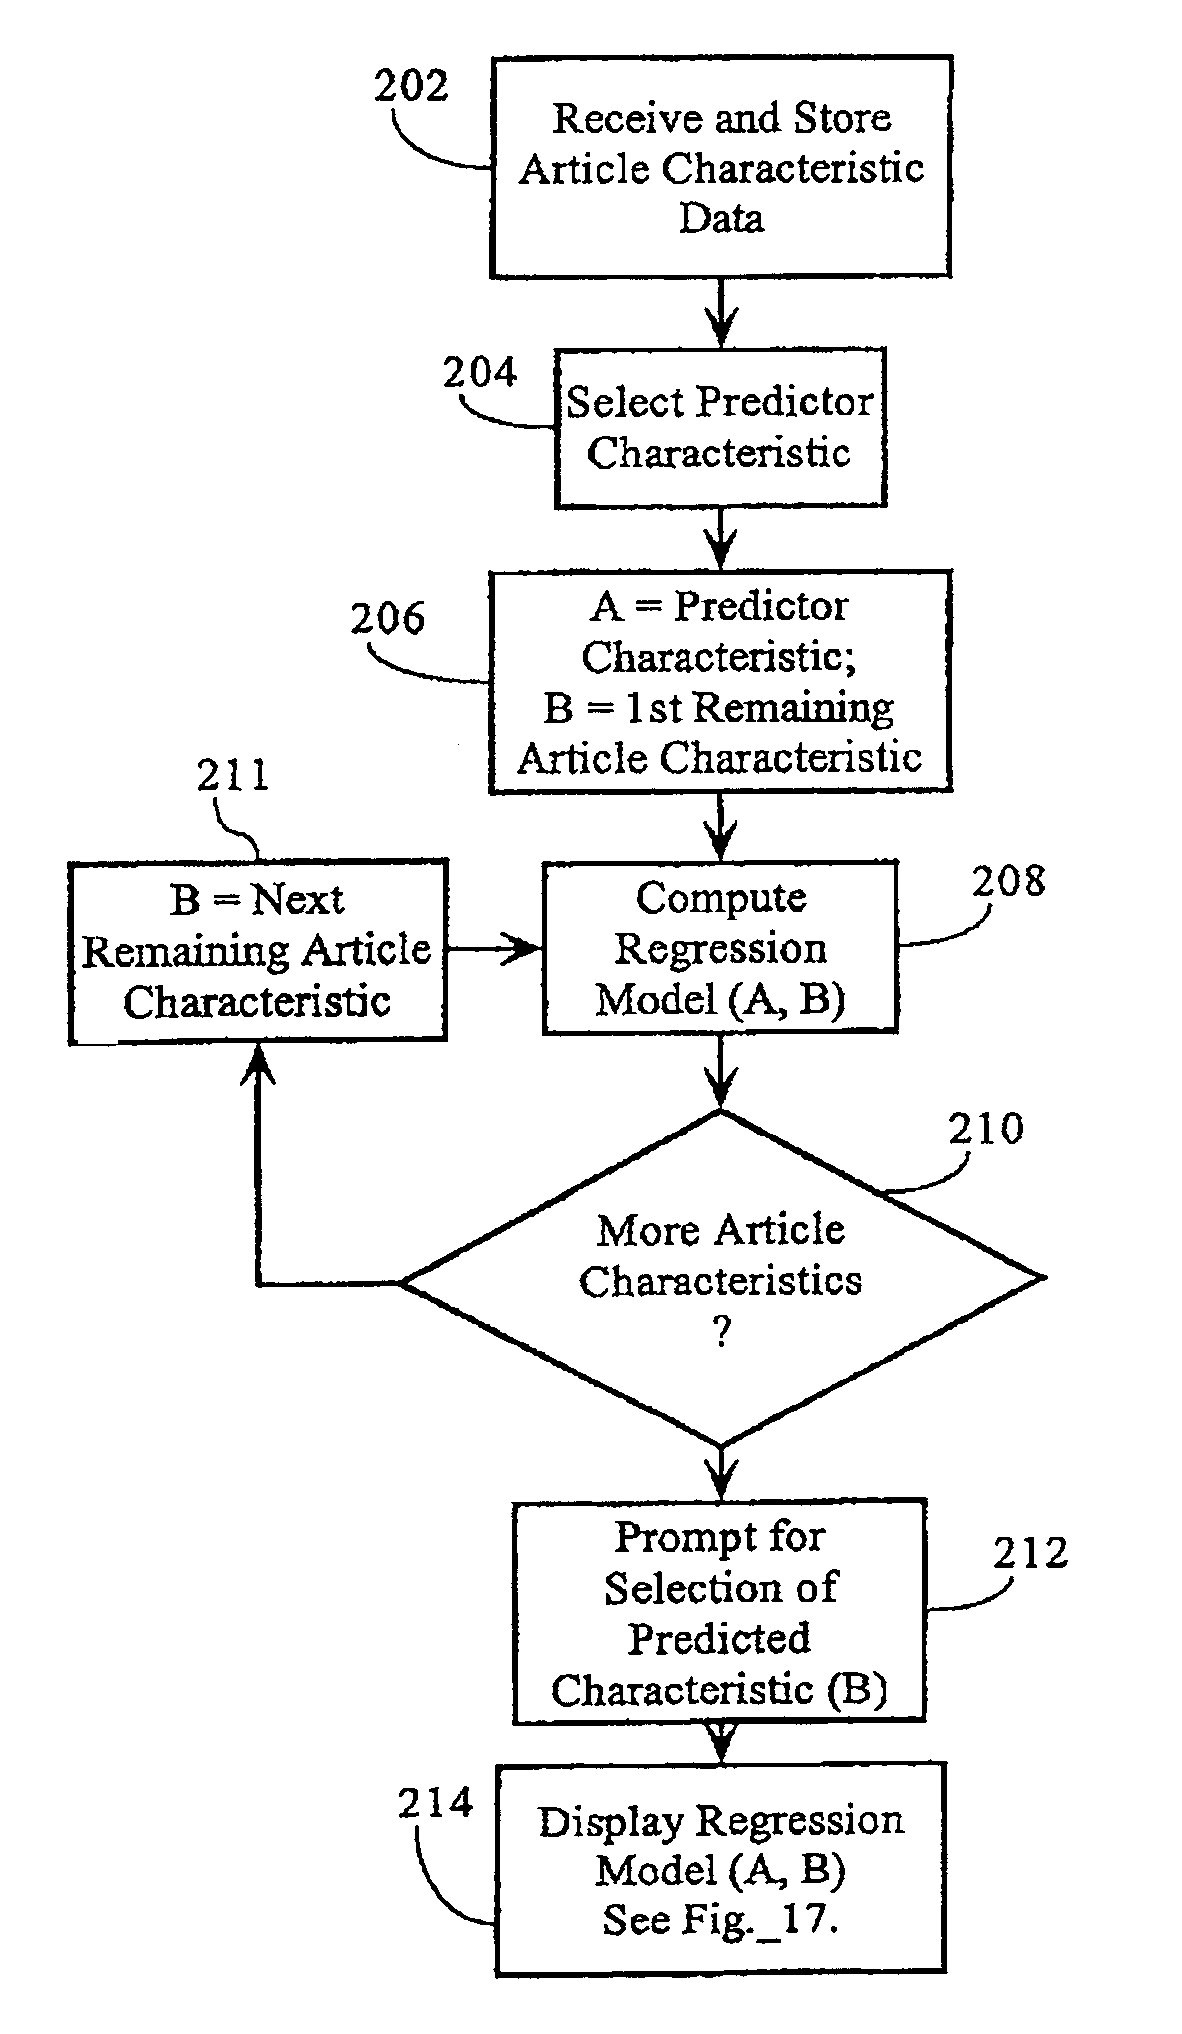
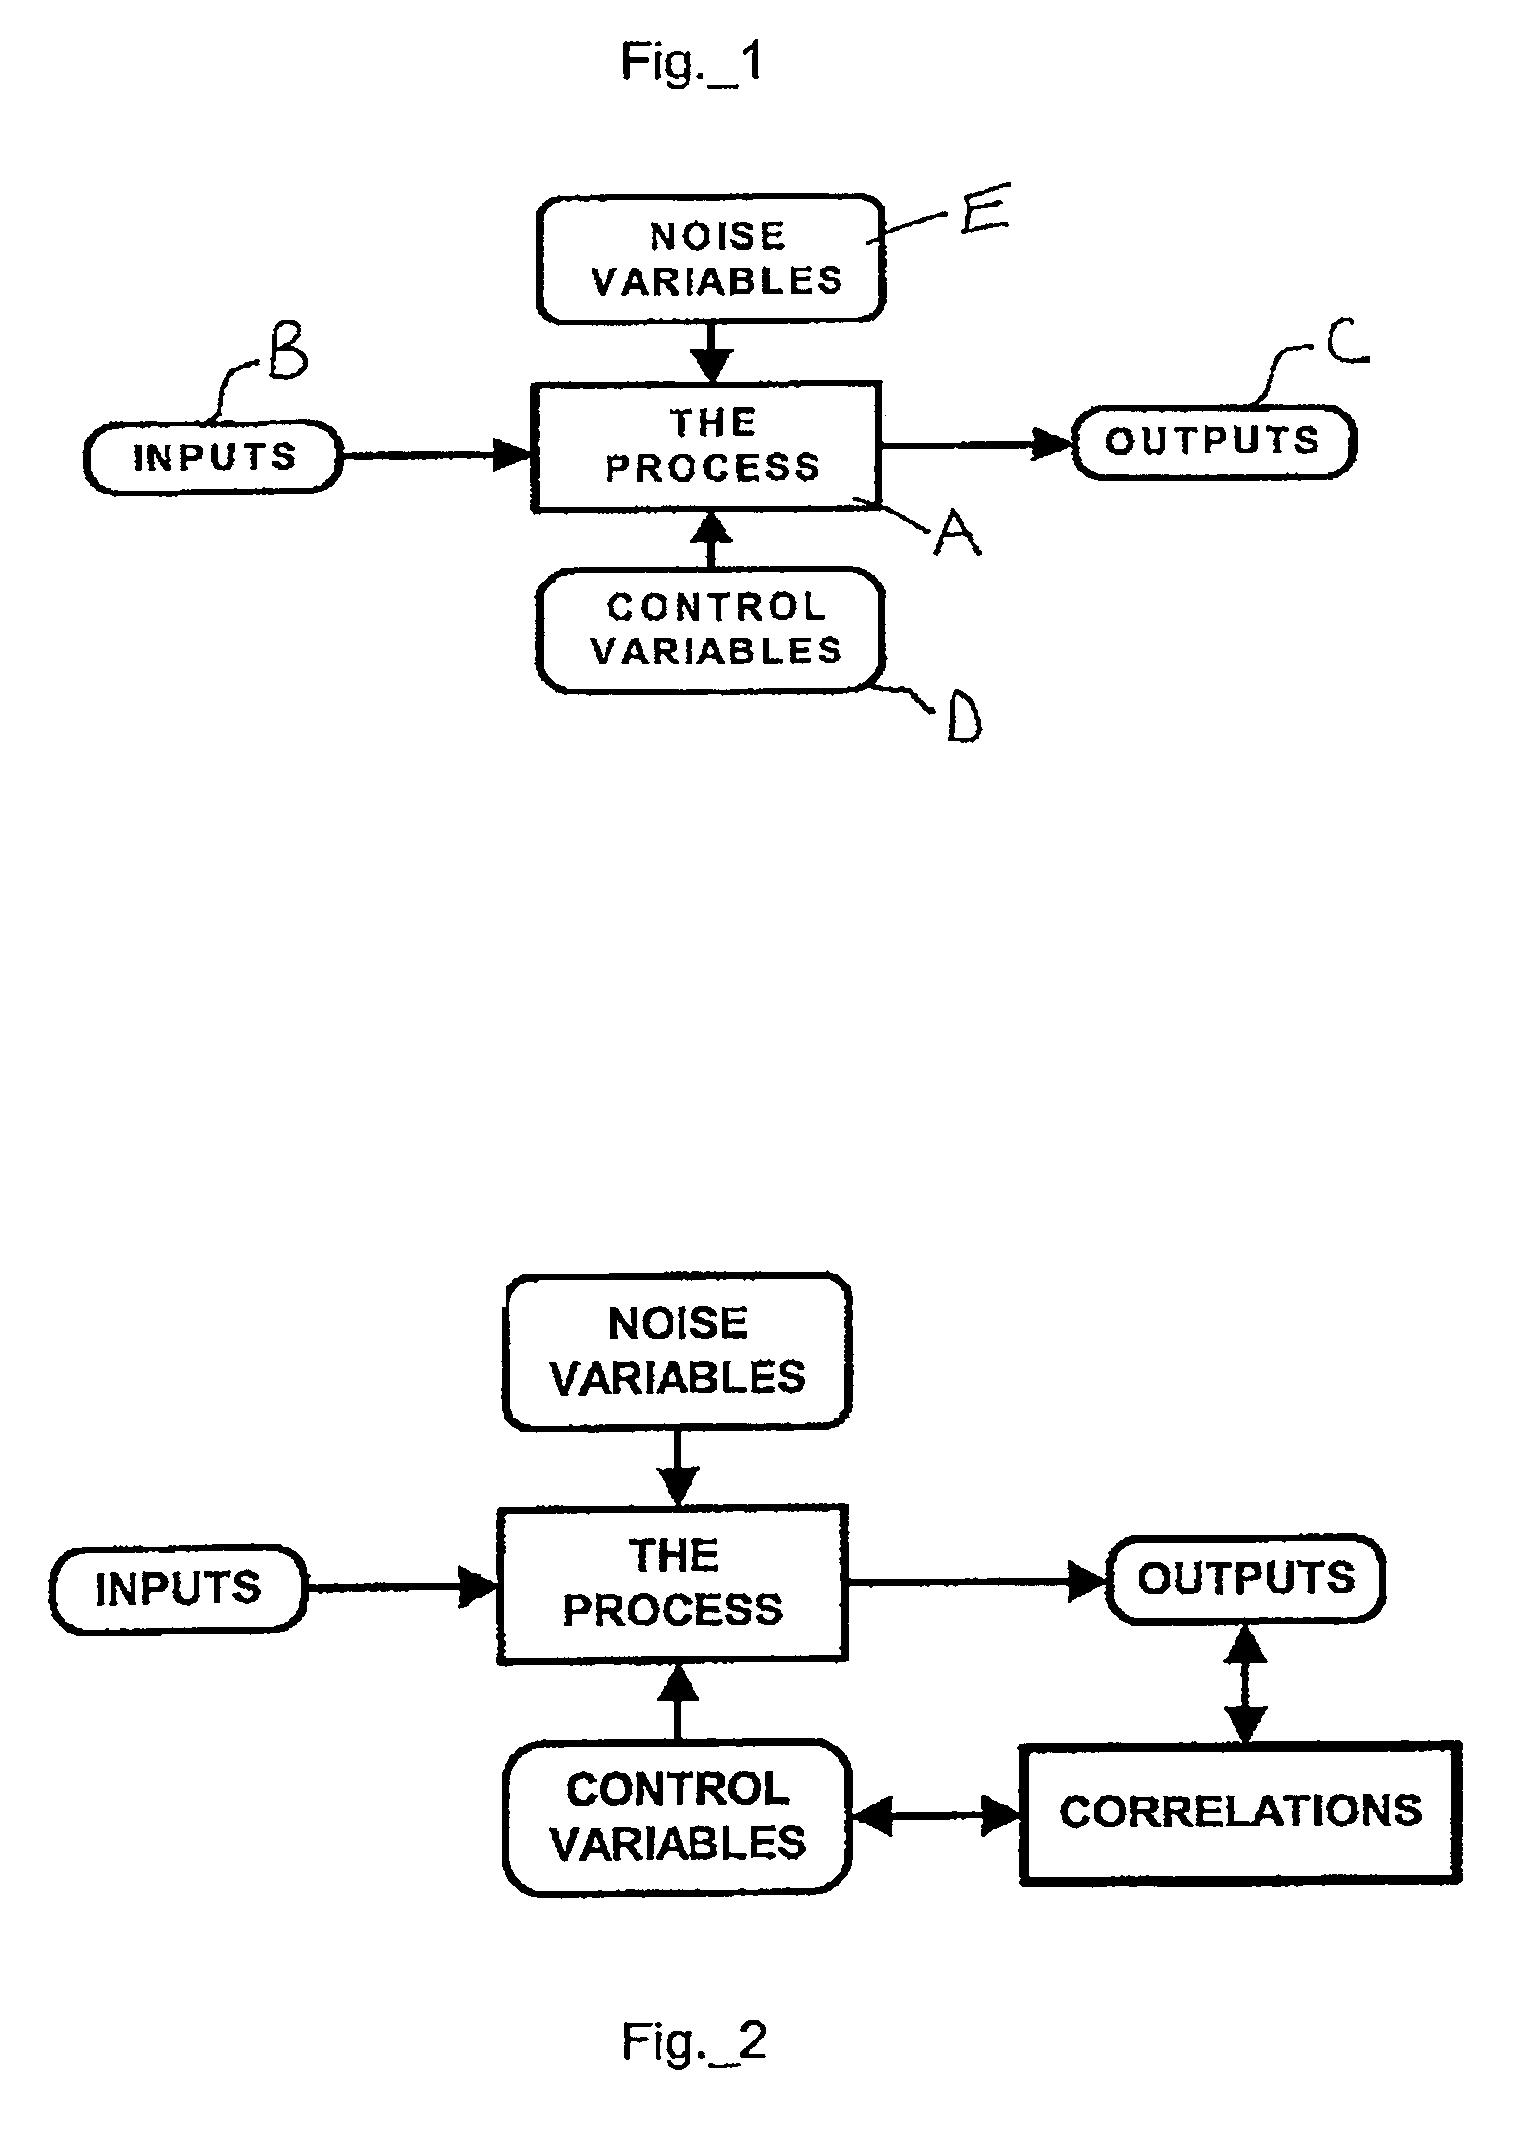
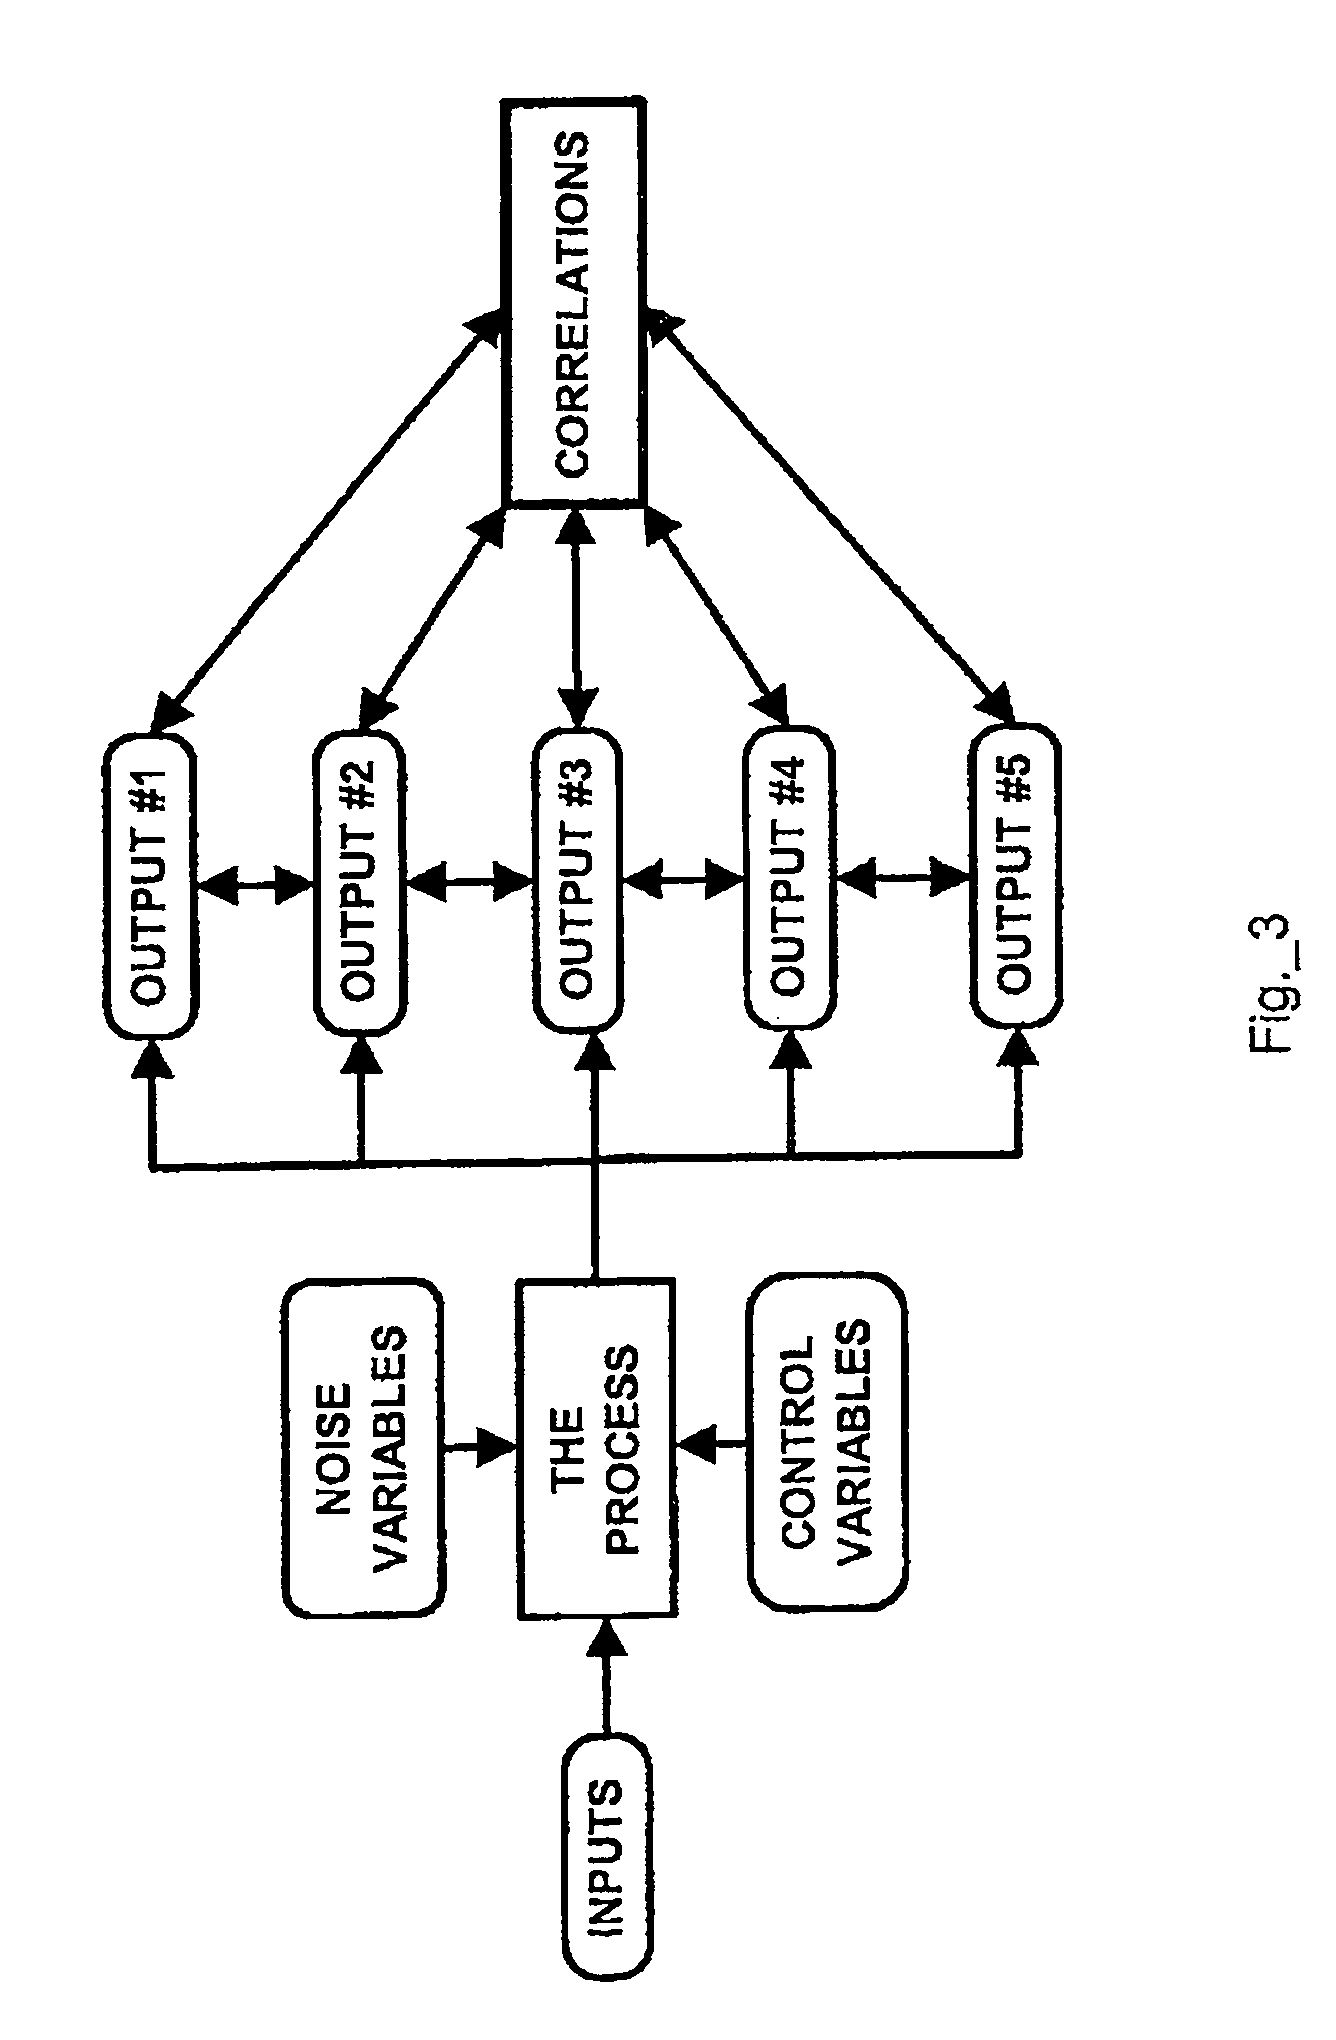
[0079]The present invention utilizes several graphical, statistical and mathematical techniques directed to analyzing the relationship between article characteristics to achieve a novel design and manufacturing process analysis system. Among these are scatter diagrams, correlation coefficients, coefficients of determination, linear, non-linear and multi-variate regression, prediction intervals, adjusted prediction intervals, prediction using regression, prediction using prediction intervals, DOE, averages and weighted averages. FIG. 3 is a process diagram illustrating how an aspect of the present invention differs from prior art techniques. In a wide variety of manufacturing processes, and injection molding in particular, there is often a strong relationship between article characteristics resulting from a given process. The present invention assesses the statistical strength of these relationships and, when they are su...


PUM


Abstract

A process simulation system that simulates the operation of the manufacturing and measurement systems used to produce and measure the articles being analyzed relative to engineering design targets, engineering design tolerances, producibility and / or quality. In one embodiment, the user is able to assess, without risk or production cost while accelerating speed-to-market, the effect of contemplated changes (i.) to engineering design targets, (ii.) to engineering design tolerances, (iii.) to tooling, (iv.) to part pre-process dimensions and (v.) to the measurement system—on manufactured part dimensions, producibility and quality (i.) without modifying tooling, (ii.) without changing part pre-process dimensions, (iii.) without producing new parts, (iv.) without measuring article characteristics on the new parts and (v.) without changing the measurement system. The simulation functionalities, according to embodiments of the present invention, enable the user to verify whether or not the contemplated changes will have the desired effect without incurring the time and expense involved in actually making the changes, producing parts, measuring part characteristics, changing the measurement system and then determining whether the changes accomplished the desired objectives.

Description

CROSS-REFERENCE TO RELATED APPLICATIONS[0001]The present application is a continuation-in-part of U.S. patent application Ser. No. 10 / 752,843, filed on Jan. 7, 2004 which is a continuation of U.S. patent application Ser. No. 10 / 357,690 filed on Feb. 4, 2003 now U.S. Pat. No. 6,687,558, which is a continuation-in-part application of and commonly-owned U.S. Pat. application Ser. No. 10 / 067,704 filed Feb. 4, 2002 now U.S. Pat. No. 7,072,808 both of which are incorporated herein by reference for all purposes. The Present application also claims priority from U.S. Provisional Application Ser. No. 60 / 491,148 filed Jul. 30, 2003 and entitled “Manufacturing Design and Process Analysis and Simulation System.”FIELD OF THE INVENTION[0002]The present invention relates to manufacturing, design, tooling, and process engineering and, in one embodiment, to methods, apparatuses and systems facilitating the design, tooling, production and / or measurement tasks associated with manufacturing and other p...

Claims


Application Information

Patent Timeline
Patent Type & Authority Patents(United States)
IPC IPC(8): G06F17/10G05B13/02G06F
CPCG05B17/02
Inventor TUSZYNSKI, STEVE W.
Owner TUSZYNSKI STEVE W
Why Eureka
Try Eureka