[0017]The present invention provides methods, apparatuses and systems that facilitate the design, production and / or measurement tasks associated with manufacturing and other processes. In one embodiment, the present invention relates to decision-making and logic structures, implemented in a
computer software application, facilitating all phases of the design, development, tooling, pre-production, qualification, certification, and production process of any part or other article that is produced to specification. In one embodiment, the present invention provides knowledge of how the multiple characteristics of a given
process output are related to each other, to specification limits and to pre-process inputs. This knowledge facilitates a reduction in measurement, analysis and reporting costs both prior to and during production. It also determines the changes needed to pre-process inputs in order to achieve production at design targets. It provides a prioritized order for relaxing design tolerances. It assesses the feasibility of producing parts that meet specification limits. It assesses the trade-off between performance and producibility and provides design targets that improve producibility. It provides a determination of when
process variability needs reduction. It facilitates material comparison and selection. It provides process engineers and operators with improved operating guidelines.
[0018]The present invention uses analytical techniques to accomplish the preceding objectives and advantages. As discussed below, graphical techniques, in one embodiment, can optionally be used in place of analytical techniques. Graphical techniques, including but not limited to charts, graphs, and plots, can also be used to display analysis results. The present invention employs powerful statistical methodologies that, in one embodiment, allow for a determination of which and how many article characteristics should be measured, potentially reducing the cost and resource expenditure associated with measurement, recording, analysis and reporting. Embodiments of the present invention also assist design engineers in designing articles for producibility. Embodiments of the present invention can also be configured to provide critical information necessary for design engineers and tooling engineers to modify design requirements for process inputs in order to make it possible for manufacturing to hit design targets and stay within specification tolerance limits. Embodiments of the present invention can also be employed to identify, using a
systems engineering approach, which article characteristics have the most restrictive targets and specification tolerance limits. Such information, for instance, allows for an evaluation of whether or not tolerances should be increased and, if so, which tolerances and on which article characteristic. The present invention can also be employed to reduce the cost of performing
process capability studies by reducing, in some cases dramatically so, the number of
process capability studies that must be conducted. These and other aspects of the present invention will be become apparent from the following description of preferred embodiments of the present invention.
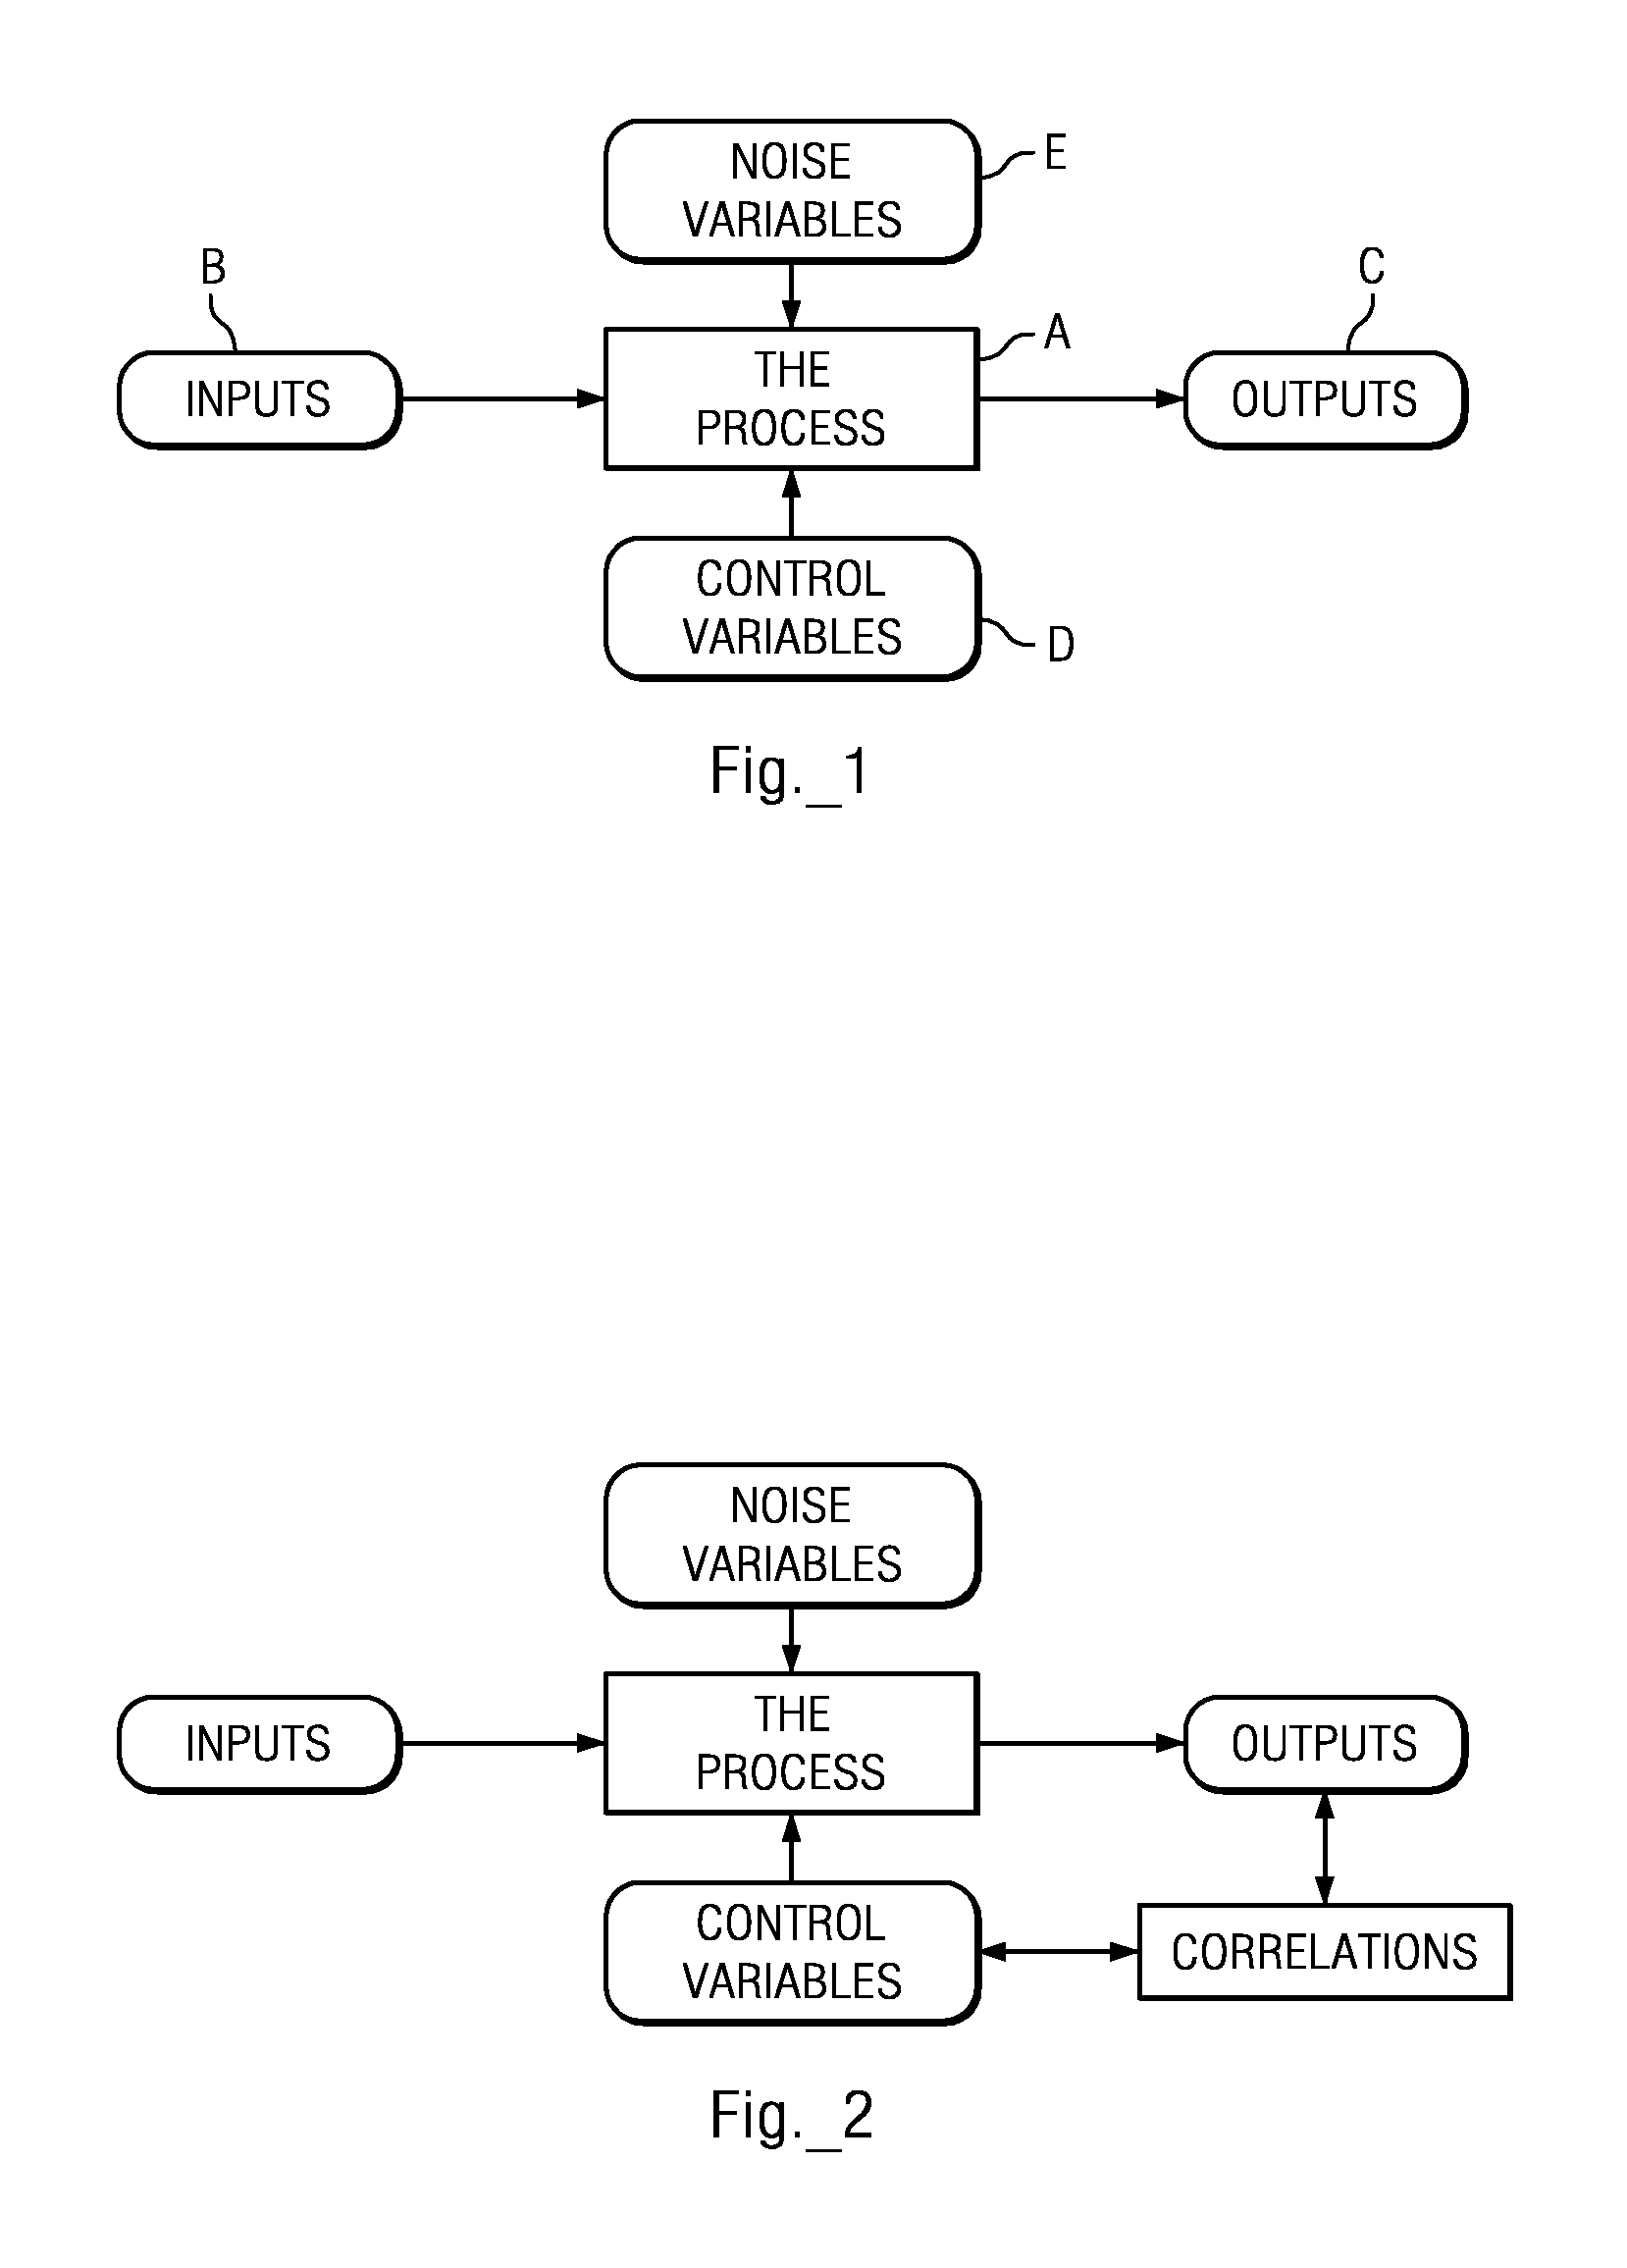
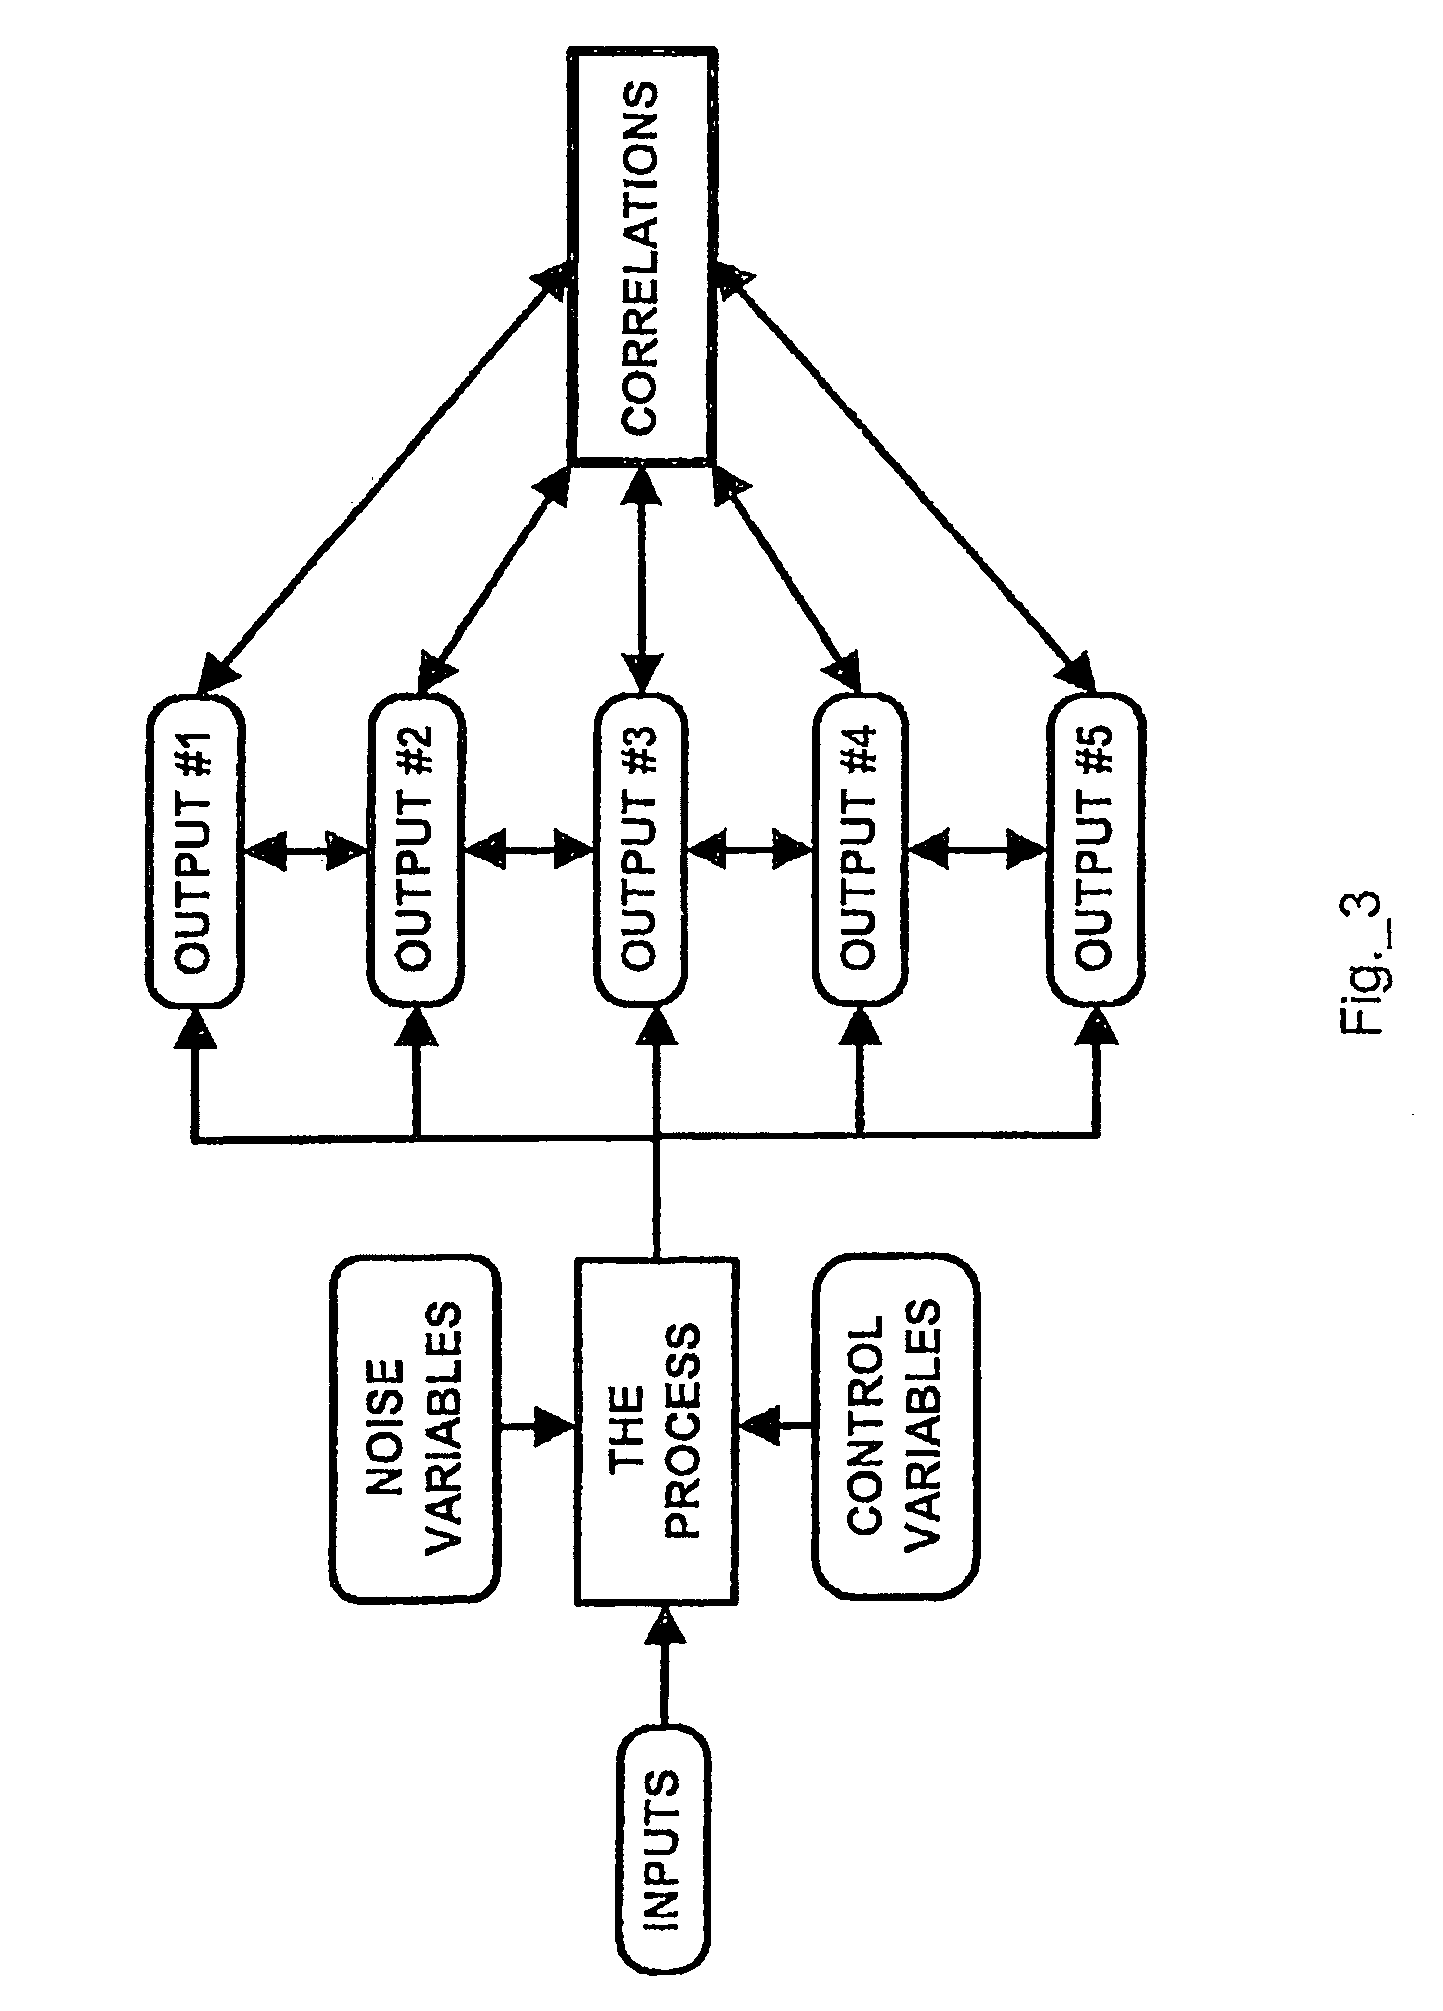
[0019]In one embodiment, the present invention provides methods, apparatuses and systems that facilitate understanding and analysis of how the relationship between predicted article characteristics and one or more predictor article characteristics reflects the ability of a process to achieve a desired objective (e.g., the production of parts at target specification and / or within specification tolerances). In one embodiment, the present invention provides a
process analysis system that generates a set of graphs and / or tables (such as Constraint Tables, Offset Tables and Relaxation Tables) that enable the user to understand and analyze the relationship among article characteristics to make powerful and informed decisions as to potential design or tooling, or pre-process dimensional or
process changes. As discussed in more detail below, the relationship between the predictor characteristic and one or more given predicted article characteristics can be generally categorized into one of three possible situations: 1) where it is possible to produce an article outside of specification limits as to the predicted article characteristic; 2) where the predicted article characteristic is robust and will always be inside of specification limits; and 3) where the predicted article characteristic constrains the predictor article characteristic. In one embodiment, the present invention provides a methodology for analysis of the possible relationships between the predictor characteristic and the remaining article characteristics in order to determine, for example, which predicted article characteristics can be safely ignored, which predicted article characteristics will constrain the operating range or window relative to the predictor characteristic, and which predicted article characteristics could result in producing articles outside of
design specification limits. With such a
categorization of predicted article characteristics, users (such as design engineers, tooling engineers, process engineers, inspectors and the like) are then in position to make decisions as to how to treat each predicted article characteristic. For example, in the case where it is possible to produce defects, the user may decide to relax specification tolerances, and / or modify pre-process inputs, and / or constrain process variables. In addition, if a given predicted article characteristic is robust (within specification) for all possible values (at least within
design specification limits) of the predictor article characteristic(s), the predicted article characteristic can be ignored, for example, during post-
processing tasks such as part measurement and analysis associated with pre-qualification, qualification, certification and production activities. The present invention also facilitates analysis of the
impact of predicted article characteristics that constrain the allowable range for the predictor article characteristic(s). As discussed in more detail below, the present invention allows a user to consider the
impact of a constraining predicted article characteristic, and degree of constraint, on the producibility of the article as called out in a given
design specification, and also allows for an assessment of the suitability of a given process to generate output that meets design specifications / requirements. As discussed in more detail below, embodiments of the present invention are operative to generate graphs, tables and charts, such as Scatter Charts, Constraint Tables, Offset Tables and Relaxation Tables, that support the analytical and decision-making tasks associated with manufacturing and other processes.
[0020]The present invention, in one implementation, provides methods, apparatuses and systems directed to facilitating the optimization or improvement of manufacturing processes relative to one or more criteria. In some implementations, the present invention facilitates the optimization of manufacturing processes relative to one or more attributes—such as
cycle time, cost, and performance—while still optimizing
process output relative to design specifications for a given article characteristic. For example, not only can the present invention be utilized to facilitate the manufacture of parts at
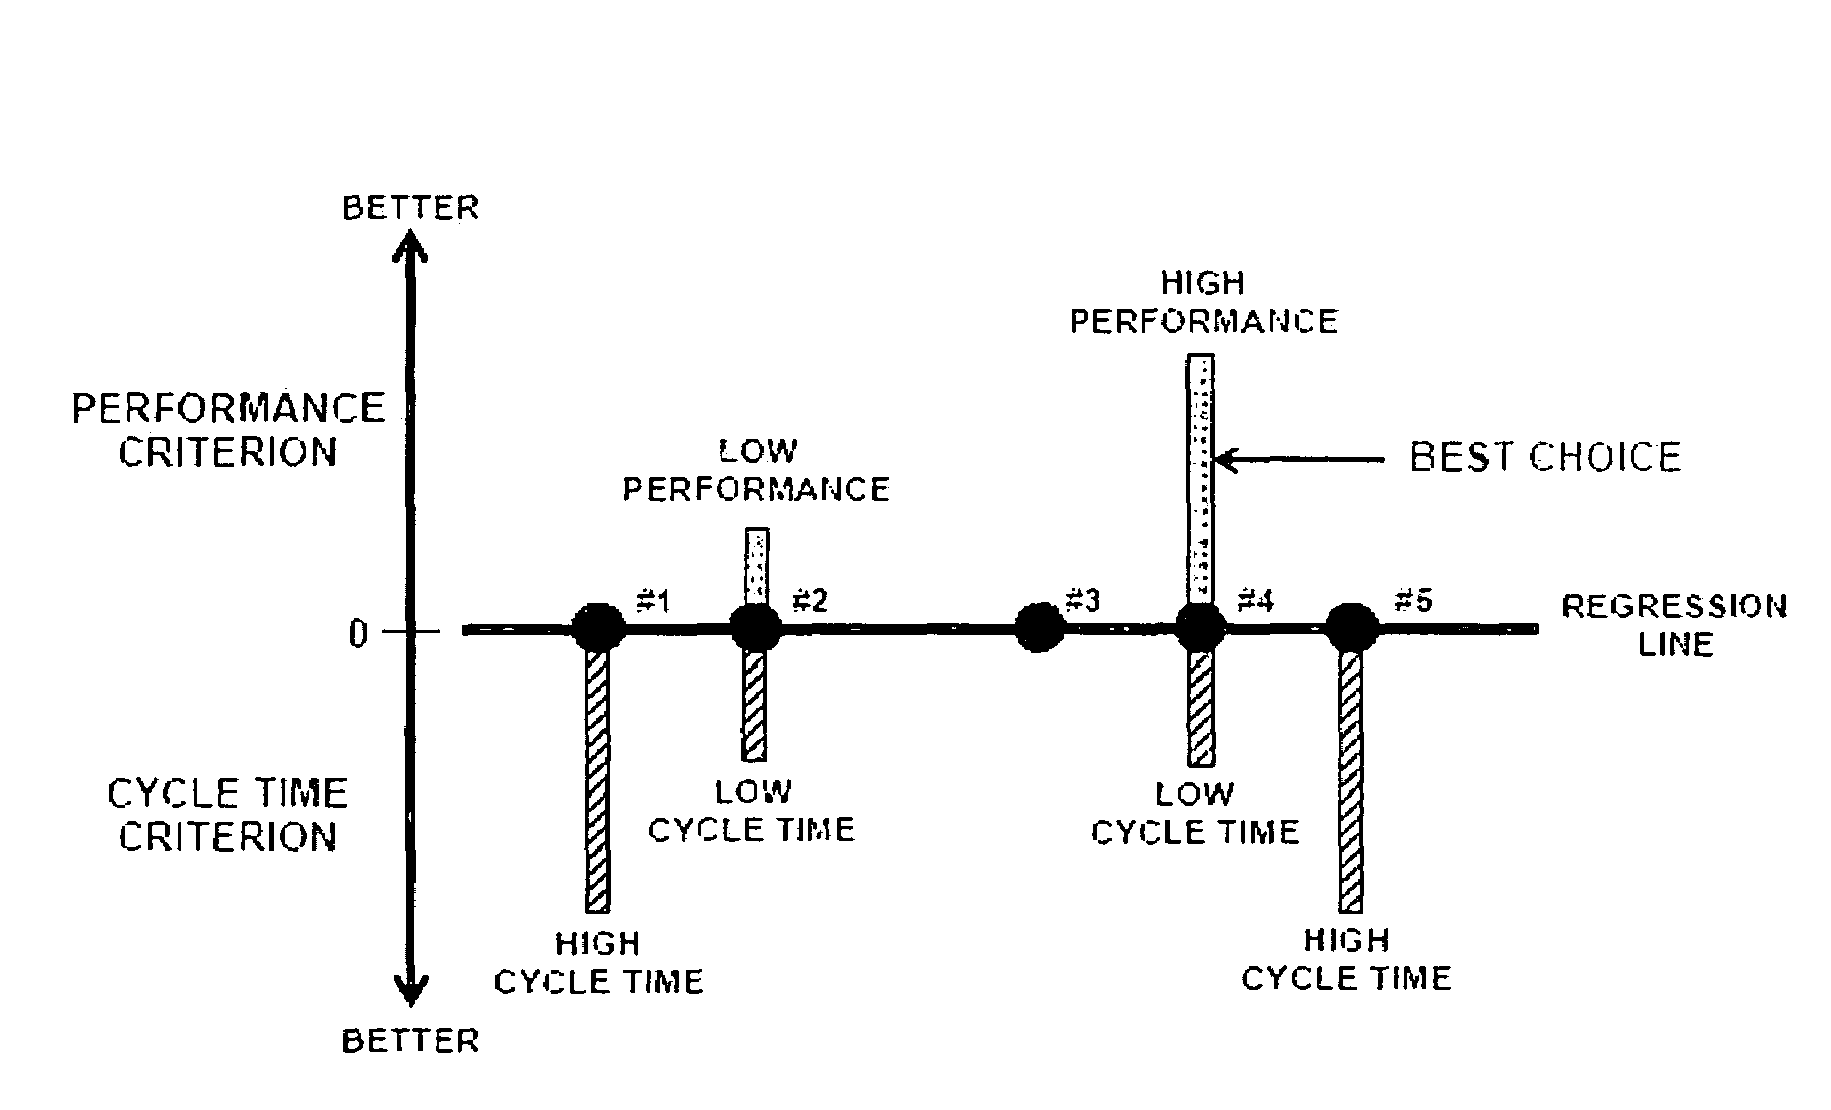
engineering design targets and / or within specification limits, implementations of the present invention can be used to select process condition sets that are more preferable or optimal relative to one or more selection criteria. For example, the present invention can be applied to enable or facilitate production of articles or parts at the minimum
cycle time, minimum cost and / or maximum performance while still maintaining the highest quality, greatest producibility, lowest
scrap, lowest
rework, least measurement, least SPC analysis, least
process capability analysis and / or the quickest New Product Development (NPD) time.
[0021]As discussed above, variation of
process conditions, such as injection mold press settings (e.g., cycle time,
hold time,
cooling time, hold pressure, mold temperature, etc.), results in articles having a range of variation as to their respective article characteristics. The regression models between article characteristics, described above, provide graphic and mathematical models of how article characteristics vary relative to each other. In one implementation, the present invention facilitates assessment of the effect of different process condition sets on the resulting article characteristic values, and the selection of a process condition set based on one or more
process optimization criteria. Still further, implementations of the present invention can further facilitate an analysis of the changes to the process and / or design specifications, based around a selected process condition set, that will further optimize the process.


