Data analysis techniques for dynamic power simulation of a CPU

a data analysis and power simulation technology, applied in the field of microprocessor design, can solve the problems of limiting power dissipation, increasing complexity of microprocessors, and design engineers having to deal with massive amounts of information

Active Publication Date: 2008-09-02
ORACLE INT CORP
View PDF14 Cites 5 Cited by
  • Summary
  • Abstract
  • Description
  • Claims
  • Application Information

AI Technical Summary

Problems solved by technology

Consequently, limiting power dissipation has become one of the most stringent design targets.
As the complexity of microproces

Method used


Image

  • Data analysis techniques for dynamic power simulation of a CPU
  • Data analysis techniques for dynamic power simulation of a CPU
  • Data analysis techniques for dynamic power simulation of a CPU

Examples


Embodiment Construction

[0017]The present invention relates to data analysis methods for dynamic power simulation for a microprocessor. In one embodiment, the outputs of a simulator are selectively processed to generate summary information for power behavior of a microprocessor in a run.

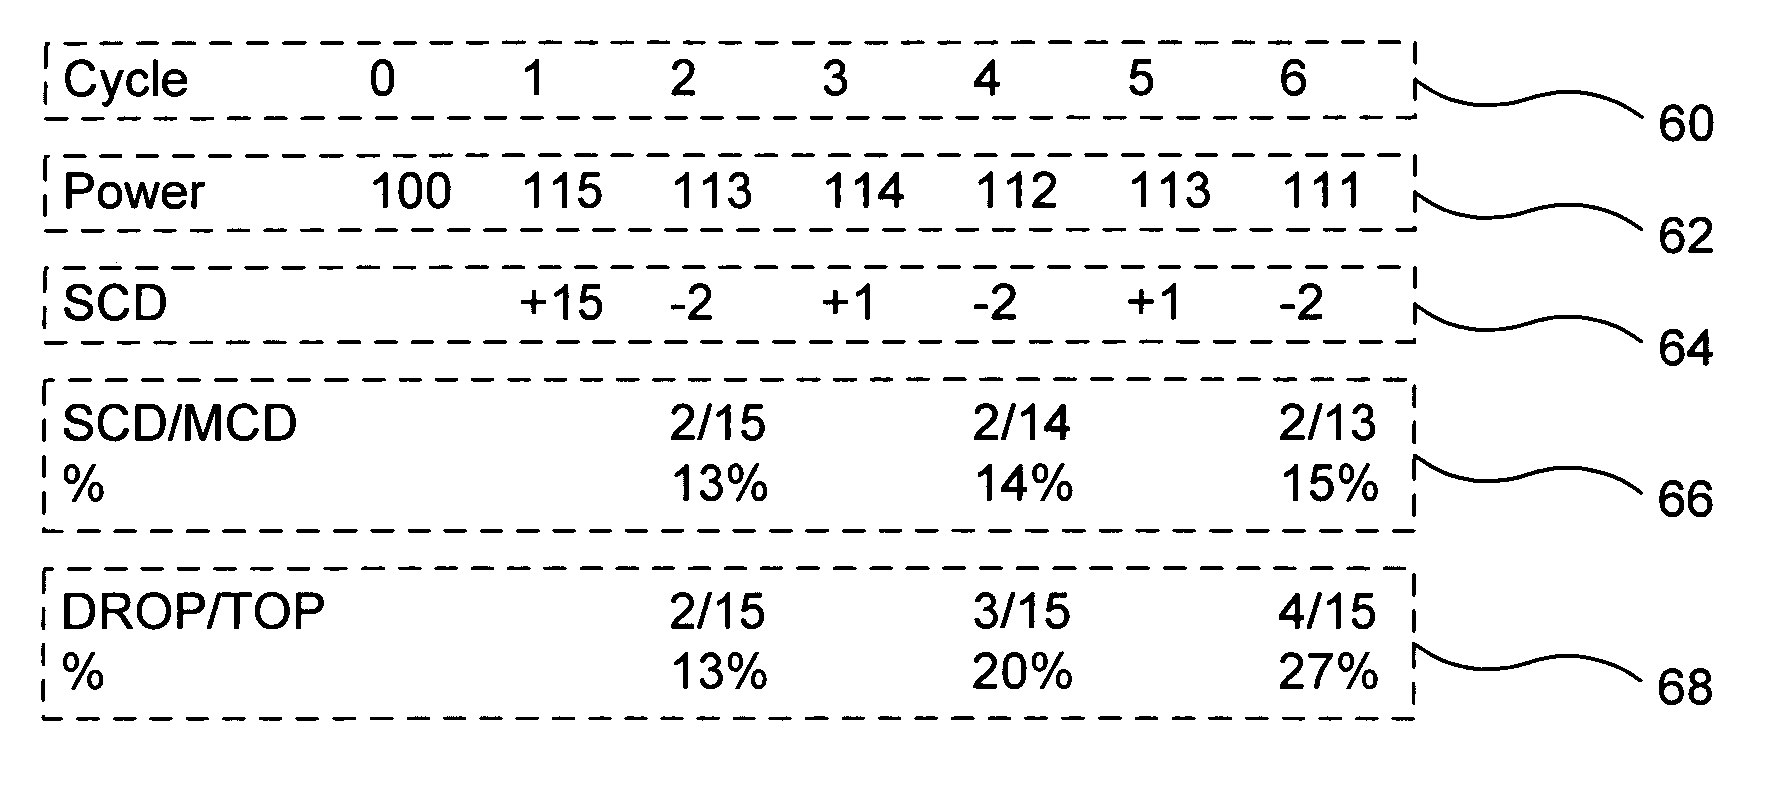
[0018]FIG. 3 shows a process of generating summary information from power simulation data in accordance with an embodiment of the invention. This embodiment includes three types of summary information: single cycle summary data (50); multi-cycle power (MCP) (52); and multi-cycle derivative (MCD) (54). The resources for these summaries are derived from power simulation data (80).

[0019]To observe rises and falls in power data generated from the simulation during each cycle, single cycle summary data (50) is used. The summary (50) provides the absolute values of Peak and Low, which are derived from the absolute values both within a single cycle and over multiple cycles. In the summary, the Peak and Low absolute values are asso...


PUM


Abstract

A method for data analysis of power modeling for a microprocessor has been developed. The method takes multiple values of power data from a power modeling simulator and generates summary data to characterize the power data behavior. Summary data views include results characterizing behavior in a single cycle and behavior across multiple cycles. Data is viewed both at an absolute level to characterize total power and relative to previous levels to characterize power derivatives. Summary data is derived from power generated every cycle when running specific benchmark programs on the power simulator.

Description

BACKGROUND OF INVENTION[0001]1. Field of the Invention[0002]The invention relates to the field of microprocessor design. More particularly, the invention relates to power modeling methodologies for a microprocessor.[0003]2. Background Art[0004]With the increased clock frequencies of modern high-performance microprocessors, power usage has increased as well. Consequently, limiting power dissipation has become one of the most stringent design targets. Thus, it is very important to obtain a model providing information to help engineers understand power behavior in a microprocessor. Typically, power behavior is observed by feeding input information into a simulator and then analyzing the results.[0005]FIG. 1 shows a prior art full-chip power modeling simulation in a microprocessor. CPU activity data is generated each cycle (20) and combined with power values per unit of the activity data (22) using power model equations (24). Three values are provided for each unit of activity data (22)...

Claims


Application Information

Patent Timeline
IPC IPC(8): G06F17/50G06F9/45
CPCG06F17/5022G06F30/33
Inventor BLATT, MIRIAM G.GREENHILL, DAVID J.GAUTHIER, CLAUDE R.AINGARAN, KATHIRGAMAR
Owner ORACLE INT CORP
Why Eureka
Try Eureka